
Abstract
This article discusses the development of countries’ market shares in world shipping over the last 150 years. The analysis is based upon a new and purpose-built indicator: the shipping/trade ratio. This indicator presents the relationship between the merchant marine of a country and the country’s role in world trade. Analysis of the shipping/trade ratio identifies two important developments. First, although the share of the world fleet registered in Europe has dropped significantly, Europe’s role in world shipping over the last 50 years has been more stable than is commonly perceived. Second, there appears to have been an increasing specialisation in the world shipping industry, both among and within continents. Internationally and within Europe, certain ‘super-transporters’ have acquired large market shares, while most countries have relatively limited fleets.
The sea-shore has been the point of departure, to knowledge, as to commerce. The most advanced nations are always those who navigate the most.
1
Introduction
Within naval history, the question of ‘maritime power’ plays an important role. Countless books have been written and numerous careers have been forged trying to define, discuss and debate the question of what constitutes maritime power and who the maritime powers are and have been. 2 Within merchant shipping history, the power question seldom has been explicitly discussed, though it has been an implicit element of national historical narratives. Interestingly, these stories usually focus on ‘Golden Ages’, when the various countries were at the peak of their powers. Thus, the Spanish and Portuguese focus on the start of the early modern period, the Dutch primarily deal with the seventeenth century, British researchers write about the nineteenth century and Greeks about the twentieth century. 3 Maritime power, in a naval sense, of course has been closely related to the international political hegemony – during the Pax Britannica as well as during the Pax Americana. In this article, we discuss the role of the more peaceful maritime activities. There is a clear distinction between nations that ‘see the sea as a source of livelihood’ by engaging in ‘shipping, cross-trading, fishing and whaling’ and countries that see the sea as ‘a source of “power”’. 4 We are interested in the former category, not the latter. 5
The aim of this article is to measure and understand the role of countries and continents in the world shipping industry over the last 150 years. This period saw international trade multiply by a factor of 140, and the share of world exports in world GDP increased from 4.6% to over 17 per cent from the 1870s to around 2000. 6 Shipping and world trade co-evolved. Today, around 90 per cent of global goods trade by volume is carried by ships. 7 A straightforward assumption might be that tonnage grew in those countries and continents that held a large share of world trade. However, a glance at the world fleet today suggests that this is certainly not the case. The big shipping nations are not necessarily big exporters or major importers.
The rest of this article consists of three parts. After the introduction, we start out by explaining the European hegemony in world trade and transports in the nineteenth century. Then, we present the shipping/trade ratio, a new and purpose-built measure that presents the relationship between the merchant marine of a country and the country’s role in world trade. In the final part of the article we explain and nuance the declining role of Europe in the world shipping industry. Along the way we will try to answer three questions: How has the basis for (and composition of) the leading merchant maritime powers developed across time? How can we measure a country’s role in and contribution to international merchant shipping? What has characterised the relationship between a given country’s role in world trade and the same country’s position in international shipping?
The starting point: European hegemony
As Lincoln Paine points out in his magisterial tome on world maritime history, ‘by the fourteenth century a combination of sea and river routes connected all shores of Europe and made it one of the most vibrant, if not yet the richest, trading networks in the world’. 8 During the following centuries merchant shipping was among the most rapidly growing sectors of the European economy, with its centre of gravity moving from the Mediterranean to the North Sea. Jan Lucassen and Richard W. Unger suggest that ‘this pattern of shifting economic leadership alone would suggest that shipping played a significant role in the European economic growth from 1350 to 1850’. 9
However, at the start of this period Europe was not the leading maritime centre internationally. As Paine points out, the ‘trading networks of the Monsoon Seas [the Indian Ocean] between the eleventh and fifteenth centuries were the most dynamic of any in the world, with the longest routes, the busiest ports, and the most diverse selection of goods in circulation’. 10 Similarly, Michael North underlines in his recent world history of seas how trade and shipping intensified around the Indian Ocean from the late medieval times onwards. 11 The subsequent centuries saw the impressive rise, then the relative decline, of Europe – in international shipping as in the world economy.
The rise of Europe in the centuries after 1500, and the shifting power among individual states within Europe, clearly reflected the fact that shipping was one of the prime movers of economic development. 12 According to Unger, shipping was ‘a principal engine of growth, a source of expansion and a critical source of what improvement there was in the European economy in the sixteenth and seventeenth centuries’. 13 In the end, ‘the tyranny of distance’ was overthrown and replaced by ‘the death of distance’. 14 The growth of Europe’s economies and the growth of European shipping were two mutually reinforcing processes. Moreover, the shifts in economic leadership within Europe – from northern Italy to the Iberian Peninsula, to the Netherlands and onwards to Britain – owed as much to the sea as to the land. As Cláudia Rei has suggested, ‘[maritime] transportation technology was responsible for leadership transitions between 1300 and 1900, either through innovation or adoption’. 15
In the centuries after 1500, Europe’s position as the world’s economic, political, military and maritime hegemon was consolidated. The emergence of European empires was based upon – but also facilitated – the continent’s maritime expansion. Gradually an international Europe-centred network was developed, encompassing not only empires and political control, but also mercantilism and trade. 16 Indeed, European expansion hinged upon maritime and naval skills – facilitated by superior technology and organisational abilities. 17 Intercontinental trade – which gradually paved the way for specialisation and division of labour – was primarily maritime in nature; ‘the rise of Europe between 1500 and 1850 was largely the rise of Atlantic Europe and the rise of Atlantic ports’. 18
In the second half of the nineteenth century, when maritime leadership became effectively married to Europe’s technological advantage, the shifts from sail to steam and wood to steel and iron ensured that the European hegemony peaked. Thereafter, into the twentieth century, larger and more specialised ships utilising diesel power at first kept the leadership within the Western world. However, gradually a combination of institutional changes and rapid shifts in the pattern of production and trade, particularly towards Asia, became a threat to that hegemony.
By the end of the nineteenth century Europe depended upon shipping for its welfare, and the international shipping industry depended on Europe for supply of transport and ships. Its dominance was strengthened as sailing ships gave way to modern tonnage in the second part of the nineteenth century. Table 1 illustrates the dominance of Europe in general, and the UK in particular, by 1874.
Distribution of the ownership of the international ocean-going fleet, 1874. 19
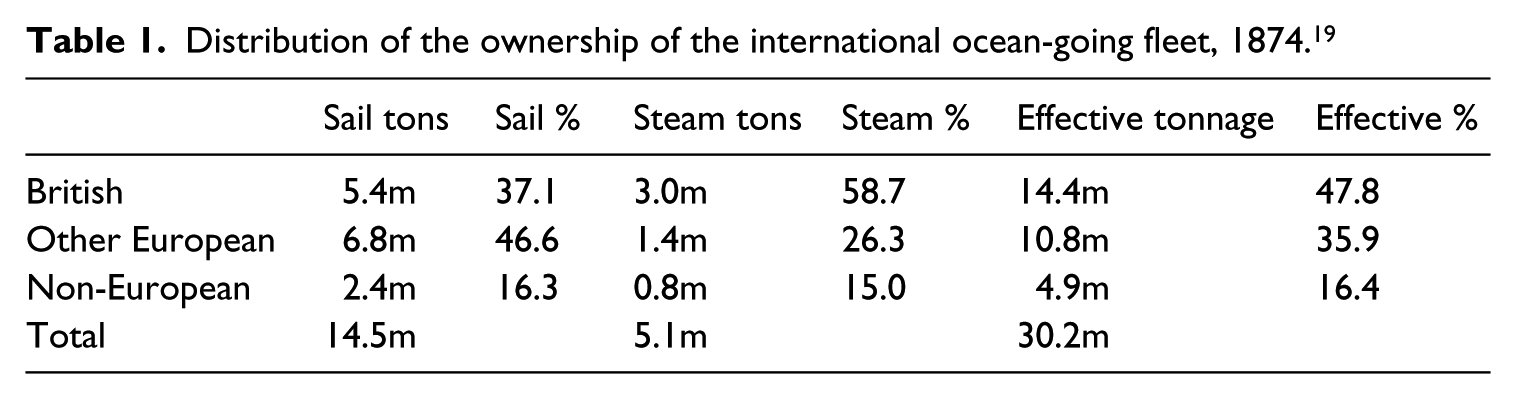
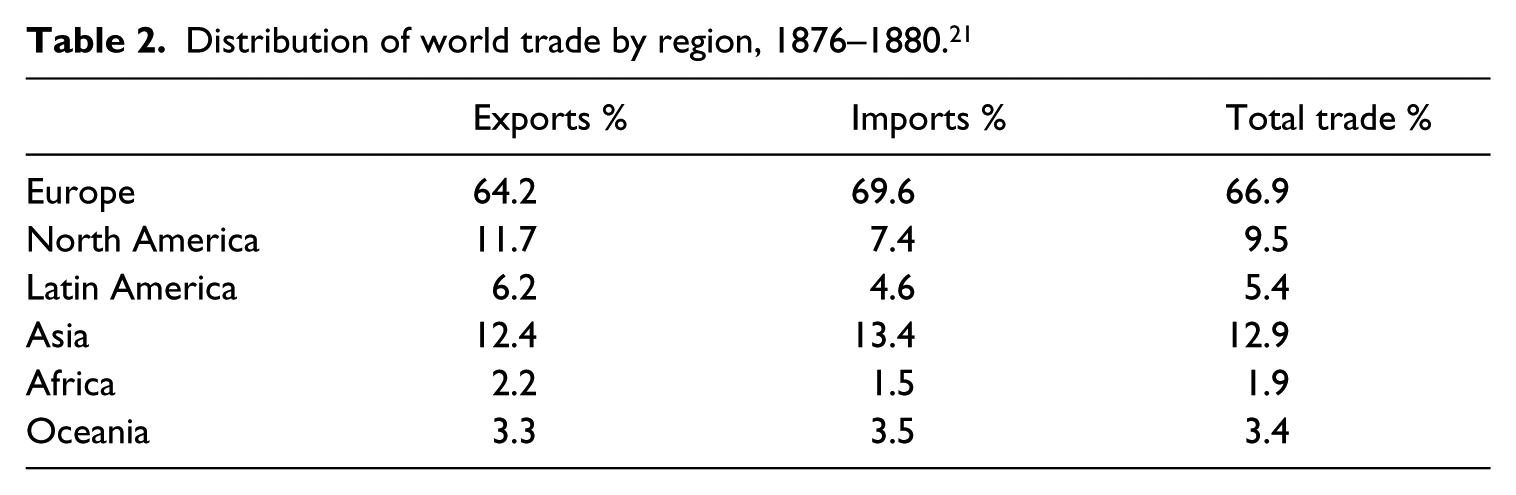
World shipping was centred upon Europe, both with regard to the production of transport and with regard to the production of ships. Indeed, in ‘the two decades before the First World War British shipyards constructed over 60 per cent of world tonnage’. 20 The fact that more than half of this was for the country’s own shipping companies is a testament to the UK’s hegemonial role within shipping at that time. Long-distance seaborne transport was clearly a European endeavour. However, the leadership clearly reflected the European countries’ roles as the most important agents in a network of international trade. Table 2 shows that around this time Europe was responsible for more than two thirds of world trade.
Distribution of world trade by region, 1876–1880. 21
Europe’s indisputable leadership within trade and shipping continued into the twentieth century, before embarking on a gradual long-term decline, where the two World Wars played particularly important roles. The wars dismantled established international trade patterns, enabling new countries to build up competitive production, while destroying productive capacity in Europe. In relative terms, no sector experienced destruction of existing production capital as strongly as shipping.
22
During each war substantial portions of the merchant marine were lost at sea, and European countries were of course adversely affected: In June 1914 the shipping of the United Kingdom alone comprised nearly 44 per cent of the world steam tonnage; for the British Empire the proportion was 47.5 per cent. By June 1919 these percentages has sunk respectively to 36 and 39.
23
Interestingly, after both wars, the European fleet rapidly regained its relative standing, although there were variations in the extent to which countries managed to re-establish their position.
The rebuilding of the fleet after the First World War was facilitated by the large number of ships on order at British and American yards when the war ended. The world fleet in 1919 was actually larger than it had been when the war broke out. However, with shipping markets deteriorating rapidly in the inter-war period, European tonnage never managed to regain the important economic role it had played up to 1914. During and after the Great Depression the size of most European fleets declined; in the case of the UK the reduction was almost 12 per cent from 1929 to 1939. The British decline practically neutralised the growth in the few European nations that increased their fleets. 24
The Second World War was another massive blow to the European fleet but, from the late summer of 1942, Allied construction of new tonnage outpaced losses at sea. Still, by 1948 the European fleet was more than 15 per cent smaller than it had been in 1939, though the world fleet had increased by almost 18 per cent. The basis for the subsequent European rebound was a massive sell-off of war-built tonnage by the United States. In the late 1940s and early 1950s, mass-produced Liberty general cargo carriers and T2-tankers were bought up by European shipping companies adding to the new-builds ordered during or just after the war. Nevertheless, although the pre-war tonnage volume had been regained by 1952, the European share of the world fleet had fallen to 48 per cent, down from 63 per cent in 1939. 25
To summarise, Europe’s strong position in international merchant shipping in the nineteenth and early twentieth centuries was intimately intertwined with the continent’s role in world trade – as the centre of an international trading system, held together by a combination of colonial and commercial connections. The fatigue of two wars, as well as the spread of modern economic growth to other parts of the world, affected Europe’s international standing. Thus, the gradual reduction of the hegemonic role within shipping mirrors the region’s dwindling position in the global economy.
The ‘shipping/trade ratio’: Measuring market shares in merchant shipping
In order to gauge Europe’s position – and the development of this position across time – we have developed a measure that we call the shipping/trade ratio. While similar comparisons have been made before, to our knowledge there has been no systematic analysis of the development of the shipping/trade ratio across time. 26 The reasoning behind the indicator is that there is likely to be some kind of relationship between a country’s role in the international economy and its role within shipping.
Table 3 shows the shipping/trade ratios, calculated on the basis of the information from the two previous tables. The final column – the ratio itself – has an intuitive interpretation: values greater than one imply that the region is ‘over-represented’ in shipping relative to trade, and thus exports shipping services to others. A value of less than one implies that the country has a higher proportion of world trade than of the world fleet, and thus has to be a net importer of shipping services. In the case of Europe, the value 1.107 implies that the continent’s share of the effective tonnage was 10.7% higher than its share of world trade.
The shipping/trade ratio, second half of the 1870s. 27
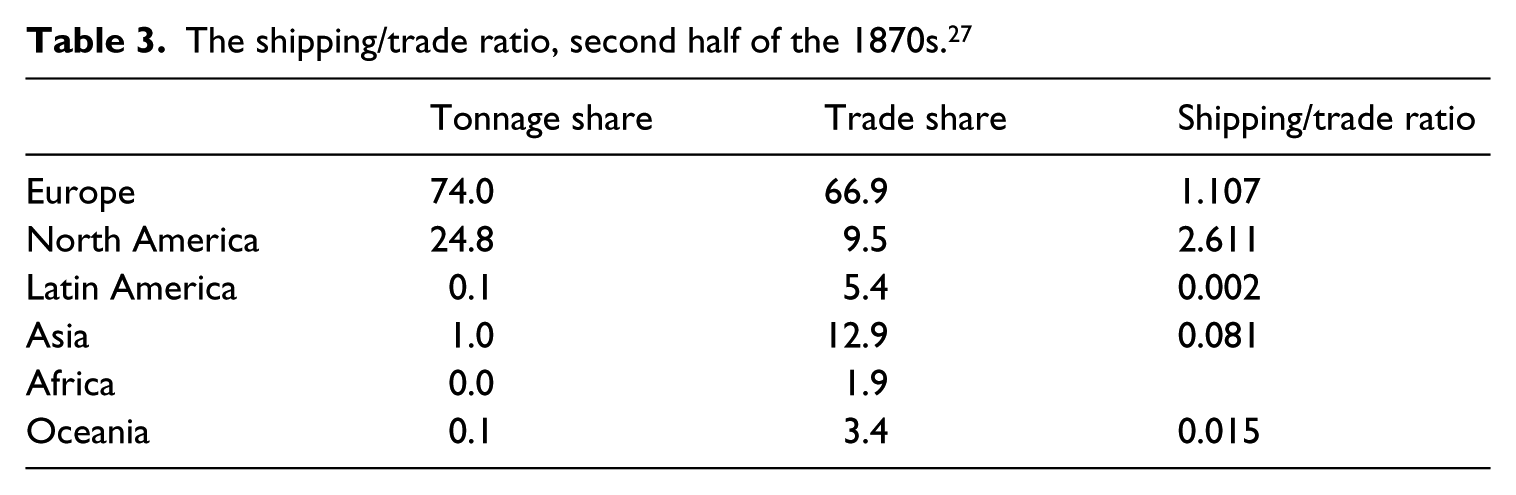
The shipping/trade ratios from the 1870s reveal that Europe and North America were not only dominant in world trade, but had an even stronger position in world transport. Internationally traded goods from all over the world primarily travelled on European and North American keels. Britannia, her neighbours and her descendants truly did rule the waves.
Several data issues create ambiguity when computing the shipping/trade ratio, thus it is impossible to have a clear-cut definition that is consistent across time and across countries. At the same time, the distinctions between various methods of measurement might also provide us with information that actually helps to understand the processes that have been taking place.
With regard to trade statistics, the main caveat is the fact that they tend to be based on value, whereas, for shipping, the volume of (maritime) trade would be the best approximation of a country’s needs for a merchant fleet. 28 In most countries and regions there is a large discrepancy between imports and exports, which makes the choice of indicator important. For the Middle East, for instance, the volume of seaborne exports was approximately six times higher than the import volume around 2000, whereas the value of the two was practically equal. 29
The data are also affected by the fact that not all goods transports are subject to the same competition. Shipping has always been the preferred mode of transport for high-weight/volume and low-value cargoes, with the attractiveness of shipping increasing with the distance between exporter and importer. 30 Consequently, the role of air transport (for high-value cargoes) and road/rail transport (for shorter distances, for instance within Europe) is not taken into account when calculating the shipping/trade ratio. 31
The data issues become even more problematic when we consider the question of how to measure the various countries’ and regions’ merchant marines. Tonnage measurements vary with time, ship type and the purpose of the study, and are a topic that never fails to engage maritime historians. 32 For recent periods there is also the question of which ships to include in a specific country’s merchant marine; the nationality of a ship – or indeed a full fleet – can be changed in less than 24 hours.
Table 4 presents the shipping/trade ratio for 1969. Relative to the data approximately a century earlier, two things stand out. First, the data – both for trade and for the fleet – are more evenly distributed across continents; the standard deviation falls by around 40 per cent. Second, only two major regions are substantially ‘out of sync’ when it comes to the difference between the tonnage share and the trade share, viz. North America and Africa. It is interesting to note that the North American tonnage ‘deficit’ of 10.3 percentage points matches relatively well the African tonnage ‘surplus’ of 8.8 percentage points. This is not a coincidence, but a reflection of regulatory innovation: Flags of Convenience (FoCs).
The shipping/trade ratio, 1969. 33
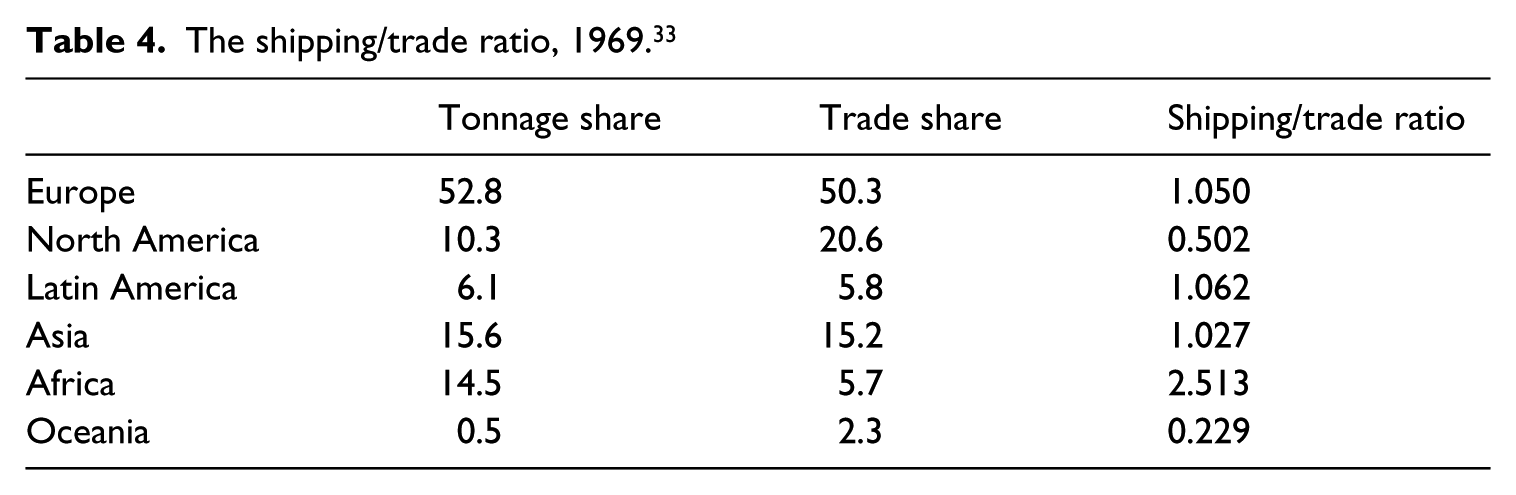
Why is the direct comparison of the North American and African shares relevant? The answer can be found two places, namely in Liberia, in western Africa, and in the offices of the company Stettinius Associates of New York. 34 The Liberian ship registry was ‘born’ and managed from these offices, with the link to the African homeland extremely weak. In fact the only link between ships registered in Liberia and the country itself was the flag, the letters ‘Monrovia’ on the stern and a small annual levy – the majority of the ships were owned by foreigners. Quite a lot of these owners originated in the US, where local lawyers offered everything that was necessary to join the Liberian set-up.
In the middle of the 1960s the Liberian fleet surpassed the British fleet to become the world’s largest. The country was the most successful FoC, implying that the high shipping/trade ratio of Africa is a mirage. 35 If we take away Liberia, then the continent’s fleet falls by almost 95 per cent, with a corresponding decline in the shipping/trade ratio. Similarly, the Panamanian FoC made up 40 per cent of the tonnage of Latin America. Thus, by adjusting for these two special cases, both Africa and Latin America go from a shipping/trade ratio above unity (1) to one well below.
The use of FoCs was ‘of little practical significance until after the Second World War’. 36 Between the wars there was no need for ships to re-flag in order to deceive an enemy, which was its original purpose. Rather, the avoidance of (alcohol) prohibition and attempts to keep wage levels low were the main motivating factors in the first half of the twentieth century. Even then the extent of FoCs was very limited, and this continued until the 1950s and 1960s when the practice became more widespread. The growing tendency to register ships in FoC countries was far from universal, but confined to shipping companies in a handful of countries. By the end of the 1960s ships under ‘Greek, United States and Italian ownership accounted for at least 70% of all tonnage under flags of convenience’, followed by owners from Hong Kong (around five per cent) and Formosa (Taiwan). 37
By 1971 the fleet flying the Liberian flag was the world’s largest, more than a quarter bigger than Japan in second place. In fact, at more than 38 million gross tons, the Liberian fleet was larger than the total world fleet had been at the beginning of the century – a fact that puts the strong growth of the world fleet into perspective. Because of the upheaval caused by the shipping crises of the 1970s and 1980s, the use of FoC registries became far more widespread, but also more complex. More countries allowed flagging out to foreign registries, and though the introduction of ‘open registries’ enabled a return to the home flag, the link between vessel ownership and flag had been severed. 38 Consequently, when we move to the new millennium, the shipping/trade ratio – as we have presented it up until now – in many ways loses relevance.
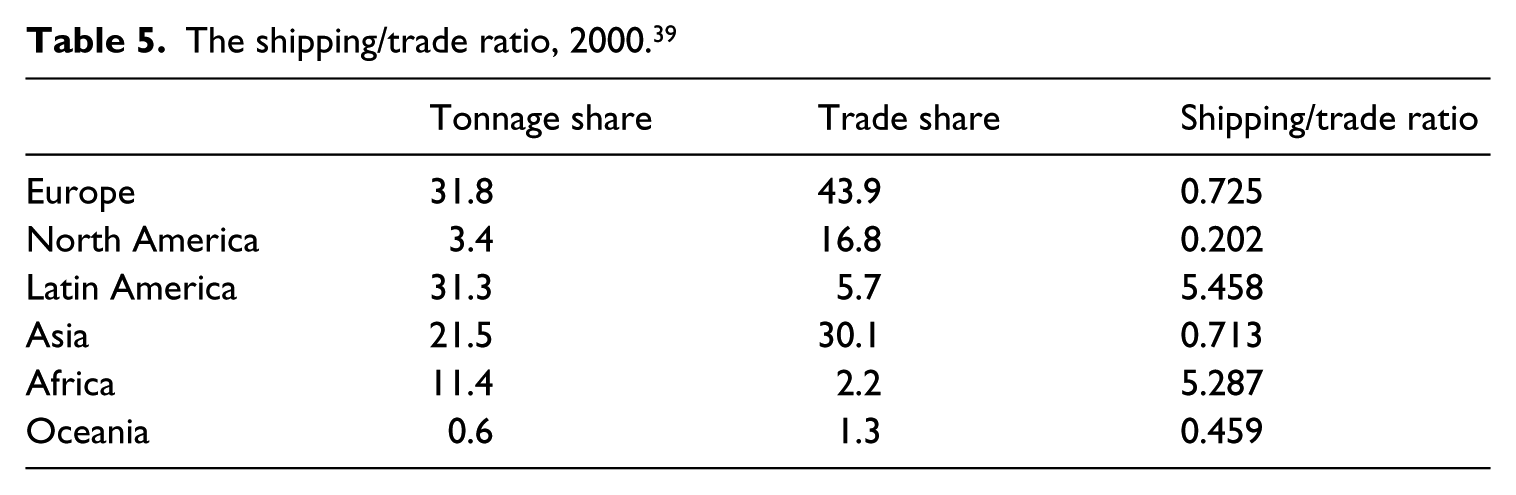
If we take the shipping/trade ratio to indicate competitiveness, then Europe’s role has clearly declined, dropping from slightly above to substantially below unity, as shown in Table 5. The data also reveal the enormous overrepresentation of Latin America and Africa – apparently, these two regions have taken over as the world’s transporters, with an aggregate share of more than 40 per cent of the world fleet. The answer to this surprising development is simple, however: the joint share of Panama and Liberia increased further, as seen from Figure 1, practically killing off the link between flag and fleet.
The shipping/trade ratio, 2000. 39
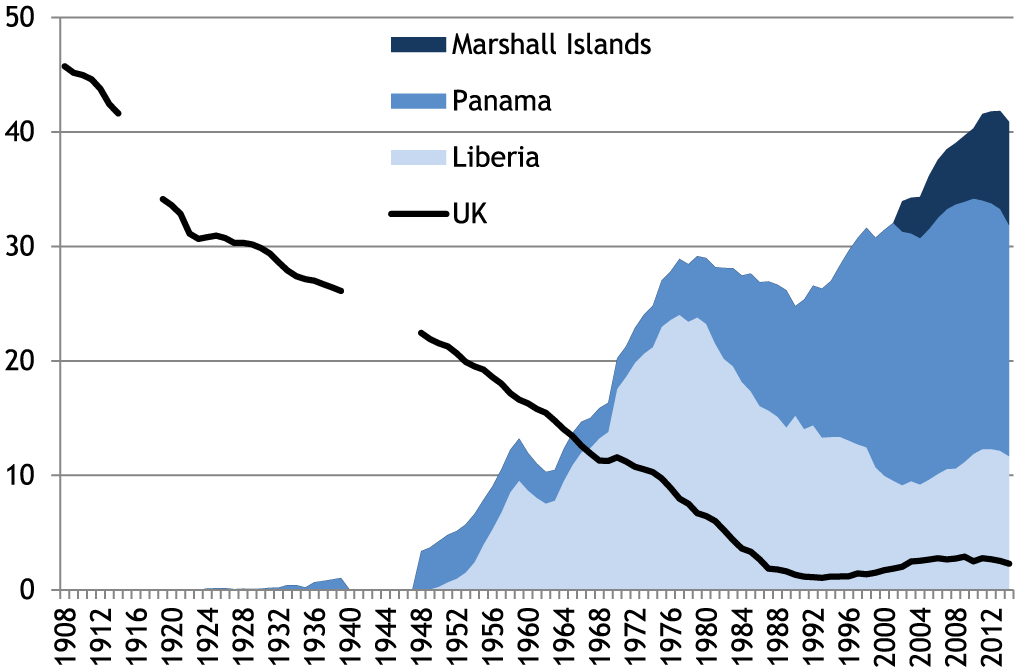
The shifting hegemony, shares of the world fleet (per cent), 1908–2014. 40
There is of course a fundamental difference between how the leading FoC influence international shipping today, compared with how the UK – with a similar share of the tonnage – did a century or so ago. At that time, the Red Ensign represented maritime hegemony and superiority. Today, the leading flags – Panama, Liberia and the Marshall Islands – symbolise the manner in which the shipping industry, like global business in general, has introduced institutional innovations in an eternal quest to reduce cost.
In order to understand the real situation in today’s global shipping industry, we need to go behind the flag data, and look at who really owns the fleet. At this point it might also be appropriate to go from the level of the continent to the country, for within the various continents there are enormous differences in the shipping/trade ratio, and the degree to which the flag data give a fair representation of the real ownership also varies substantially. Table 6 presents two alternative measures of the shipping/trade ratio for the most important maritime and trading nations, with European countries on the right hand side and other major traders on the left. Two measures are presented for each country: STR1, which is what we have been considering so far, and a new measure STR2 calculated on the basis of country of domicile of the owners, rather than the flag of the ship.
The shipping/trade ratios, 2000. 41
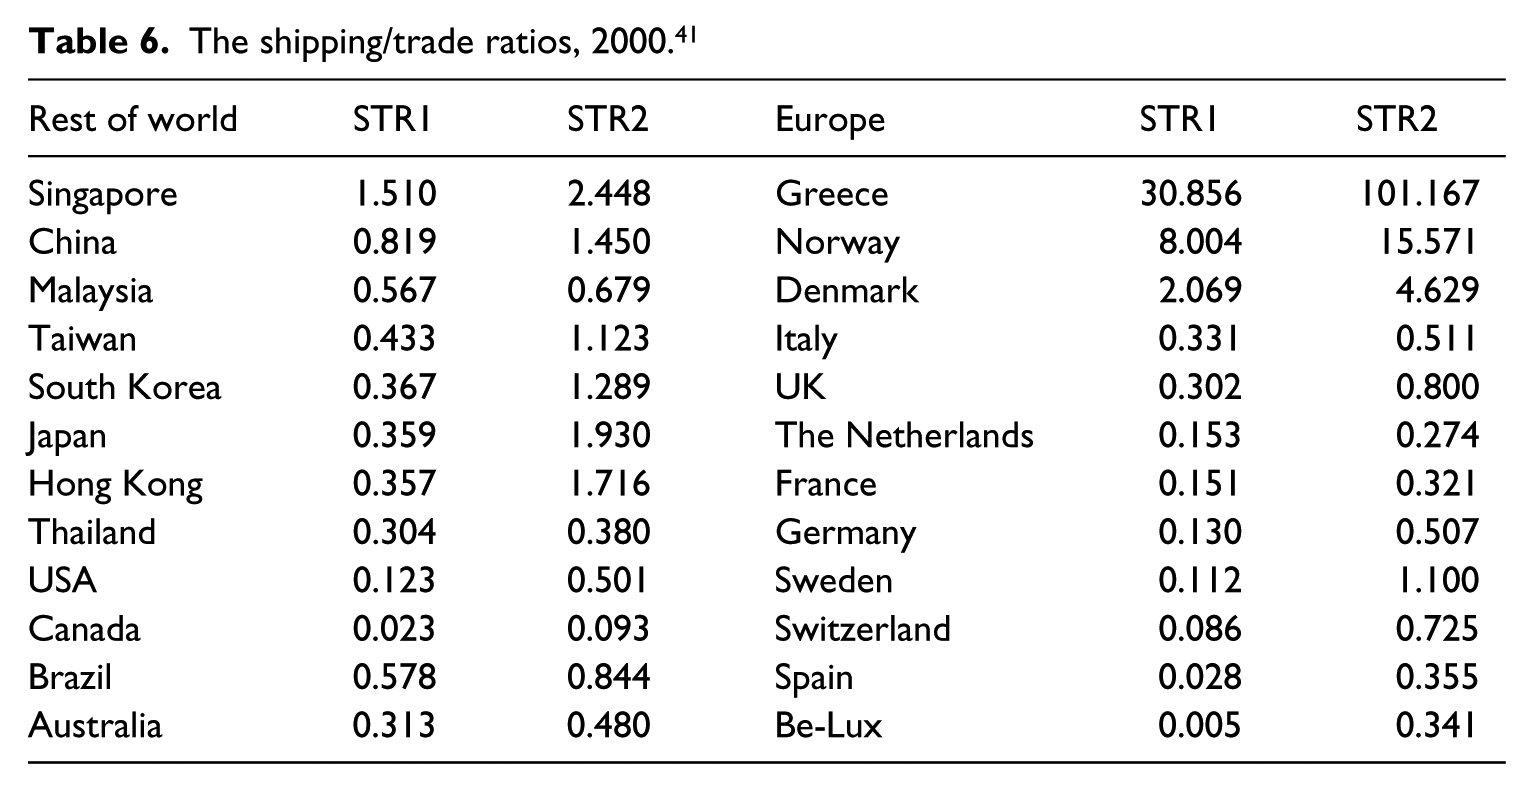
The data in Table 6 reveal a number of interesting features. First, the ranges of STR1 and STR2 within Europe are astonishing – from 0.005 (STR1) in the case of Belgium-Luxembourg to more than 100 (STR2) in the case of Greece. The large variation reflects the fact that some countries (Greece, Norway, Denmark; and Singapore in the world group) can be classified as ‘super-transporters’, with a merchant marine that far outstrips these countries’ own needs. Second, while STR1 is positive for only four of the countries in the sample (one-sixth), STR2 is positive for more than 40 per cent of the countries. Finally, the most important maritime nations in Asia (China, Japan and the first generation tigers) appear to have more tonnage than their share of world exports should indicate – STR2 is above unity for all of the major Asian manufacturing exporters. 42 This might be explained by the fact that the majority of their trade – imports of bulky raw materials and exports of finished goods – creates a shipping need over and above what a simple ‘value-of-exports’ share indicates. 43
European decline in perspective
The European-registered share of the world fleet has declined substantially, but the analysis above has suggested that there has been some element of exaggeration in the decline. In a ‘worst-case’ scenario, the market share of the European fleet falls from around 84 per cent of the world fleet in the 1870s to around 22 per cent by the year 2000. 44 However, if we take into account the fact that Europe’s share of world trade falls from two-thirds to slightly over 40 per cent, we see that the decline is not solely a ‘shipping phenomenon’. A declining share of the shipping market is mirrored by a drop in the share of the world economy. Moreover, if we deduct intra-EU trade, which is less likely to be seaborne than world trade in general, the European share of world trade becomes much lower. 45 In fact, only three countries – Greece, Malta and the UK – trade more with ‘outsiders’ than with other EU countries, and in 2002 more than two-thirds of the trade was intra-EU trade. 46 Indeed, if we treat the EU as one country, the share of world exports becomes around 17 per cent in 2005. By 2014 this had been reduced to less than 15 per cent, and China had a larger share of world exports than Europe. 47
We also have to take into account the fact that on average around 60 per cent of the European fleet was registered abroad. 48 This implies that rather than the 20 per cent of the fleet flagged in Europe, it would be more correct to use a number around 50 per cent, which refers to the share of the world fleet controlled by Europeans. In that case, the decline in the share of world trade – by around a third – is actually higher than the decline of the fleet. Based on the ownership measure, the shipping/trade ratio would be around 1.2 – so, even higher than in the 1870s. In other words, if we take market share as a measure of competitiveness, Europe’s apparently declining role in international shipping actually shows the opposite tendency. 49 Other ways of evaluating the shipping sector strengthen our argument that reports of the death of European shipping are greatly exaggerated.
How, then, can we explain the continued important role of high-cost Europe in one of the most competitive international industries? There is little doubt that the historical element – path dependence, if you like – has been very important. Europe’s share of the shipping sector per se has declined steadily, but from an extremely high level. Two further clarifications are in order. First, certain institutional innovations – including FoCs – have enabled European shipping to stand its ground. Second, there have been a large array of different trajectories within Europe; some countries have improved their position substantially, while others have suffered equally spectacular declines.
Table 7 compares the registration and the ownership of the world fleet in 2010. The left-hand side shows where the ships are registered. With the exception of Greece, the countries in the Top 10 are either FoC or rapidly growing shipping nations in Asia, followed by South Korea and Japan and three European countries. The latter have been among the most important maritime nations in the post-war period, but have seen the tonnage flying the country’s own flag greatly reduced. In 1970, more than 20 per cent of the world fleet was registered in Norway, the UK and (West) Germany (8.5%, 11.4% and 3.5% respectively) – the aggregate share in 2010 was 4.3%.
Shipping Top 15 – by registry and control (deadweight tons: dwt), 2010. 51
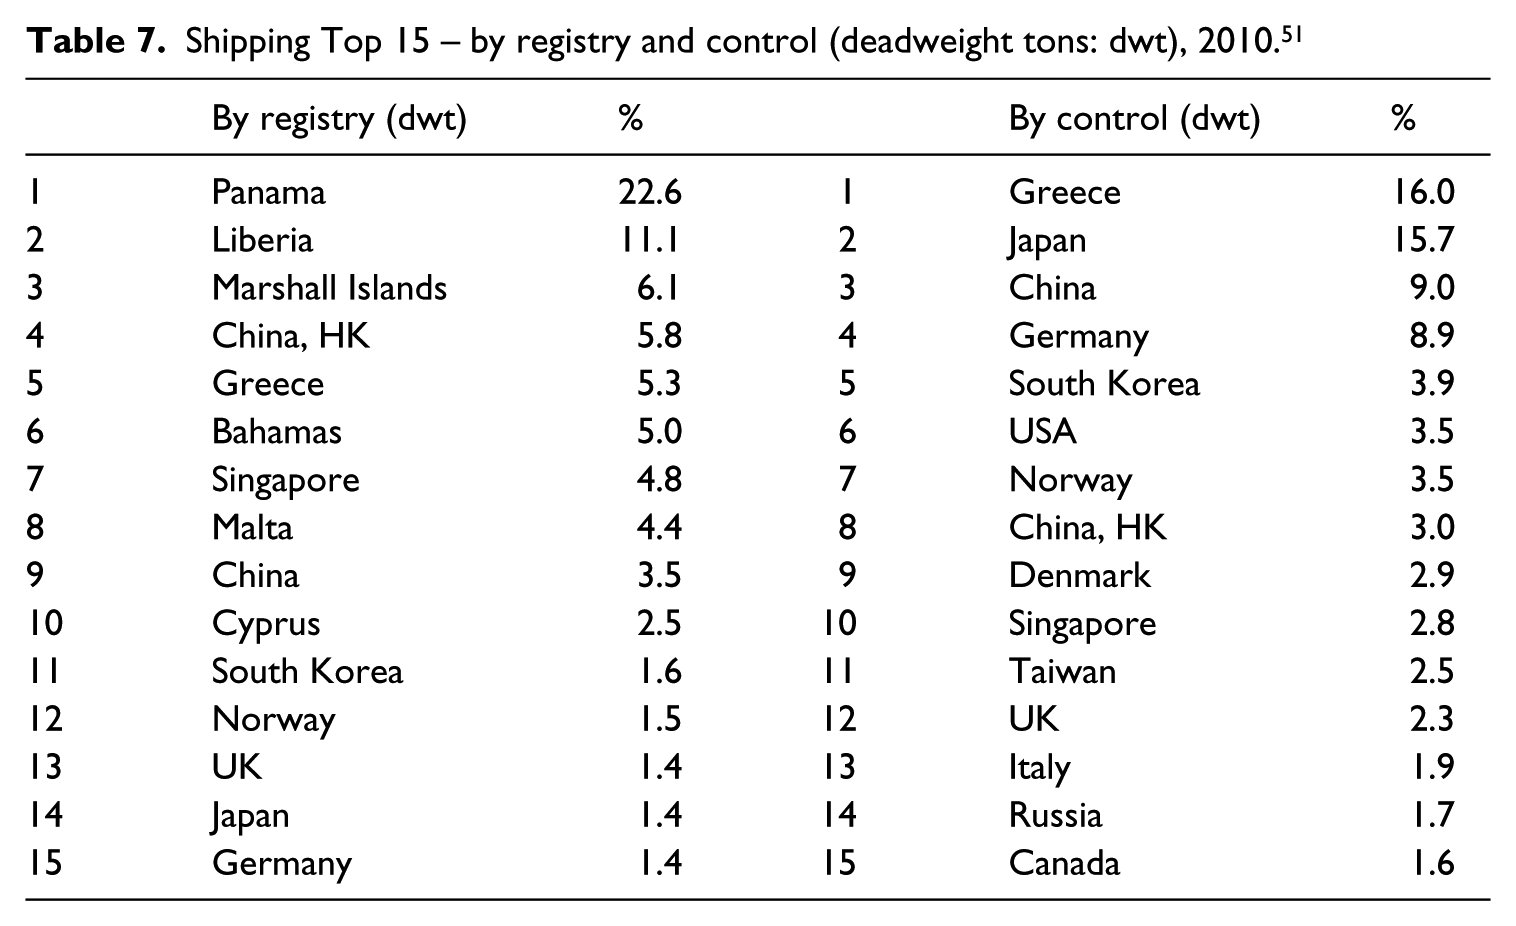
The right-hand side is based on control of the fleet. The data show that many of the countries that have dominated shipping over the last century continue to do so. For the three countries mentioned above the share of the world fleet has fallen by around a third, and the relative strength of the countries has been turned on its head. Still, the growth of Germany – from 3.5% in 1970 to 8.9% (of ownership) – can give us an indication of the basis for European resilience. In Germany there have been some extremely efficient ways to organise shipping investments. 50 For instance, the existence of limited partnerships (Kommanditgesellschaft) has ensured a steady inflow of money from ‘doctors and dentists’ looking for tax-beneficial investments. The major shipping banks are also European, and in their perimeter a number of ‘project developers’ and ‘project brokers’ ensure that some European countries have an extremely efficient system to raise private capital for shipping investments.
Table 7 also reveals that the main challenge to the European leadership has come from Asian countries. Still, it is interesting to see that a number of formerly important European shipping nations have fallen by the wayside. The spectacular fall of the UK, a decline in market share of 95 per cent, occurred more or less evenly over the span of eight decades, although in recent years UK shipping investments have actually increased slightly. Other countries, such as France and Sweden, have gone from having large merchant marines (in total around five per cent of the fleet in 1970) to becoming more or less invisible in today’s shipping sector (an aggregate ownership share of one per cent in 2015). 52 Though these countries still have a handful of shipping companies that manage to compete and are still present in the industry, it would be wrong to claim that there is any kind of dynamic ‘shipping environment’ in France or Sweden. 53
Conclusion
The spectacular growth of world trade has increased the need for cargo-carrying capacity. As Pamuk and Williamson point out, ‘Transport revolutions in international shipping had a spectacular impact on commodity price convergence and trade in the world economy’. 54 As in many other areas of globalisation, the fruits of this development were not evenly distributed. European and to some extent US shipping tonnage was used to propel the first era of globalisation during the nineteenth century, but during the second era this marked concentration has disappeared. Regulatory innovations such as FoCs and the rise of Asia in world trade and the transport sector changed this picture. The result was the apparent decline of European and US shipping.
In this article we have created a metric to analyse the ratio between the share of world trade and world tonnage; the shipping/trade ratio. The data clearly show how Eurocentric world trade and shipping were during the first era of globalisation. However, the picture of the development after the Second World War was more mixed, with FoCs changing the rules of the game. Looking at the flag of the ship does not necessarily reveal the ‘realities’ in world shipping. Therefore, with more in-depth analyses we also calculated the shipping/trade ratio based on ownership, which implies that the decline of European shipping is not as significant. Indeed, Greece, Norway and Denmark clearly play much more important roles as cross-traders than emerging economies in Asia. The competitive advantage of these European countries has been the ability to transform their businesses to suit the global competition through specialisation and by adapting regulatory innovations (such as double registry). 55 Nevertheless, in a globalising world, and in shipping in particular, the country of origin and flag has lost its previous relevance, irrespective of the metrics employed.
Measuring shipping tonnage is a challenging task with historical and current data. Still, we argue that the shipping/trade ratio developed in this article might reveal some ‘hidden’ structures both in world trade and in shipping over an extended period. Thus, it might provide a broader picture of the outcomes of the first and second eras of globalisation. Further analysis is required to calculate shipping/trade ratios within different commodity trades, for specific countries and for various types of shipping. As the shipping industry has become more global, merchant maritime power has become much more dispersed. Europeans no longer rule the waves; but nor do they ‘rule the world’ like they did at the high-water mark of formal imperialism in the late nineteenth century.
Footnotes
1.
Ralph Waldo Emerson, Society and Solitude, new and revised edition (Boston, 1886), 24–5.
2.
In William R. Thompson, ed., Great Power Rivalries (Columbia, 1999) the contributors present a series of maritime powers and their struggles for supremacy: Genoa, Venice, Portugal, the Netherlands, Great Britain and the United States. In addition, several unsuccessful challengers to the maritime powers are presented: the Ottoman Empire, France, Russia, Germany, Japan and the Soviet Union. The question is still relevant; see for instance Thomas M. Kane, Chinese Grand Strategy and Maritime Power (London, 2002). Naval historians seldom explicitly focus on the interdependence between navies and merchant marines. Two exceptions are Greg Kennedy, ‘Maritime Strength and the British Economy 1840–1850’, The Northern Mariner/Le Marin du Nord, 7, No. 2 (1997), 51–69; and Andrew Lambert, ‘Economic Power, Technological Advantage, and Imperial Strength: Britain as a Unique Global Power, 1860–1890’, International Journal of Naval History, 5, No. 2 (2006).
3.
Jari Ojala and Stig Tenold, ‘What is Maritime History? A Content and Contributor Analysis of the International Journal of Maritime History, 1989–2012’, International Journal of Maritime History, 14, No. 2 (2013), 17–34 (at 27). For less triumphant analyses, focusing on periods of national decline, see Stanley Sturmey, British Shipping and World Competition (London, 1962) or Yrjö Kaukiainen, Sailing into Twilight: Finnish Shipping in an Age of Transport Revolution, 1860–1914 (Helsinki, 1991).
4.
Gunnar Sletmo, ‘The End of National Shipping Policy? A Historical Perspective on Shipping Policy in a Global Economy’, International Journal of Maritime Economics, 3, No. 4 (2001), 333–50 (at 340).
5.
We also choose to ignore the harvesting of the sea’s resources, through fishing and whaling, focusing instead on shipping in general, and cross-trading in particular. Cross-trading refers to the practice where a ship from country A transports goods between countries B and C.
6.
Angus Maddison, ‘The West and the Rest in the World Economy: 1000–2030’, World Economics, 9, No. 4 (2008), 75–99. During the same period, world population grew six-fold and world output roughly 60-fold (thus, ten-fold in per capita terms). See also the historical overview in Part B of WTO World Trade Report (2013) Factors Shaping the Future of World Trade, ![]() [accessed 21 July 2017].
[accessed 21 July 2017].
7.
This figure is of course highly speculative, but one that the shipping industry and also maritime historians like to use; see International Chamber of Shipping, ![]() [accessed 22 May 2016]; and Rose George, Ninety Percent of Everything: Inside Shipping, the Invisible Industry that Puts Clothes on your Back, Gas in your Car and Food on your Plate (New York, 2013); published in the UK as Deep-Sea and Foreign-Going: Inside Shipping, the Invisible Industry that Brings you 90% of Everything. See also Michael North, Zwischen Hafen und Horizont: Weltgeschichte der Meere (Münich, 2016), 293. The share of course depends on the type of measure used. If we look at value, for instance, shipping’s share of world transports would be much lower, for ships are the preferred mode of transport for low-cost, high-volume/weight goods that travel over long distances. Consequently, a measure that takes into account both the amount/weight of goods traded and their distance is likely to produce a figure around the 90 per cent quoted above.
[accessed 22 May 2016]; and Rose George, Ninety Percent of Everything: Inside Shipping, the Invisible Industry that Puts Clothes on your Back, Gas in your Car and Food on your Plate (New York, 2013); published in the UK as Deep-Sea and Foreign-Going: Inside Shipping, the Invisible Industry that Brings you 90% of Everything. See also Michael North, Zwischen Hafen und Horizont: Weltgeschichte der Meere (Münich, 2016), 293. The share of course depends on the type of measure used. If we look at value, for instance, shipping’s share of world transports would be much lower, for ships are the preferred mode of transport for low-cost, high-volume/weight goods that travel over long distances. Consequently, a measure that takes into account both the amount/weight of goods traded and their distance is likely to produce a figure around the 90 per cent quoted above.
8.
Lincoln Paine, The Sea and Civilization: A Maritime History of the World (London, 2014), 345. Unless otherwise specified, ‘Europe’ refers to Western Europe.
9.
Jan Lucassen and Richard W. Unger, ‘Shipping, Productivity and Economic Growth’, in Richard W. Unger, ed., Shipping and Economic Growth 1350–1850 (Leiden, 2011), 1–44 (at 4).
10.
Paine, Sea and Civilization, 375.
11.
North, Zwischen Hafen und Horizont, 155.
12.
See, for example, Douglass C. North, The Economic Growth of the United States, 1790–1860 (New York, 1961).
13.
Richard W. Unger, ‘Shipping and Western European Economic Growth in the Late Renaissance: Potential Connections’, International Journal of Maritime History, 18, No. 2 (2006), 85–104 (at 104).
14.
Geoffrey Blainey, The Tyranny of Distance: How Distance shaped Australia’s History (Melbourne and London, 1966); and Frances Cairncross, The Death of Distance: How the Communications Revolution will Change our Lives (Boston, 1997).
15.
Cláudia Rei, ‘The Role of Transportation Technology in Economic Leadership’ (Manuscript, Boston University, 2002), 3.
16.
See, for instance, Immanuel Wallerstein, The Modern World-System I: Capitalist Agriculture and the Origins of the European World-Economy in the Sixteenth Century (New York, 1974). For an interesting review article on Europe’s maritime dominance, see John E. Wills jr., ‘Maritime Asia 1500–1800: The Interactive Emergence of European Domination’, American Historical Review, 98, No. 1 (1993), 83–105.
17.
There was, however, a depreciation of skill on merchant sailing ships from the eighteenth century onwards that was related to the simplification of rigging and ship types, increase in ship size, standardisation of work processes, and increased security at sea. See especially Niklas Frykman, ‘Seamen on the Late Eighteenth-Century European Warships’, in Marcel van der Linder and Karl Heinz Roth, eds., Beyond Marx: Theorising the Global Labour Relations of the Twenty First Century (Leiden, 2014), 41–64. On naval skills during the sailing ship era see Jelle van Lottum and Jan Luiten van Zanden, ‘Labour Productivity and Human Capital in the European Maritime Sector of the Eighteenth Century’, Explorations in Economic History, 53, No. 1 (2014), 83–100; Jelle van Lottum and Bo Poulsen, ‘Estimating Levels of Numeracy and Literacy in the Maritime Sector of the North Atlantic in the Late Eighteenth Century’, Scandinavian Economic History Review, 59, No. 1 (2011), 65–80; and Jari Ojala, Jaakko Pehkonen and Jari Eloranta, ‘Deskilling and Decline in Skill Premiums During the Age of Sail: Swedish and Finnish Seamen, 1751–1913’, Explorations in Economic History, 61 (July 2016), 85–94. On the changing demand for skill during the introduction of steam see especially Peter Thompson, ‘Technological Change and the Age–Earnings Profile: Evidence From the International Merchant Marine, 1861–1912’, Review of Economic Dynamics, 6, No. 3 (2003), 578–601. The more recent period is covered expertly by Michael Miller, Europe and the Maritime World: A Twentieth-Century History (New York, 2012).
18.
Daron Acemoglu, Simon Johnson and James Robinson, ‘The Rise of Europe: Atlantic Trade, Institutional Change and Economic Growth’, American Economic Review, 95, No. 3 (2005), 546–79 (at 572).
19.
Based on data from ‘General List of Merchant Shipping of All Nations’, published by Bureau Veritas, and reprinted in Henry Jeula, ‘The Mercantile Navies of the World in the Years 1870 and 1874 Compared’, Journal of the Statistical Society of London, 38, No. 1 (1875), 81–2. Tonnage refers to gross tonnage, and percentages to the various countries’ shares of the world fleet. In order to calculate the effective tonnage, steam tonnage has been multiplied by a factor of three relative to sail tonnage; confer A. N. Kiær, ‘Historical Sketch of the Development of Scandinavian Shipping’, Journal of Political Economy, 1, No. 3 (1890), 360–1.
20.
Anthony Slaven, British Shipbuilding 1500–2010 (Lancaster, 2013), 46.
21.
Based on data from P. Lamartine Yates, Forty Years of Foreign Trade (London, 1959), quoted in A. G. Kenwood and A. L. Lougheed, The Growth of the International Economy 1820–2000 (London, 1999), 80.
22.
The fact that production of shipping services involves movement in international waters – and, hence, vulnerability – can explain the massive destruction of production capacity (ships). However, during the two wars there was enormous production of new ships, particularly in the United States, alleviating the effect on total production capacity.
23.
C. Ernest Fayle, The War and the Shipping Industry (London, 1927), 330.
24.
Of the leading maritime nations, Norway (32 per cent) had particularly strong growth, but also Germany (almost seven per cent) and Italy (five per cent) increased their fleets; see Stig Tenold, ‘Crisis? What Crisis? – The Expansion of Norwegian Shipping in the Interwar Period’, in Lars U. Scholl and David M. Williams, eds., Crisis and Transition: Maritime Sectors in the North Sea Region, 1790–1940 (Bremen, 2008), 117–34. Other nations with growth were Denmark with less than 10 per cent, Greece with an impressive 28 per cent and Finland, which more than doubled its fleet (though from a very low volume). Tonnage information derives from Lloyd’s Register of Shipping, Statistical Tables 1972 (London, 1972), Table 17.
25.
Lloyd’s Register of Shipping, Statistical Tables 1972, Table 17.
26.
See for instance United Nations Conference on Trade and Development (UNCTAD), Maritime Transport 2007 (Geneva, 2007), 54–6.
27.
Based on the same data as before. In order to separate British-controlled areas, we have complemented data for Oceania (Australia and New Zealand) and North America (Canada), based on, respectively, B. R. Mitchell, International Historical Statistics: Africa, Asia & Oceania 1750–1993 (Basingstoke, 1998); and Lewis R. Fischer and Helge W. Nordvik, ‘Maritime Transport and the Integration of the North Atlantic Economy, 1850–1914’, in Wolfram Fischer, R. Marvin McInnis and Jürgen Schneider, eds., The Emergence of a World Economy, 1500–1914 (Wiesbaden, 1986), 519–44.
28.
Based on the situation where shipping services were non-tradable. Ideally, the measure should also include the transport distance, giving a number measured in ton-miles. See also David Alexander and Rosemary Ommer, eds., Volumes Not Values: Canadian Sailing Ships and World Trades. Proceedings of the Third Conference of the Atlantic Canada Shipping Project, April 19–April 21, 1979 (St. John’s, 1979).
29.
Martin Stopford, Maritime Economics (London, 2009).
30.
See, for example, Werner Scheltjens, Dutch Deltas: Emergence, Functions and Structure of the Low Countries’ Maritime Transport System, ca.1300–1850 (Leiden, 2015), 1–2.
31.
The Trans-Siberian Railway, though, has also offered a possibility of long distance transport between Asia and Europe, but it has not yet proved to be competitive enough with sea routes. The distance of transporting containers from Kobe, Japan to Helsinki, Finland, for example, was in the early 1970s 27,000 km by sea and 10,000 km by rail. See the work of Juha Sahi in Verkostot kaukaiseen itään. Suomen kauppasuhteet Japaniin 1919–1974 [Networking With the Distant East: Finland’s Trade Relations with Japan 1919–1974] (Oulu, 2016), 568–73; and ‘The Trans-Siberian Railway as a Corridor of Trade Between Finland and Japan in the Midst of World Crises’, Journal of Transport History, 36, No. 1 (2015), 58–76.
32.
See, for instance, Simon Ville, ‘The Problem of Tonnage Measurement in the English Shipping Industry’, International Journal of Maritime History, 1, No. 2 (1989), 65–83; or Yrjö Kaukiainen, ‘Tons and Tonnages: Ship Measurement and Shipping Statistics, ca.1870–1980’, International Journal of Maritime History, 7, No. 1 (1995), 29–56.
33.
Based on fleet data (GRT) from Lloyd’s and export data from World Development Indicators. The latter are based on 152 countries, and are likely to slightly over-represent developed countries.
34.
See the fascinating history behind the establishment of the Liberian registry in Rodney Carlisle, ‘The “American Century” Implemented: Stettinius and the Liberian Flag of Convenience’, Business History Review, 54, No. 2 (1980), 175–91.
35.
The term ‘Flags of Convenience’ is used to denote ship registries that are open to persons, companies or other legal entities that do not have a ‘genuine link’ to the country in question. For a concise overview, see for instance William R. Gregory, ‘Flags of Convenience: The Development of Open Registries in the Global Maritime Business and Implications for Modern Seafarers’ (Unpublished MA thesis, Georgetown University, 2012); or, for a more thorough discussion, Elizabeth R. DeSombre, Flagging Standards: Globalization and Environmental, Safety, and Labor Regulations at Sea (Cambridge, 2006); or Basil Metaxas, Flags of Convenience: A Study of Internalisation (Aldershot, 1985) which provides an out-dated analysis, but very good empirics on Flags of Convenience during the first post-war decades.
36.
OECD, Maritime Transport 1971 (Paris, 1972), 87.
37.
OECD, Maritime Transport 1971 (Paris, 1972), 87
38.
See the next section for an introduction to open registries.
39.
Based on fleet data (gross registered tonnage – GRT) from UNCTAD and export data from World Development Indicators. The latter are based on 194 countries, and likely to have less bias than data from previous years.
40.
The data are based on a combination of sources and measures. For the period up to and including 1969, the basis is gross register tonnage from Lloyd’s Register of Shipping, Statistical Tables 1972 (London, 1972), Table 17. Subsequently the data are based on deadweight tonnage data from Lloyd’s Register, as reprinted in OECD, Maritime Transport (Paris, various years) and UNCTAD, Maritime Transport (Geneva, various years). The UK data include the Channel Islands and the Isle of Man. Excluding these registers would reduce the British share of the world fleet by 42 to 72 per cent – equivalent to between 0.5 and 1.5 percentage points – in the period 1995–2014.
41.
Based on deadweight tonnage data from UNCTAD, 2001 and trade and export data from World Development Indicators. We recognise the substantial uncertainty and discretion involved in determining ‘real’ ownership; however, the table is based on the data as presented in the UNCTAD report, which is clearly the most reliable source of such information.
42.
While manufactures made up more than 50 per cent of the exports of the first generation tigers (Hong Kong, Singapore, South Korea and Taiwan) during their strong growth phase, the second generation (Indonesia, Malaysia and Thailand) had more balanced exports with a larger presence of commodities. World Bank, World Development Report 1995 (New York, 1995), 250–1.
43.
However, to be fully confident in that explanation we have to ignore the international trade in shipping services, which clearly is tantamount to denying the whole concept of this article.
44.
The latter figure is lower than the 32 per cent of the fleet presented in ![]() , because we have deducted the tonnage registered in Cyprus and Malta, two European FoCs that in 2000 amounted to around 10 per cent of the world fleet. They had fleets of more than 73 million tons, but the shares of this owned by nationals were 2.1 per cent and 0.1 per cent respectively.
, because we have deducted the tonnage registered in Cyprus and Malta, two European FoCs that in 2000 amounted to around 10 per cent of the world fleet. They had fleets of more than 73 million tons, but the shares of this owned by nationals were 2.1 per cent and 0.1 per cent respectively.
45.
Ideally, to give a good basis for comparison, we should have done this for the nineteenth century figures as well. Data issues make this impossible, but the share of seaborne transport in total trade was undoubtedly much higher then.
46.
47.
Calculated on the basis of Table A58: ‘World Merchandise Exports by Region and Selected Economy, 2005–2015’, in WTO, World Trade Statistical Review (Geneva, 2016).
48.
Average of the largest 13 European fleets (excluding Cyprus and Malta) in 2001.
49.
If we treat the EU as one trading unit, by omitting intra-EU trade, the shipping/trade ratio increases to 2.77, implying a far higher shipping/trade ratio than even the late nineteenth century.
50.
For Germany, the 2010 share of 8.9% includes both previous BRD (West German) and DDR (East German). A correct comparison for 1970 would therefore be 3.5% (BRD) plus 0.4% (DDR), but even this is less than half the German share in 2010.
51.
Based on information from UNCTAD, Maritime Transport 2010.
52.
Calculated on the basis of UNCTAD Maritime Transport 2015, 36. The basis for the negative Swedish development is explained in René Taudal Poulsen, Hans Sjögren and Thomas Lennerfors ‘The Two Declines of Swedish shipping’, in Stig Tenold, Martin Jes Iversen and Even Lange, eds., Global Shipping in Small Nations: Nordic Experiences after 1960 (Basingstoke, 2012), 100–28.
53.
See Daniel Todd, ‘Going East: Was the Shift in Volume Shipbuilding Capacity from Britain and Continental Europe to the Far East and Elsewhere During the Latter Half of the Twentieth Century Inevitable?’, Mariner’s Mirror, 97, No. 1 (2011), 259–71.
54.
Sevket Pamuk and Jeffrey. G. Williamson, ‘Globalization Challenge and Economic Response in the Mediterranean’, in Pamuk and Williamson, eds., The Mediterranean Response to Globalization Before 1950 (London, 2000), 7.
55.
See also Michael E. Porter, Competitive Advantage of Nations: Creating and Sustaining Superior Performance (New York, 1990), 249–66.