
Abstract
Introduction
Prior to the COVID-19 pandemic, the Conference Board of Canada estimated that average patient wait times in 2022 would be 67 days for CT and 133 days for MRI. 1 The purpose of this study was to evaluate CT and MRI trends in Canada from 2003 to 2019 relative to the number of radiologists, scanners, population, and other Organization for Economic Co-operation and Development (OECD) countries.
Methods
Research ethics board approval was not required as all data are publicly available. CT and MRI data were obtained from the OECD and the number of licensed diagnostic radiologists in Canada from the Canadian Medical Association (CMA).2,3 Central tendencies of count and rate data are presented as a median with range and were compared using Poisson regression. P < .05 was defined as statistically significant. Figures were generated using the ggplot2 package in R which was used for all analysis (R foundation for statistical computing, v 3.6.3, Vienna, Austria). 4
Results
Trends Within Canada
The total annual number of CT and MRI scans performed within Canada between 2003 and 2019 increased (96% and 203%, respectively, P < .001 each). The annual number of CT and MRI scans increased per radiologist (49% and 131%, P < .001 each) and per 1000 population (64% and 158%, P < .001 each).
Canada Compared to the OECD Average
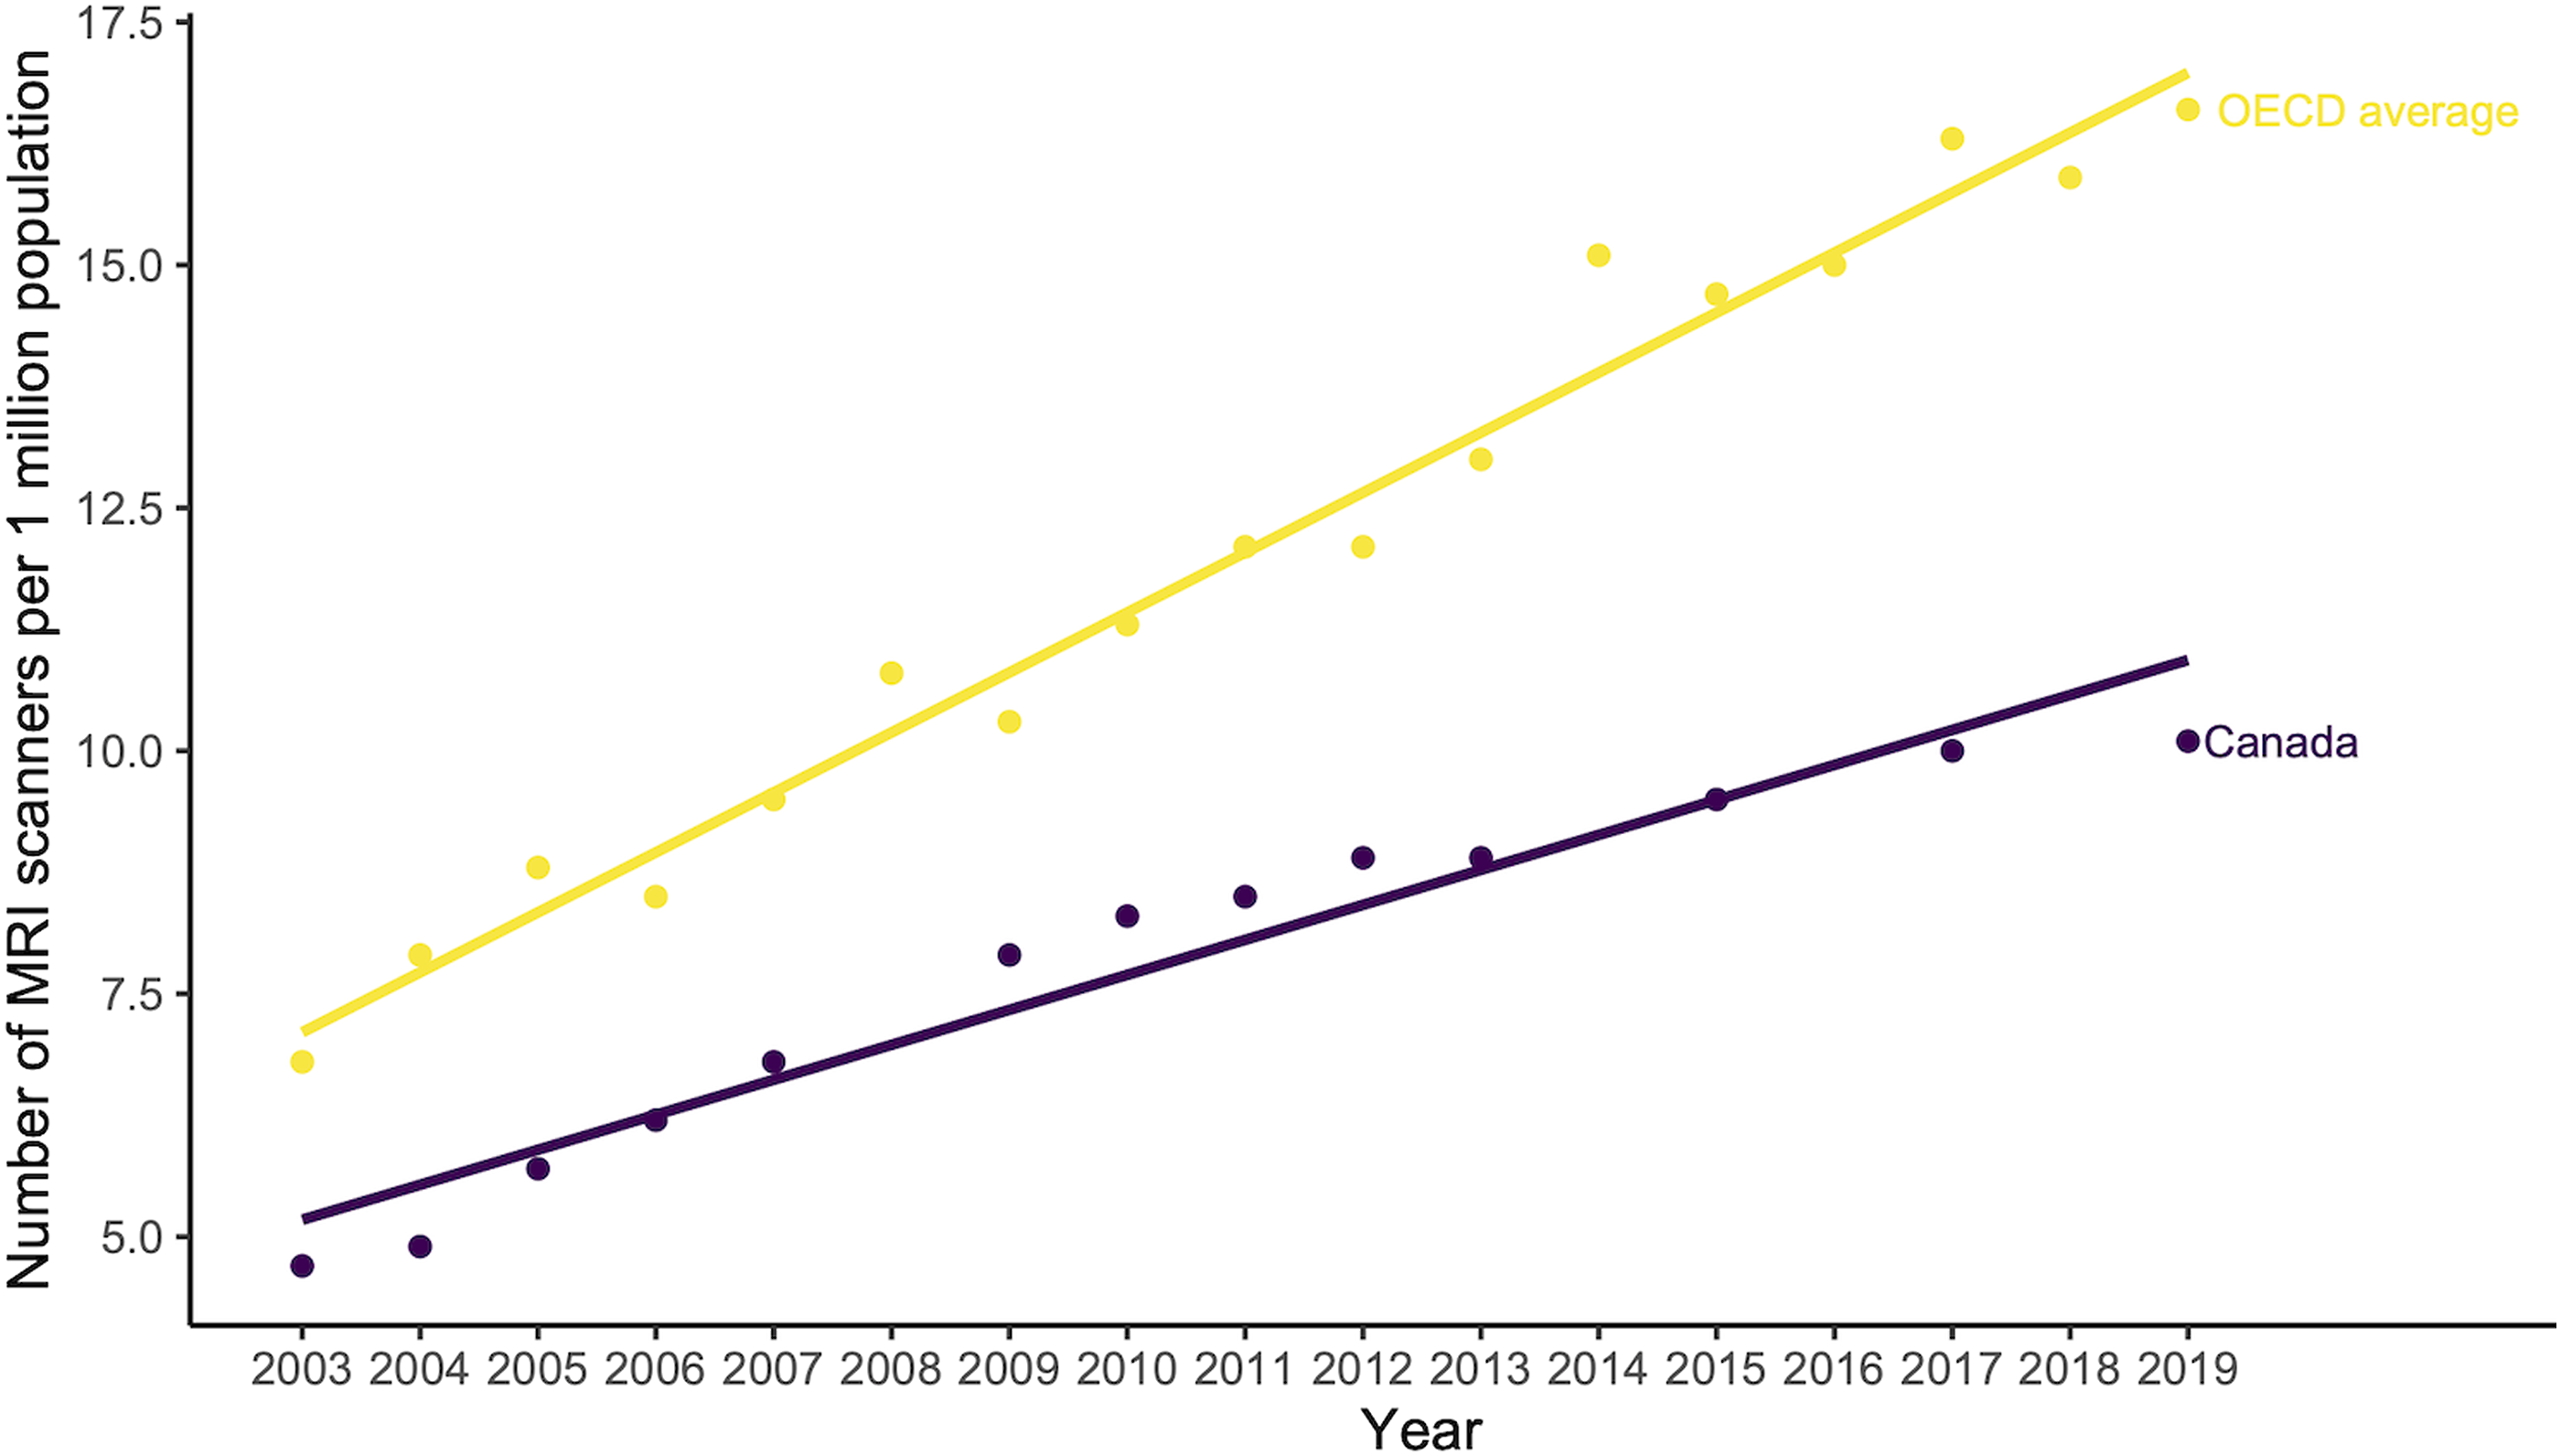
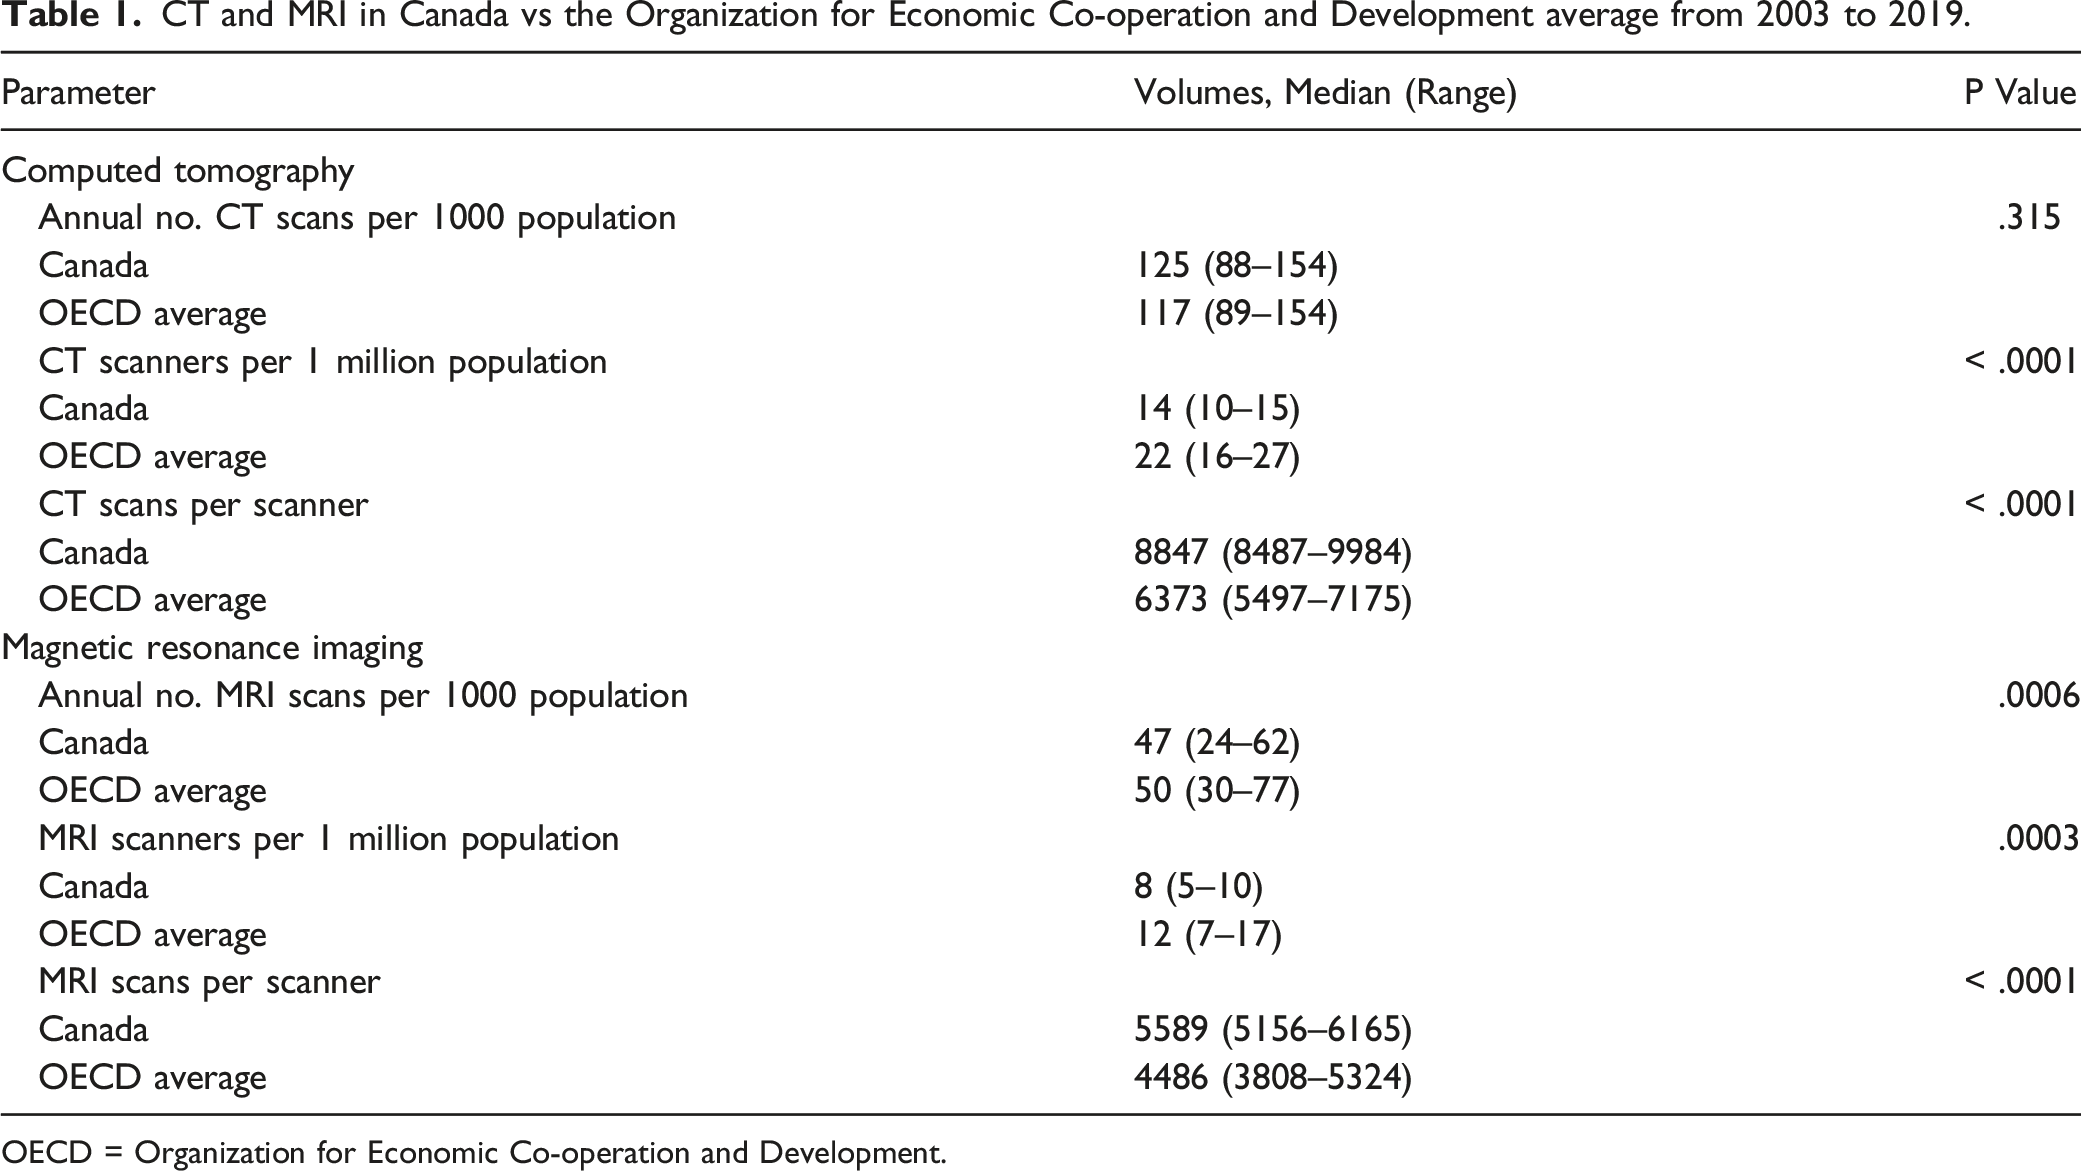
The annual number of CT scans per 1000 population in Canada did not differ from the OECD average from 2003 to 2019 (125 vs 117, P = .315). However, the annual number of MRI scans per 1000 population and the total number of CT and MRI scanners per one million population (Figures 1 and 2) were all substantially less than the OECD average (P < .001 each, Table 1). Canada did substantially more CT scans per scanner (median = 8847 vs 6373, P < .001) and MRI scans per scanner (median = 5589 vs 4486, P < .001) during the same timeframe. CT scanners per 1 million population for Canada and the Organization for Economic Co-operation and Development average from 2003 to 2019. Lines of best fit generated using a linear model. MRI scanners per 1 million population for Canada and the Organization for Economic Co-operation and Development average from 2003 to 2019. Lines of best fit generated using a linear model. CT and MRI in Canada vs the Organization for Economic Co-operation and Development average from 2003 to 2019. OECD = Organization for Economic Co-operation and Development.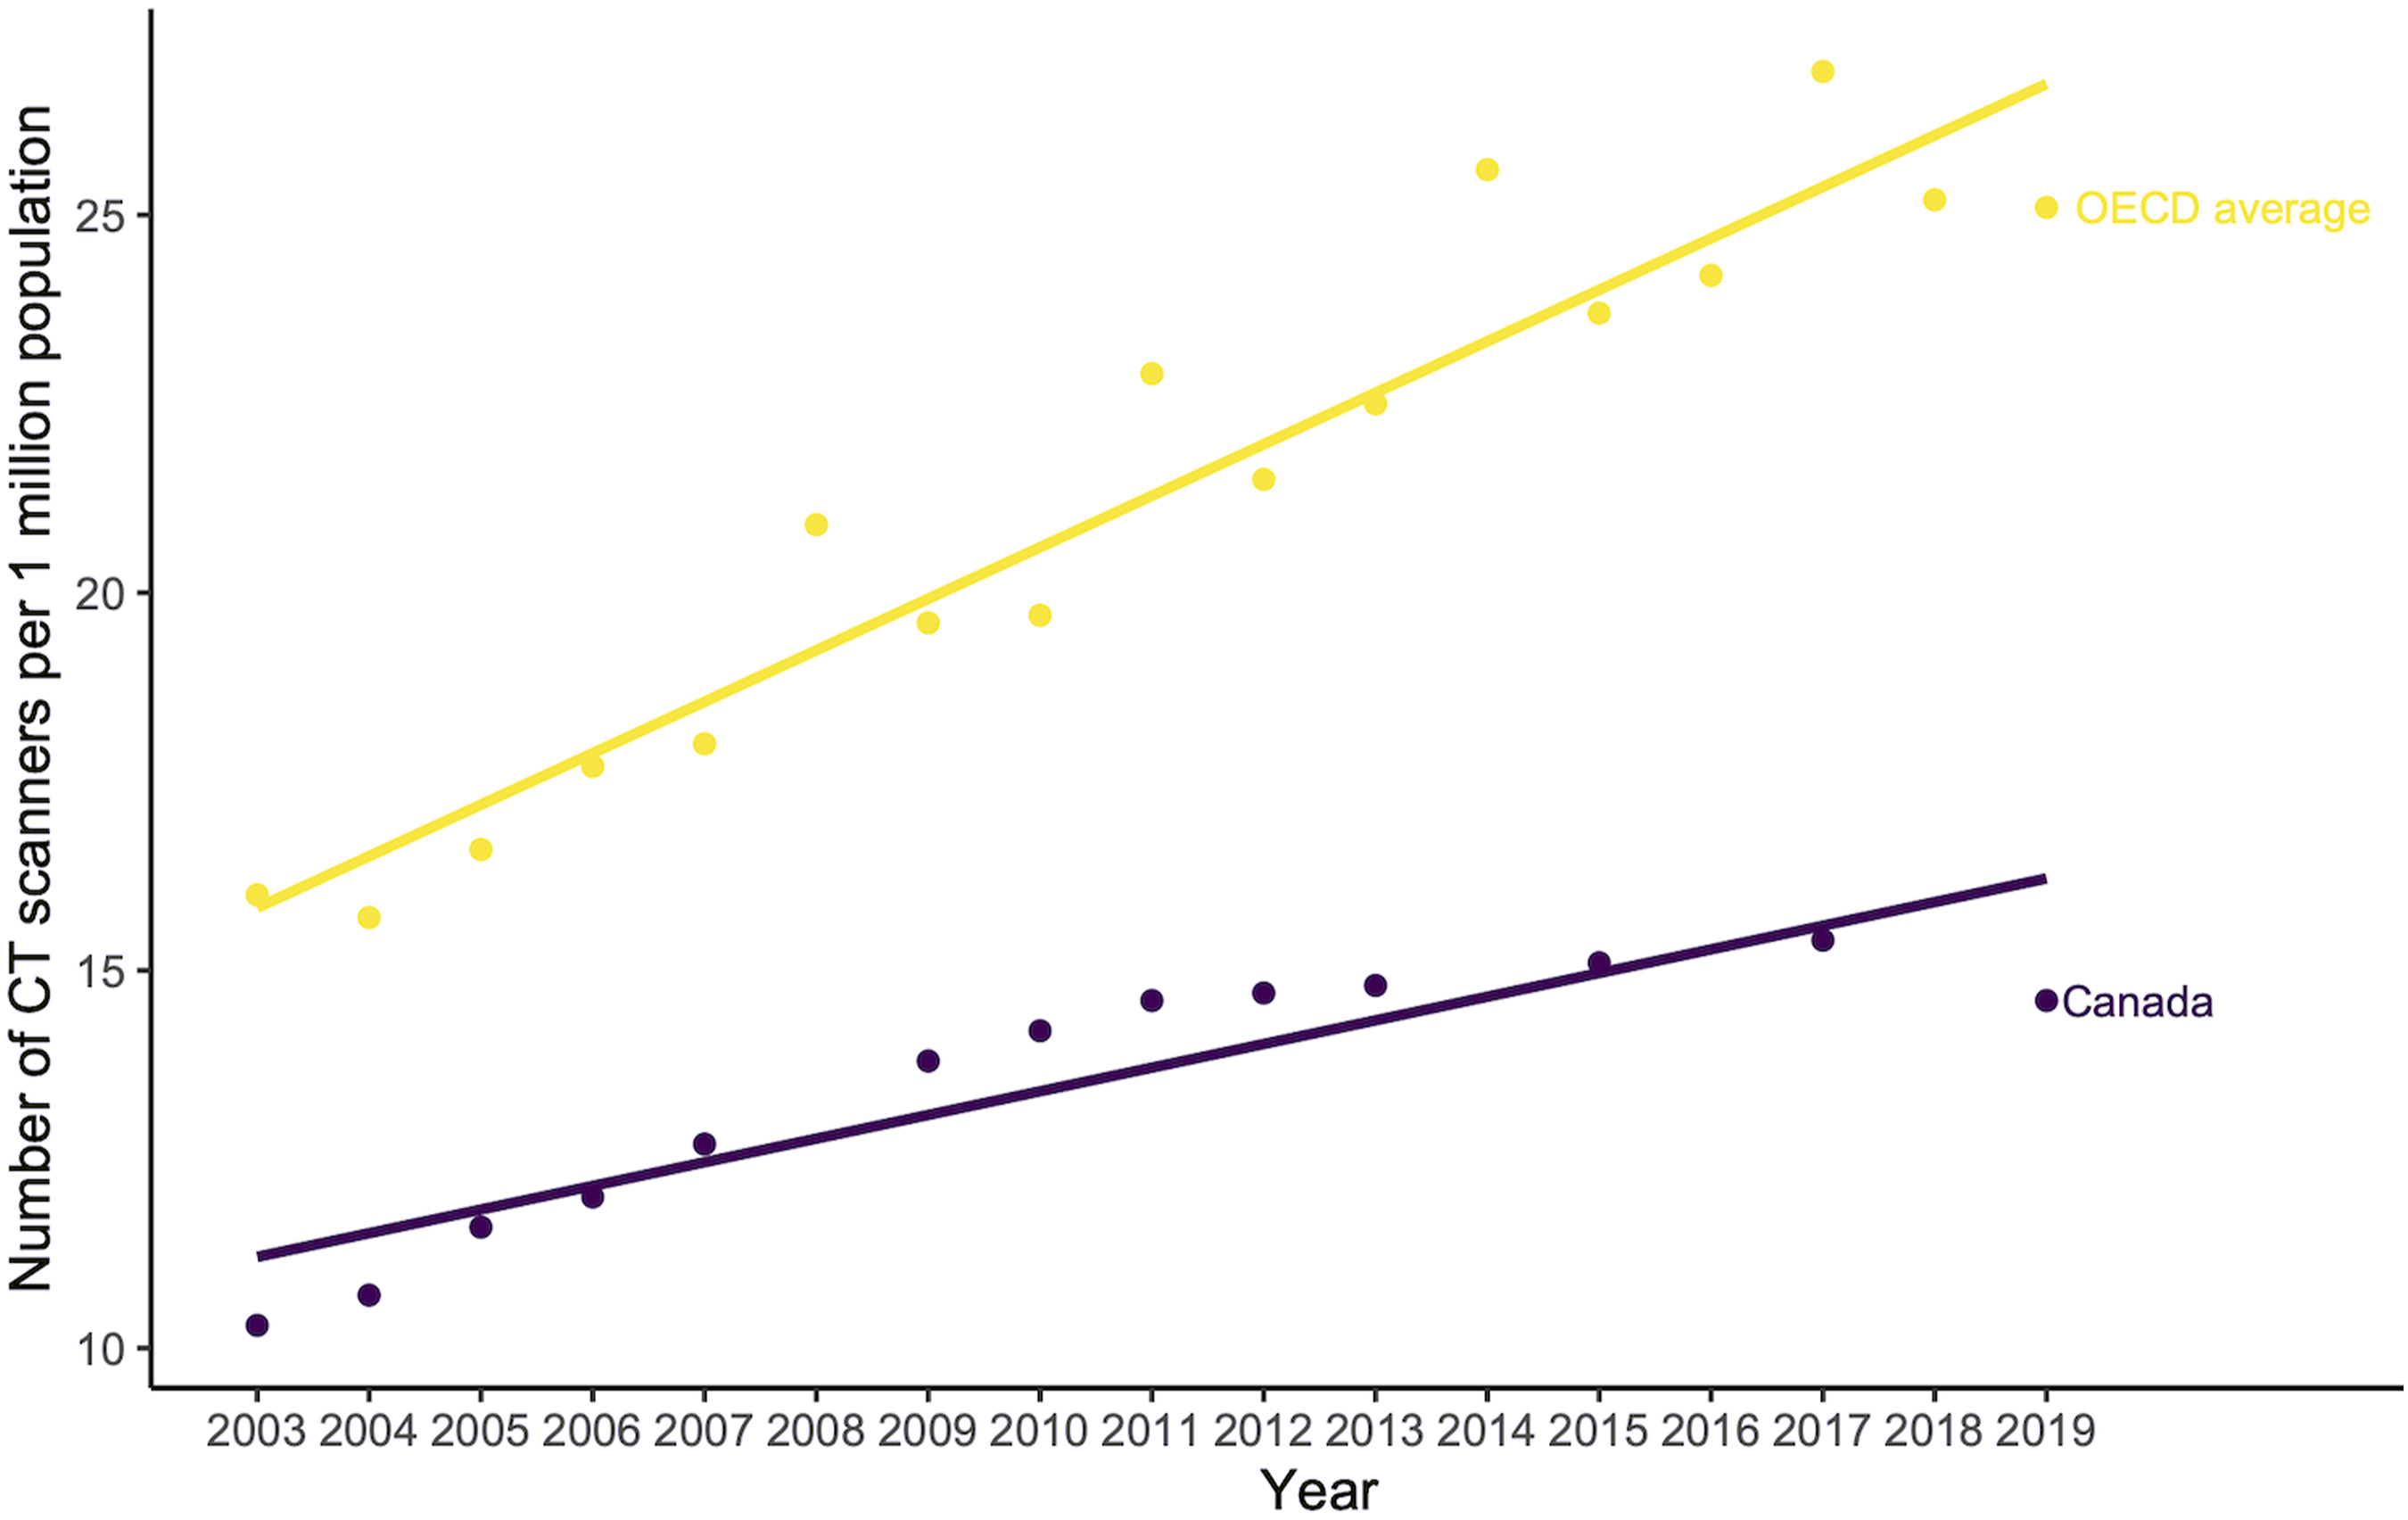
Discussion
From 2003 to 2019, Canada had fewer CT and MRI scanners per 1 million population compared to the OECD average and performed fewer MRI scans per 1000 population. Despite having fewer scanners, the number of CT scans between Canada and the OECD average did not differ due to Canada performing considerably more CT scans per scanner. However, MRI volumes lagged behind the OECD average despite performing approximately 25% more MRI scans per scanner than the OECD average.
A major challenge for diagnostic imaging in Canada is wait time management. This has been acutely exacerbated by the COVID-19 pandemic which has resulted in a massive imaging examination backlog. 5 It is difficult to foresee substantial increased throughput of patients using the current scanner supply given Canada already performs a high number of CT and MRI scans per scanner. Modern scanning systems leveraging hardware and software advancements could incrementally increase throughput, but more scanners would almost certainly be more impactful on reducing wait times. Increasing the number of scanners by at least 50% would more closely align Canada with the OECD average.
The demands on Canadian radiologists have increased from 2003 to 2019 as evidenced by increasing CT and MRI scans per radiologist. Along with increased scan volumes, modern CT and MRI scans consist of hundreds or thousands of images with more planes of imaging, phases, and sequences adding to overall complexity and time for interpretation. This is an often-overlooked reality, especially by nonmedical-imaging physicians: technological advancements in medical imaging have not clearly resulted in more efficient and less strenuous workflow but may have had the opposite effect. Many radiologists anecdotally describe their work environment as more arduous than in prior years. Along with political pressures to reduce remuneration in some jurisdictions, these may all contribute toward radiologist burnout. 6
Footnotes
Declaration of Conflicting Interests
The author(s) declared no potential conflicts of interest with respect to the research, authorship, and/or publication of this article.
Funding
The author(s) received no financial support for the research, authorship, and/or publication of this article.