
Abstract
Background:
The impact of climate-driven warming on future demand for medical imaging remains unclear.
Purpose:
To project temperature-attributable excess imaging volumes requested by emergency departments (ED) under future climate scenarios.
Methods:
Associations between ambient temperature and imaging utilization were estimated during the baseline period (2013-2022) using data from 5 EDs in Toronto. Baseline exposure–response relationships were applied to statistically downscaled, bias-corrected daily temperature projections through 2092 from an ensemble of 23 general circulation models. Temperature-attributable excess ED imaging volumes were projected by decade under 3 Shared Socioeconomic Pathways (SSPs).
Results:
Higher ambient temperature was associated with increased imaging utilization at baseline (incidence rate ratio 1.033; 95% CI, 1.028-1.037; P < .001). Temperature-attributable emergency medical imaging utilization is projected to increase under all climate scenarios. Relative increases ranged from 0.04% to 0.10% in the early period (2023-2032), with a 3- to 12-fold increase over the study period. By 2083 to 2092, temperature-attributable emergency imaging utilization is projected to increase by 0.32% (95% CI, 0.28-0.37) under the SSP1-2.6 low-emissions scenario and by 1.25% (95% CI, 1.08-1.43) under the SSP3-7.0 high-emissions scenario. This corresponds to annual excess imaging studies attributable to rising temperatures of 570 (95% CI, 488-655) to 2219 (95% CI, 1922-2528) locally, and 13 900 (95% CI, 11 900-15 950) to 55 475 (95% CI, 48 050-63 200) across Canada.
Conclusion:
Climate-driven warming is projected to increase emergency imaging utilization across all emissions scenarios. These findings support the need for climate-informed radiology planning and integration of adaptation and mitigation strategies to sustain health system capacity.
Introduction
Climate change is a global health crisis with impacts that transcend geographic and socioeconomic boundaries. Average global temperatures are projected to rise by 1.4°C to 4.4°C by the end of the century relative to pre-industrial levels, accompanied by more frequent and severe extreme heat events.1,2 Short-term increases in ambient temperature are associated with higher health care utilization, including increases in emergency department (ED) visits and hospital admissions.3,4 Heat exposure results in morbidity across multiple organ systems, often requiring urgent diagnostic testing, including medical imaging. 5
Radiology plays a central role in acute care pathways and in detecting the multi-organ health effects of climate-related exposures.6,7 For example, higher exposure to air pollution is associated with greater carotid intima-media thickness on ultrasound, higher coronary artery calcium on cardiac CT, and greater extent of myocardial fibrosis on cardiac MRI.7-10 As climate-driven hazards increase, imaging volumes are expected to rise in parallel, positioning the volume of imaging requested in the ED as a pragmatic indicator of broader health system strain.11,12 Emergency imaging represents a particularly informative metric of climate-sensitive healthcare demand, as it is high-volume, resource-intensive, and directly linked to acute clinical decision-making, reflecting both patient burden and system capacity requirements.
At the same time, the delivery of imaging services generates substantial greenhouse gas emissions.13-17 In one Canadian academic imaging department, diagnostic imaging generated an estimated 3235 metric tons of carbon dioxide emissions per year, equivalent to 770 gasoline cars driven for a year. 18 Radiology, therefore, sits at the intersection of climate change and health systems, with a dual imperative to reduce greenhouse gas emissions while maintaining capacity to meet rising, climate-sensitive demand.19-22 Understanding how climate change will affect future demand for imaging is essential to balancing these priorities.
Despite growing recognition of radiology’s role in climate mitigation, the implications of climate change on future imaging demand remain underexplored.23,24 Prior work has demonstrated that short-term exposures to ambient heat are associated with increased ED imaging volumes, providing a mechanistic and empirical foundation for anticipating future climate-related increases in demand as temperatures rise. 25 However, long-term, scenario-based projections of heat-related ED imaging volumes have not been developed, limiting the ability of radiology departments to anticipate and plan for climate-driven changes.19,26 Without such projections, efforts to adapt imaging services to a warming climate risk being reactive rather than strategic.
We therefore aimed to project future excess ED imaging volumes attributable to rising ambient temperatures under various climate warming scenarios.
Methods
Study Design and Baseline Associations
This retrospective modeling study used aggregated, de-identified data and did not involve human participants or patient-level data. Institutional research ethics board approval was not required. Daily imaging utilization counts from EDs of 5 hospitals in downtown Toronto, Canada (Toronto General Hospital, Toronto Western Hospital, Mount Sinai Hospital, St Michael’s Hospital, and the Hospital for Sick Children) were linked to local daily environmental data over a 10-year period between January 2013 and December 2022. 25 This analysis builds on prior studies quantifying excess medical imaging related to climate-sensitive environmental exposures and the associated greenhouse gas emissions generated due to excess imaging.15,25
Daily ED imaging utilization counts were linked to local ambient environmental exposures using publicly available direct-measurement data, including 24-hour mean and maximum daily ambient temperatures (°C). 27 A time-stratified case-crossover design was used to estimate associations between short-term variations in ambient temperature and ED imaging utilization. 28 This design controls for time-invariant individual and system-level confounders. 29
Associations between ambient temperature and ED imaging volume were estimated using conditional Poisson regression and expressed as incidence rate ratios (IRR) per 10°C increase in ambient temperature. To capture lagged effects, heat exposure was modeled using the 5-day moving average of mean daily temperature, consistent with prior studies demonstrating delayed health impacts of heat exposure. The temperature–imaging association was assumed to follow a log-linear relationship when applied to future temperature distributions, scaled per 10°C of warming. Exposure–response estimates were derived for total ED imaging volume and stratified by imaging modality (radiographs, CT, and ultrasound). 25
Future Temperature Projections
Bias-corrected, statistically downscaled daily mean and maximum temperature projections for 2012 to 2100 were obtained from the Government of Canada, centered on the geographic location of the included hospitals. Climate projections followed 3 Shared Socioeconomic Pathways (SSPs), which are standardized scenarios that integrate future socioeconomic trends to model climate outcomes.30,31 Three SSPs were considered for this study:
SSP1-2.6: This climate scenario represents the low-emissions pathways that reflect a global shift toward more equitable, environmentally aware policies.
SSP2-4.5: This climate scenario characterizes an intermediate future emissions pathway, with trends following historical patterns. In this scenario, uneven socioeconomic development continues with minimal to moderate regard for climate initiatives.
SSP3-7.0: This climate scenario reflects a high-emissions future shaped by regionalized development, fossil-fuel dependence, trade barriers, and limited international cooperation to meet climate change goals.
Temperature simulations were derived from 23 general circulation models (GCMs) participating in the Coupled Model Intercomparison Project (CMIP6; Supplemental Table). 32 GCMs are models that simulate the response of Earth’s atmosphere, oceans, and land surface, enabling simulations of future climate conditions. Each SSP scenario was run individually through all 23 GCMs. GCM outputs were aggregated to generate ensemble estimates that capture uncertainty in future climate conditions. The use of multiple GCMs is recommended to reduce the influence of any single model, thereby providing a reliable estimate of future temperatures. 33
Projecting Heat-Related Excess Medical Imaging
The impact of future temperature increases on medical imaging utilization under SSP1-2.6, SSP2-4.5, and SSP3-7.0 pathways was estimated by applying baseline exposure–response relationships to projected temperature changes relative to the historical baseline (2013-2022). Decadal averages were grouped into 10-year periods from 2023-2032 to 2083-2092. Future temperature series were aligned with observed meteorological data from the baseline period using the Inter-Sectoral Impact Model Intercomparison Project bias adjustment and statistical downscaling. 34
Bias-corrected simulations were used to quantify excess medical imaging attributable to temperature increases as:
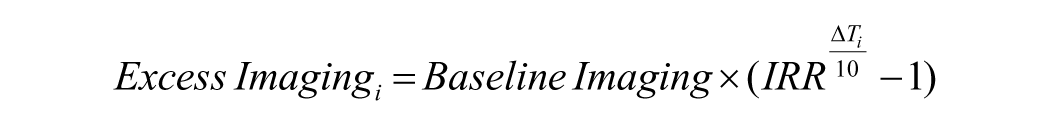
where:
This analysis estimates the counterfactual excess imaging attributable to climate-related temperature increases by applying baseline exposure–response relationships to projected temperature changes relative to historical conditions. Projected excess imaging represents the incremental change in utilization attributable to temperature increases, estimated by applying baseline exposure–response relationships to projected changes in ambient temperature. Baseline imaging utilization was defined as the observed mean daily imaging volume during the historical reference period (2013-2022). All projected increases are expressed relative to this baseline and reflect temperature-attributable excess imaging rather than total future imaging demand. As such, these estimates isolate the independent contribution of climate-driven warming and do not incorporate secular trends in imaging utilization due to population growth, aging, or changes in clinical practice.
Statistical Analysis
Data analysis was conducted using R (version 4.4.3). Relative and absolute excess imaging utilization projections were estimated per year, both overall and stratified by imaging modality. National projections were derived by scaling estimates from the 5 included hospitals, which collectively serve approximately 4% of the Canadian population. 15 This approach assumes broadly similar exposure–response relationships across regions and does not account for geographic variation in climate, population distribution, or healthcare utilization. Uncertainty was quantified using 1000 Monte Carlo simulations, sampling from normally distributed IRRs and baseline imaging volumes to generate 95% confidence intervals (2.5th-97.5th percentiles). 35 Sensitivity analyses evaluated alternative exposure windows (2- and 7-day moving averages of mean daily temperature) and an extreme-heat framework, defined as days with a maximum temperature exceeding 25°C. Excess imaging attributable to extreme heat was estimated by multiplying projected counts of extreme heat days under each SSP by excess absolute risk, defined as α × (IRR − 1)/IRR, where α represents the rate of baseline daily imaging utilization. Key assumptions of the modeling framework include stable baseline medical imaging utilization, constant exposure–response relationships over time, and the absence of additional adaptation or mitigation within healthcare systems (eg, infrastructure, technology, or clinical practice). These assumptions are conservative and likely result in an underestimation of future absolute imaging demand. Historical trends indicate that emergency medical imaging volumes have increased by more than 1% per year.5,25 Incorporating these trends by including a growth term for baseline imaging utilization would increase the absolute projected imaging volumes but would not change the relative effect estimates under various climate scenarios.
Results
Baseline Imaging Utilization and Temperature
During the baseline period (2013-2022), a total of 1 946 465 ED medical imaging studies were performed, with mean daily volume of 485 ± 61 imaging studies/day. By modality, mean daily imaging volumes were 280 ± 39 for radiographs, 134 ± 31 for CT, and 59 ± 15 for ultrasound. The mean daily ambient temperature was 9.1°C ± 9.8°C (range, −21.7°C to 29.6°C) with mean 76.5 ± 13.7 extreme heat days per year (range, 57-99).
A rise of 10°C in the 5-day moving average of mean daily ambient temperature was associated with a 3.3% increase in overall imaging utilization (excess relative risk; IRR, 1.033; 95% CI, 1.028-1.037). By modality, excess relative risk was 4.7% for radiographs (IRR, 1.047; 95% CI, 1.041-1.054), 2.5% for CT (IRR, 1.025; 95% CI, 1.016-1.034), and 1.8% for ultrasound (IRR, 1.018; 95% CI, 1.005-1.031; Table 1). Extreme heat days were associated with 2.1% increase in emergency imaging utilization (IRR, 1.021; 95% CI, 1.015-1.026), corresponding to an excess absolute risk of 6.0 imaging studies per 1 million people at risk per day.
Baseline Data for Emergency Department Medical Imaging Utilization and Incidence Rate Ratios (IRR) With Respect to Heat Exposure.
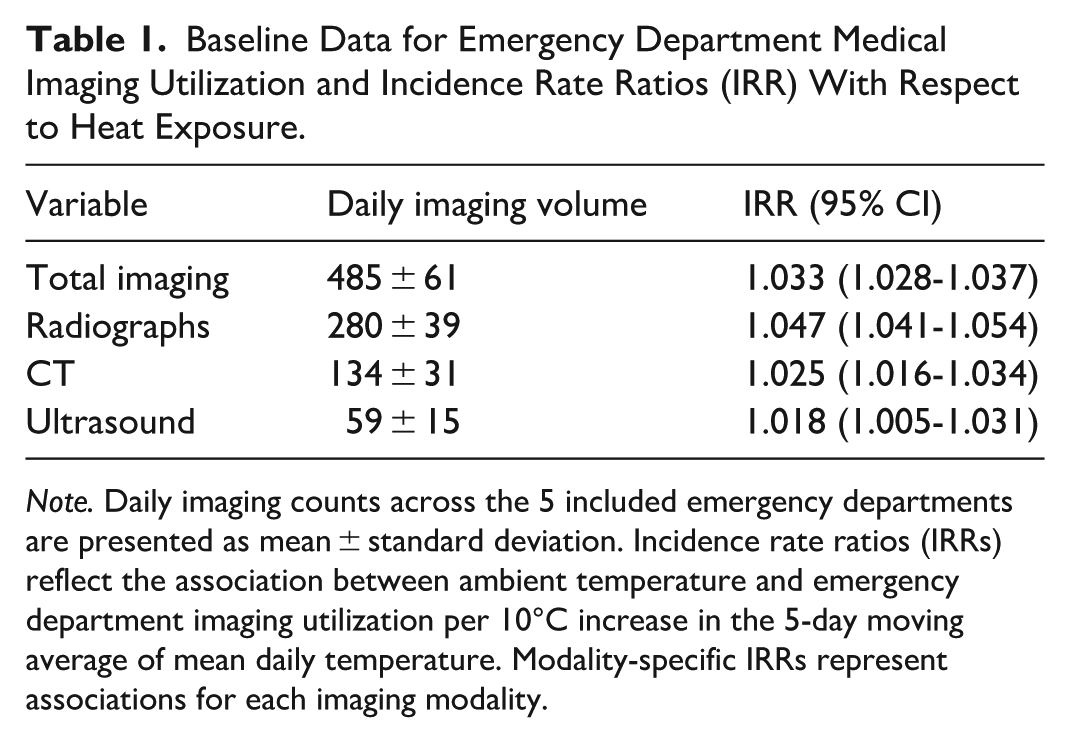
Note. Daily imaging counts across the 5 included emergency departments are presented as mean ± standard deviation. Incidence rate ratios (IRRs) reflect the association between ambient temperature and emergency department imaging utilization per 10°C increase in the 5-day moving average of mean daily temperature. Modality-specific IRRs represent associations for each imaging modality.
Projected Future Temperatures
Ambient temperatures are projected to increase across all emission scenarios (Figure 1). Individual GCMs consistently project rising temperatures across all scenarios, with the greatest increases observed under the SSP3-7.0 pathway (Figure 2). By 2083 to 2092, the mean warming relative to the baseline is projected to reach 1.0°C under SSP1-2.6, 2.3°C under SSP2-4.5, and 3.8°C under SSP3-7.0. Under SSP1-2.6, warming stabilizes toward the end of the century, whereas under SSP2-4.5 and SSP3-7.0, temperatures continue to rise through the final decade, with increasing divergence between scenarios over time.
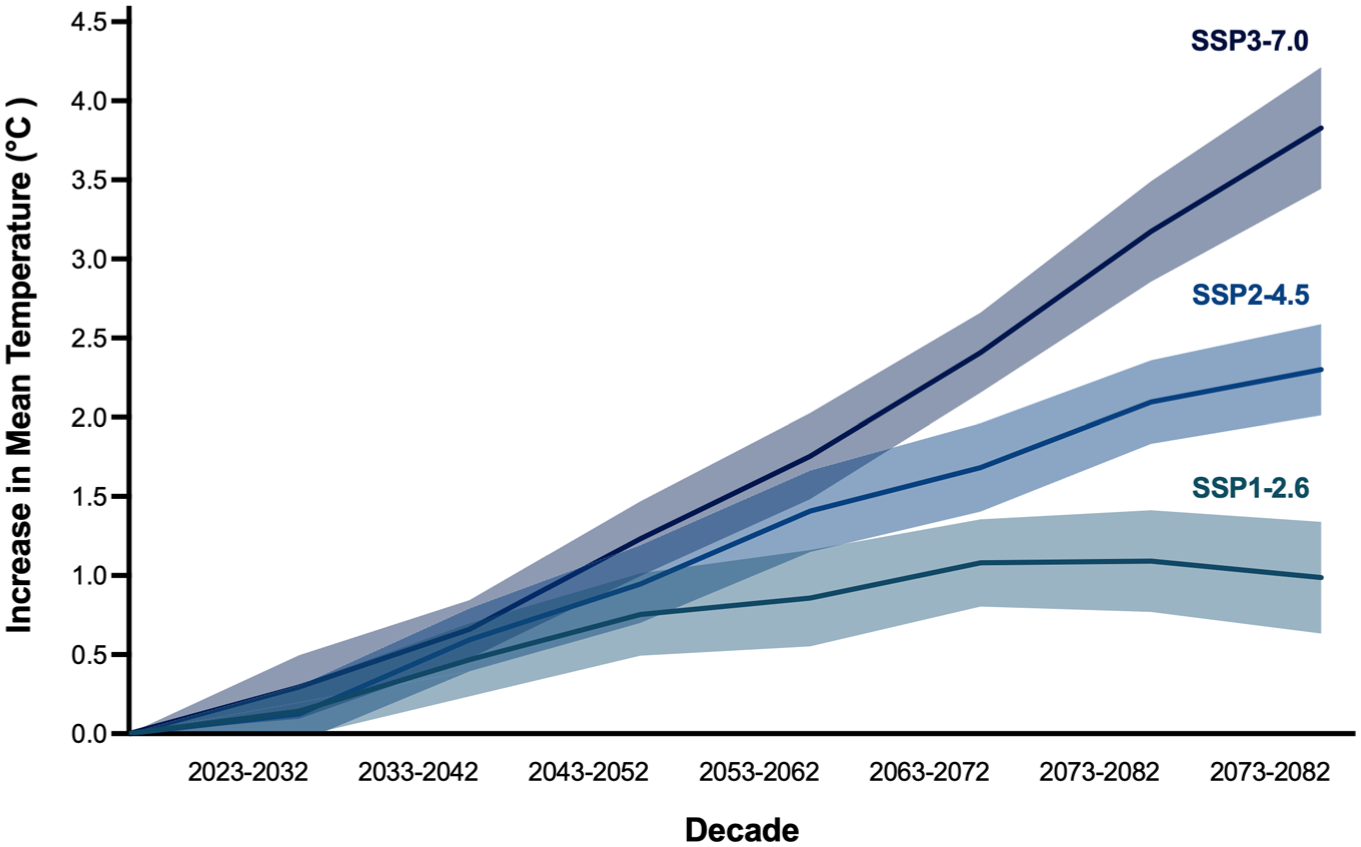
Projected increase in mean temperature relative to baseline across climate scenarios. Mean temperature changes relative to the baseline period (2013-2022) averaged across all general circulation models (GCMs) under each Shared Socioeconomic Pathway (SSP). Temperature increases across all scenarios over time until the end of the century, with the largest increases under SSP3-7.0. Under SSP1-2.6, temperatures stabilize in the later decades of the century.
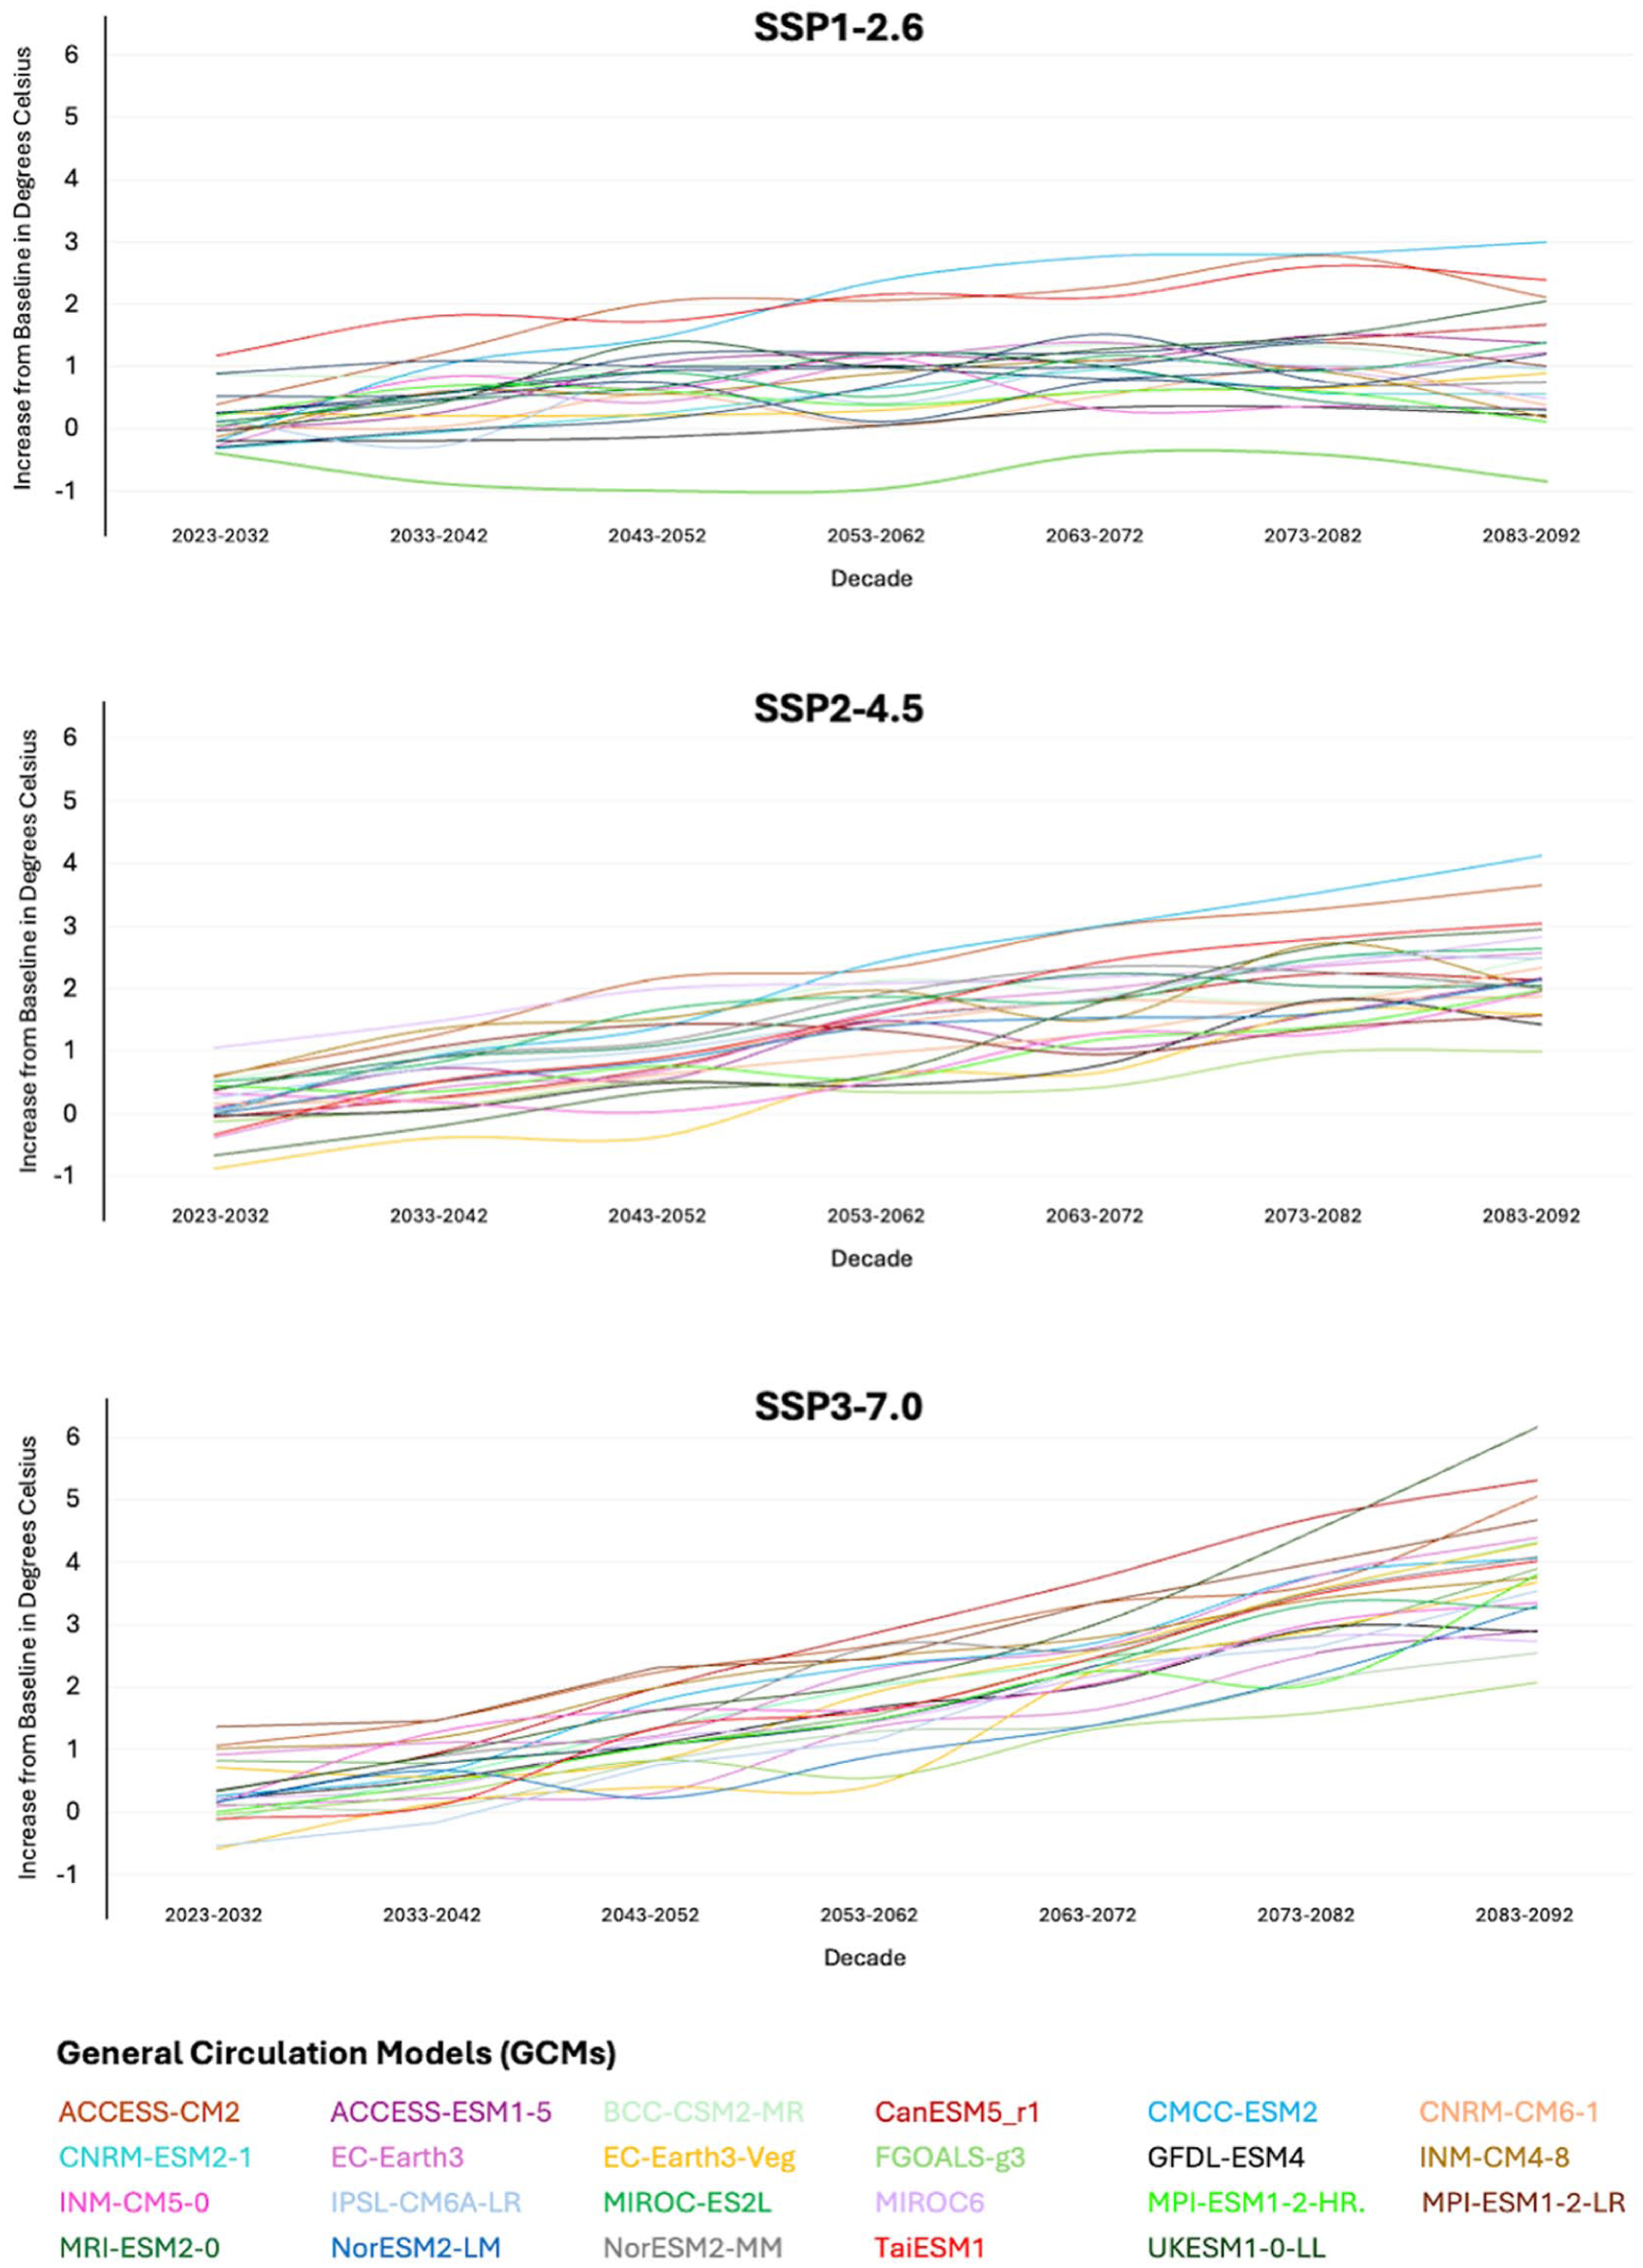
Projected increase in mean temperature across individual general circulation models. Mean temperature changes relative to the baseline period (2013-2022) for each of 23 general circulation models (GCMs) under SSP1-2.6, SSP2-4.5, and SSP3-7.0 climate pathways. All models project increasing temperatures over time, with the largest increases under SSP3-7.0 and the smallest under SSP1-2.6. Variability across models reflects differences in projected climate trajectories.
The number of extreme heat days is also projected to increase under all pathways (Table 2). Under SSP1-2.6, projected extreme heat days increase modestly from 92.6 to 101.2 days per year between 2023-2032 and 2083-2092. In contrast, under SSP3-7.0, extreme heat days increase substantially from 91.5 to 127.3 per year between 2023-2032 and 2083-2092, reflecting a marked intensification of extreme-temperature exposure.
Number of Extreme Heat Days in Each Shared Socioeconomic Pathway (SSP) Across Various General Circulation Models (GCMs).
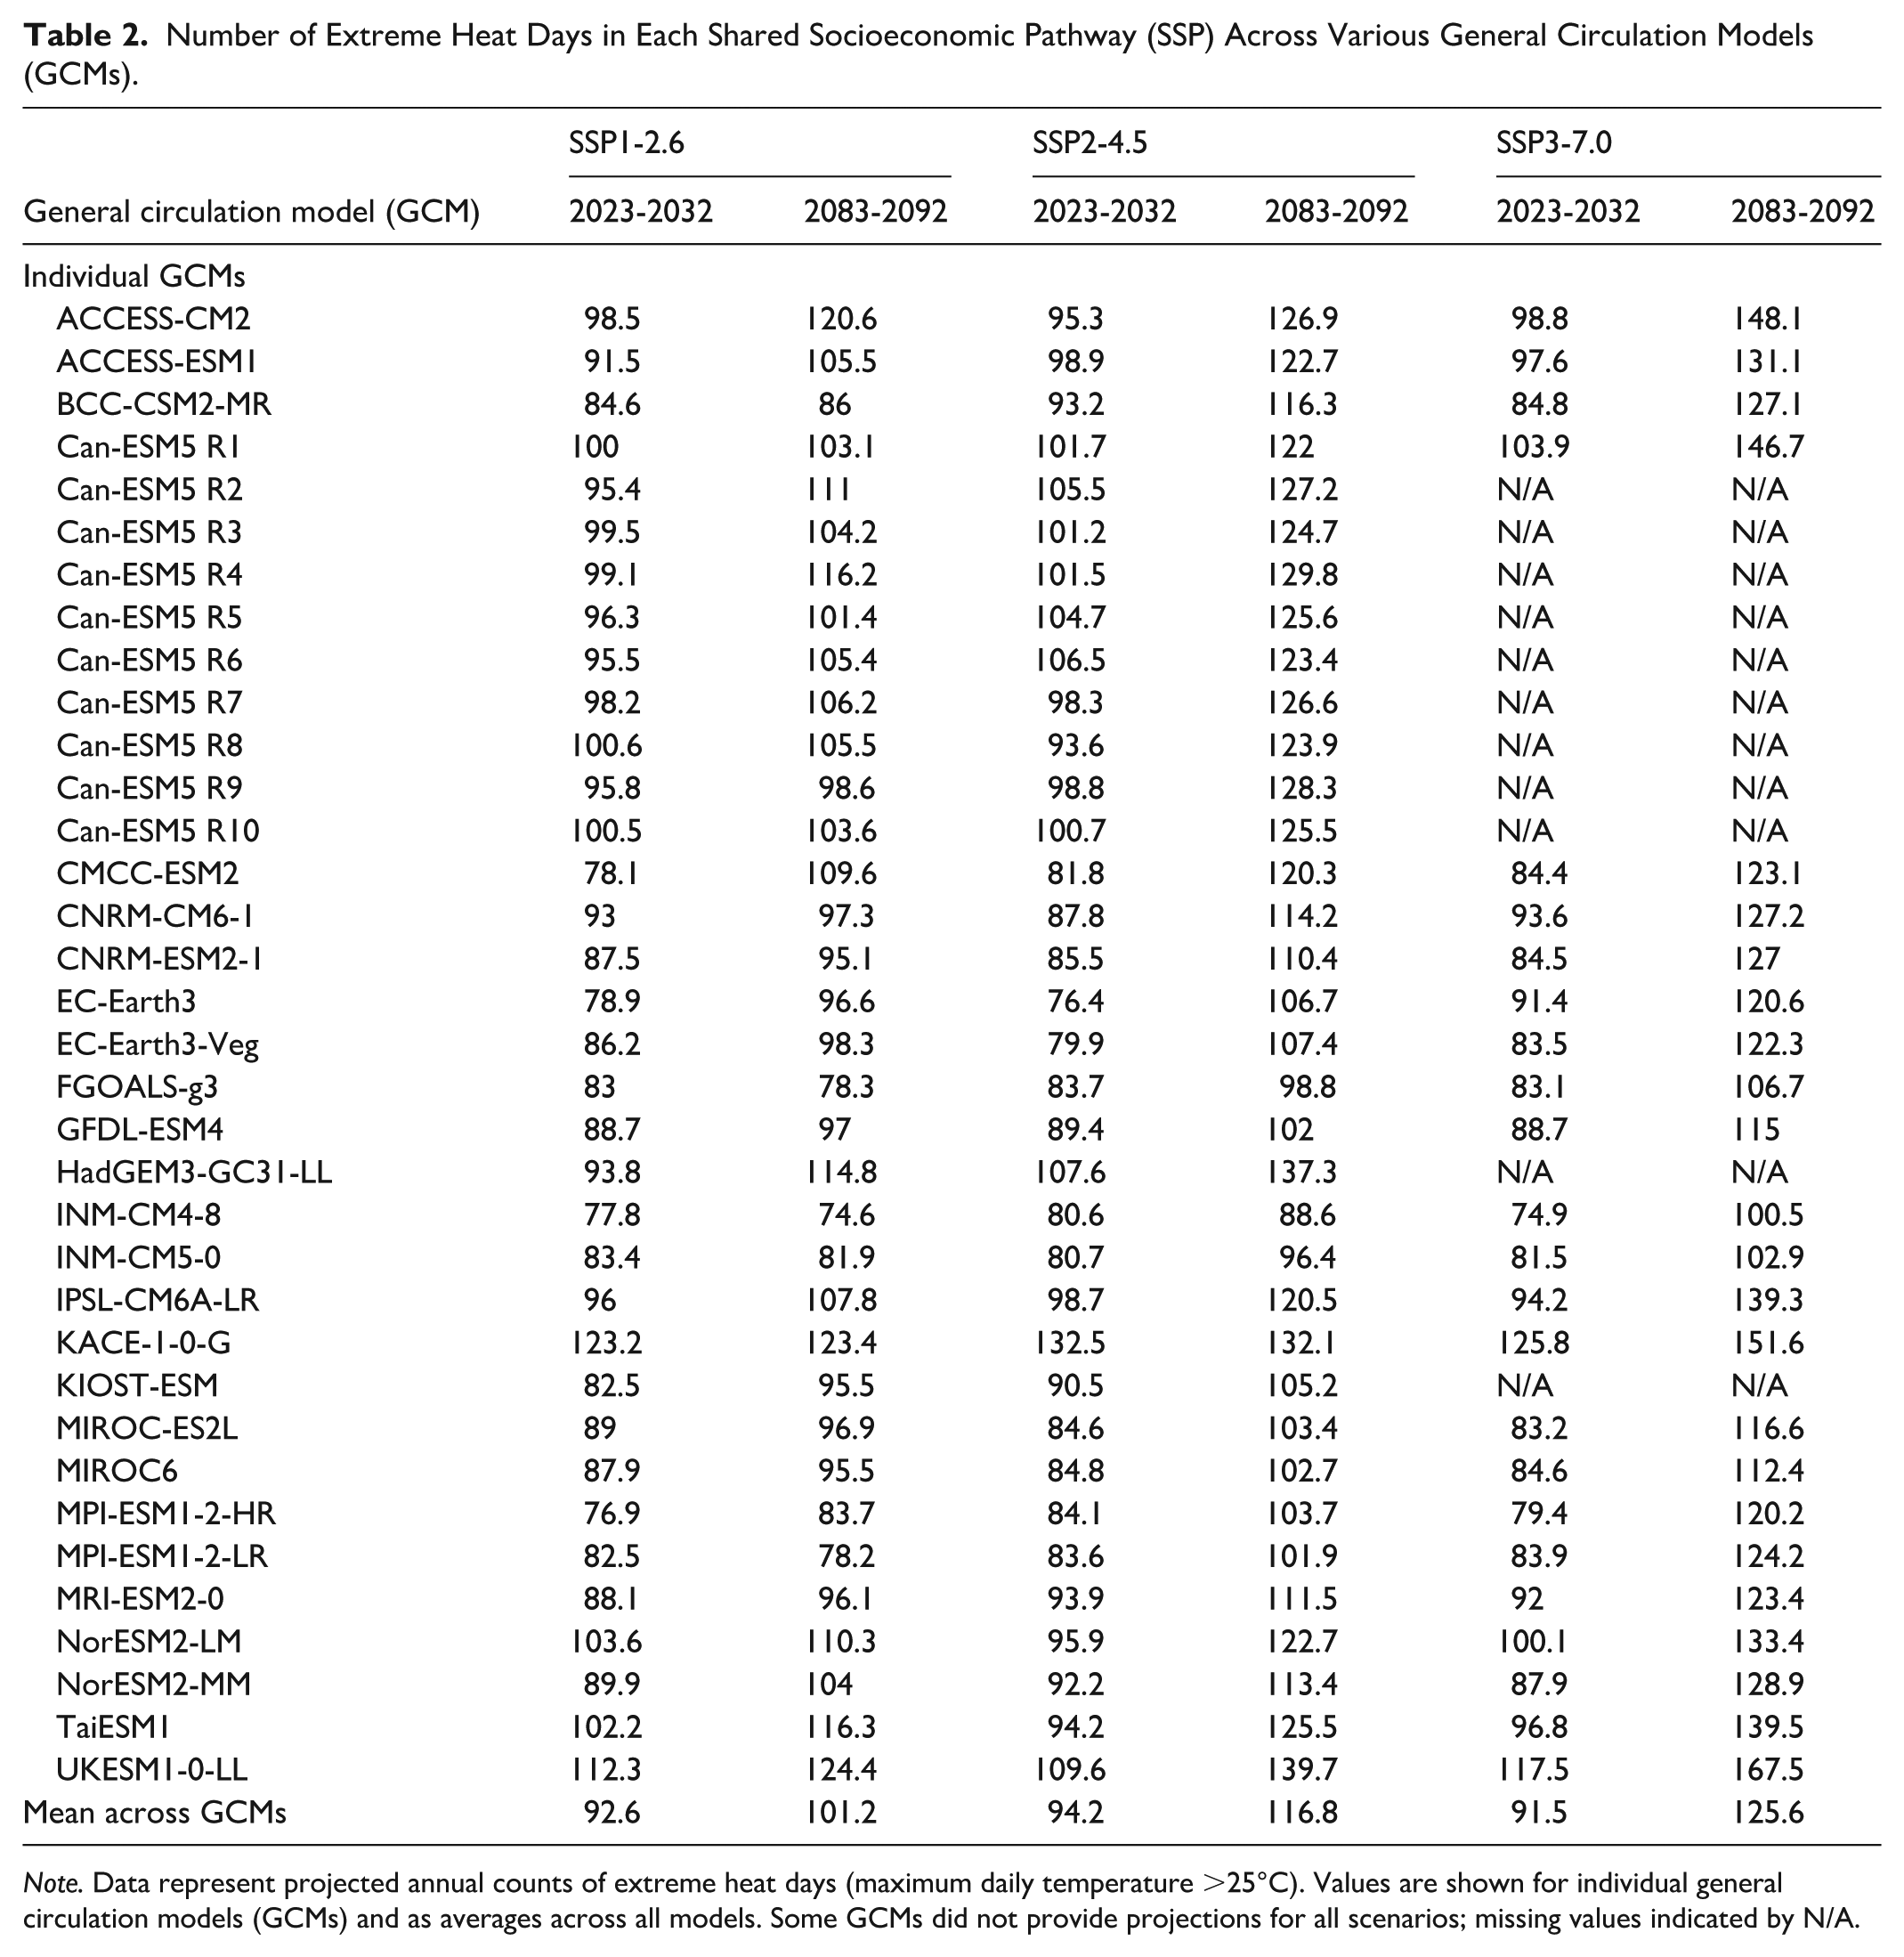
Note. Data represent projected annual counts of extreme heat days (maximum daily temperature >25°C). Values are shown for individual general circulation models (GCMs) and as averages across all models. Some GCMs did not provide projections for all scenarios; missing values indicated by N/A.
Projected Future Excess Imaging Utilization
Temperature-attributable emergency medical imaging utilization is projected to increase under all climate scenarios, with the magnitude and rate of increase varying by emissions pathway and time horizon (Figure 3).
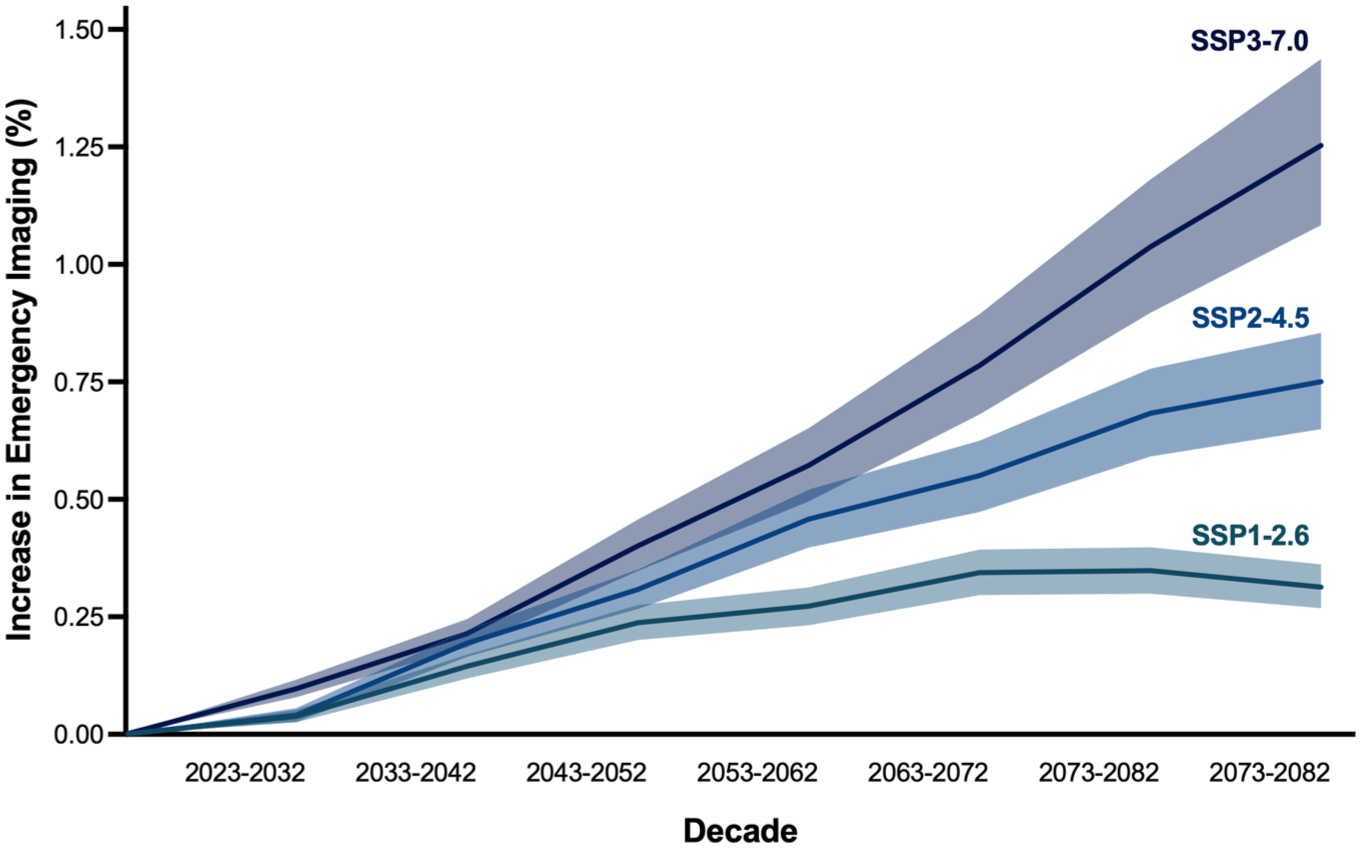
Projected temperature-attributable increase in overall imaging utilization across climate scenarios. Percent increase in overall emergency medical imaging utilization relative to baseline, with shaded areas representing 95% confidence intervals. Increases are greatest under the SSP3-7.0 scenario and rise over time across all pathways.
In the early period (2023-2032), relative increases in imaging utilization are modest, ranging from 0.04% to 0.10% across scenarios (0.05% [95% CI, 0.03-0.06] in the SSP1-2.6 pathway, 0.04% [95% CI, 0.03-0.06] in the SSP2-4.5 pathway, and 0.10% [95% CI, 0.08-0.12] in the SSP3-7.0 pathway). By 2083 to 2092, these increases rise to 0.32% (95% CI, 0.28-0.37) under SSP1-2.6, 0.75% (95% CI, 0.65-0.85) under SSP2-4.5, and 1.25% (95% CI, 1.08-1.43) under SSP3-7.0 (Table 3). This represents a 3- to 12-fold increase in temperature-attributable imaging utilization over the study period, with the greatest relative growth observed under higher-emissions scenarios.
Relative and Absolute Temperature-Attributable Excess Imaging Utilization Based on the Primary Model.
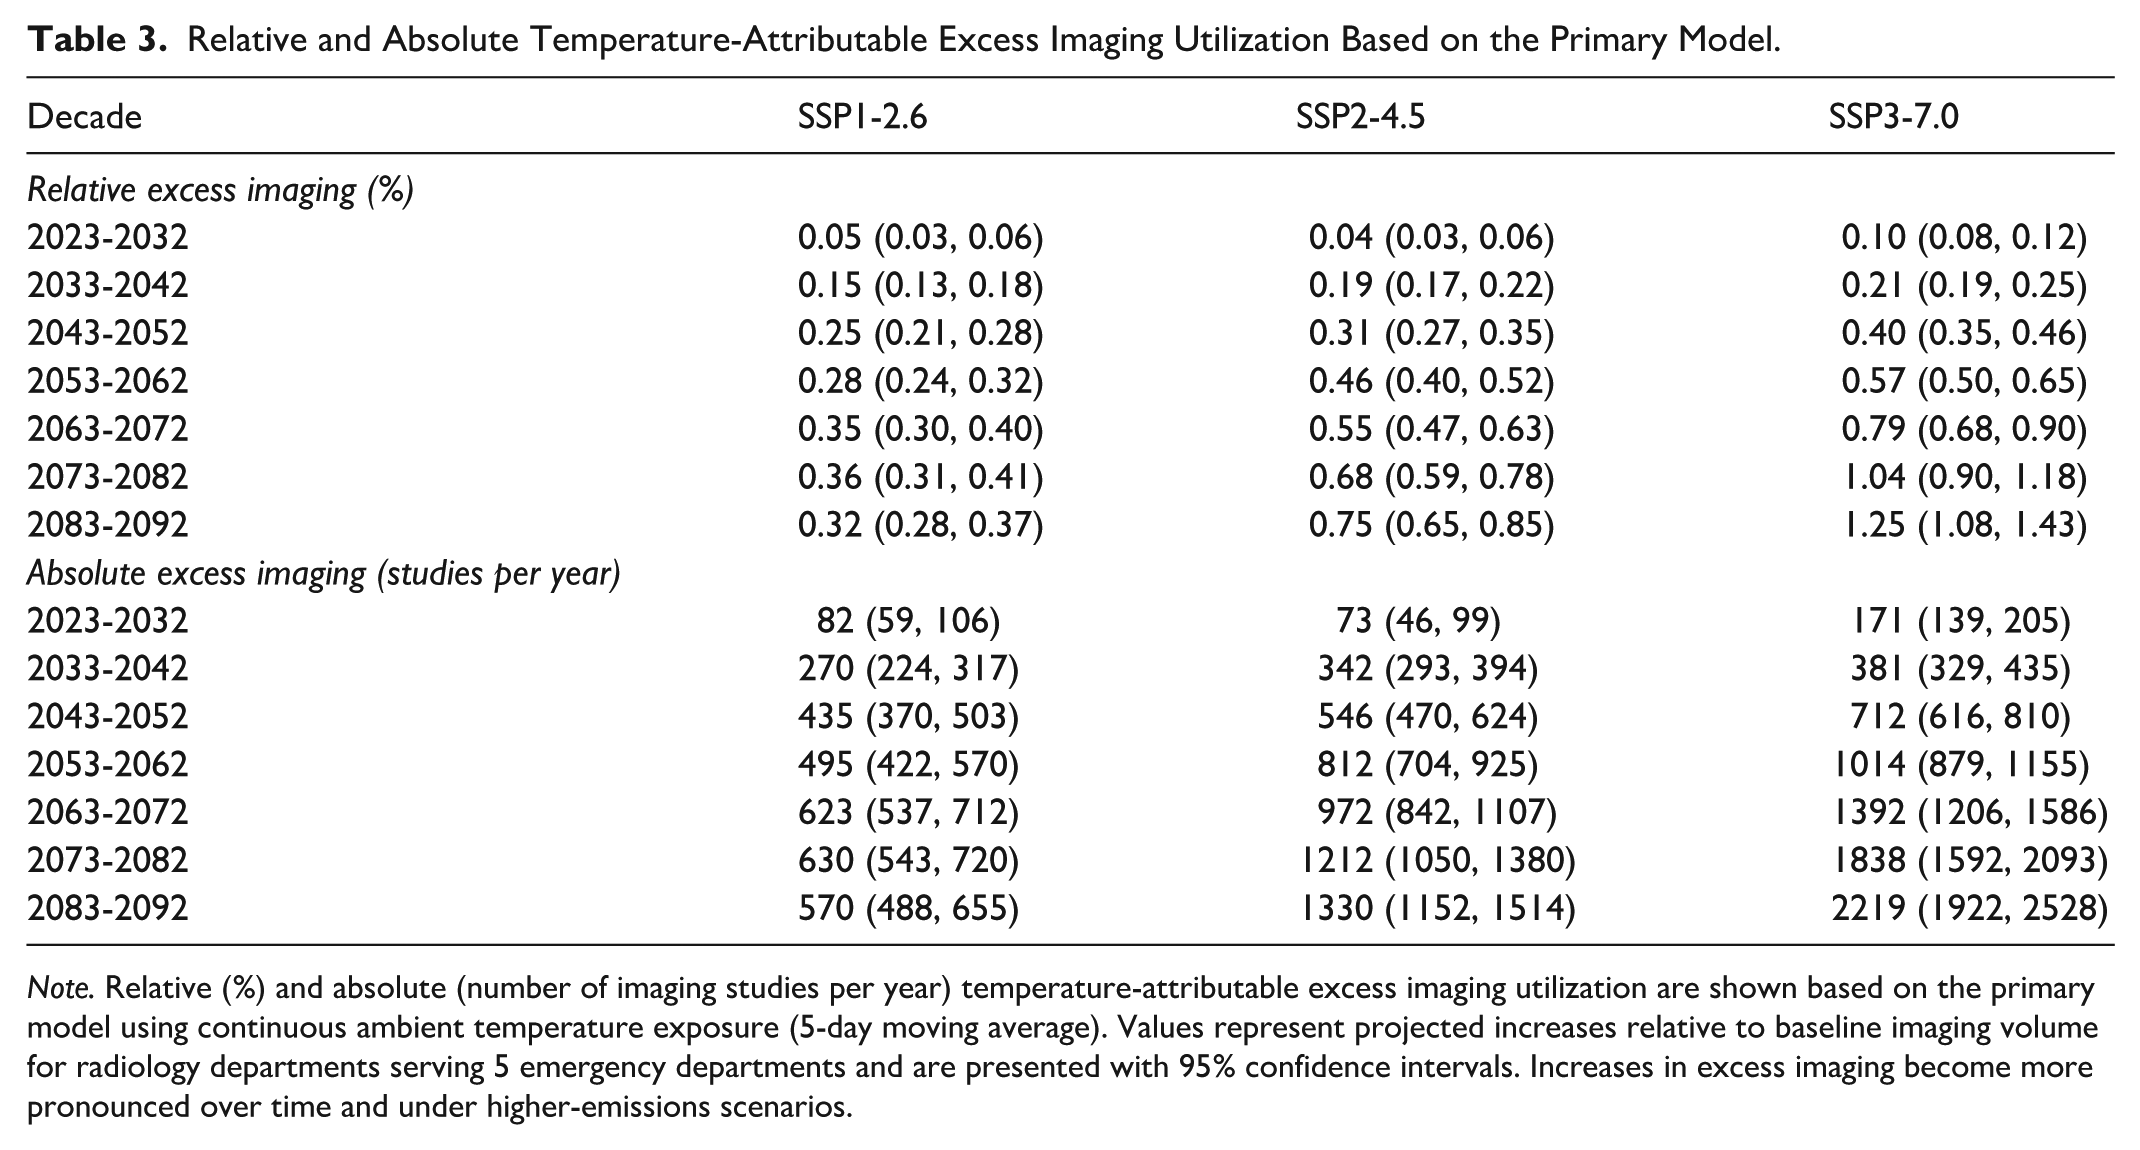
Note. Relative (%) and absolute (number of imaging studies per year) temperature-attributable excess imaging utilization are shown based on the primary model using continuous ambient temperature exposure (5-day moving average). Values represent projected increases relative to baseline imaging volume for radiology departments serving 5 emergency departments and are presented with 95% confidence intervals. Increases in excess imaging become more pronounced over time and under higher-emissions scenarios.
These relative increases correspond to an annual excess of 570 (95% CI, 488-655), 1329 (95% CI, 1152-1515), and 2219 (95% CI, 1922-2528) imaging studies locally under the SSP1-2.6, SSP2-4.5, and SSP3-7.0, respectively. When extrapolated nationally, this corresponds to an excess of 13 900 (95% CI, 11 900-15 950), 33 225 (95% CI, 28 800-37 875), and 55 475 (95% CI, 48 050-63 200) total emergency medical imaging studies per year attributable to rising temperatures across the 3 climate pathways.
Excess Imaging Utilization by Modality
Projected increases in imaging utilization vary by modality, with the largest relative increases observed for radiography across all scenarios (Figure 4). By 2083 to 2092, radiography utilization is projected to increase by 0.46% (95% CI, 0.39-0.52) under SSP1-2.6 and 1.78% (95% CI, 1.54-2.03) under SSP3-7.0.
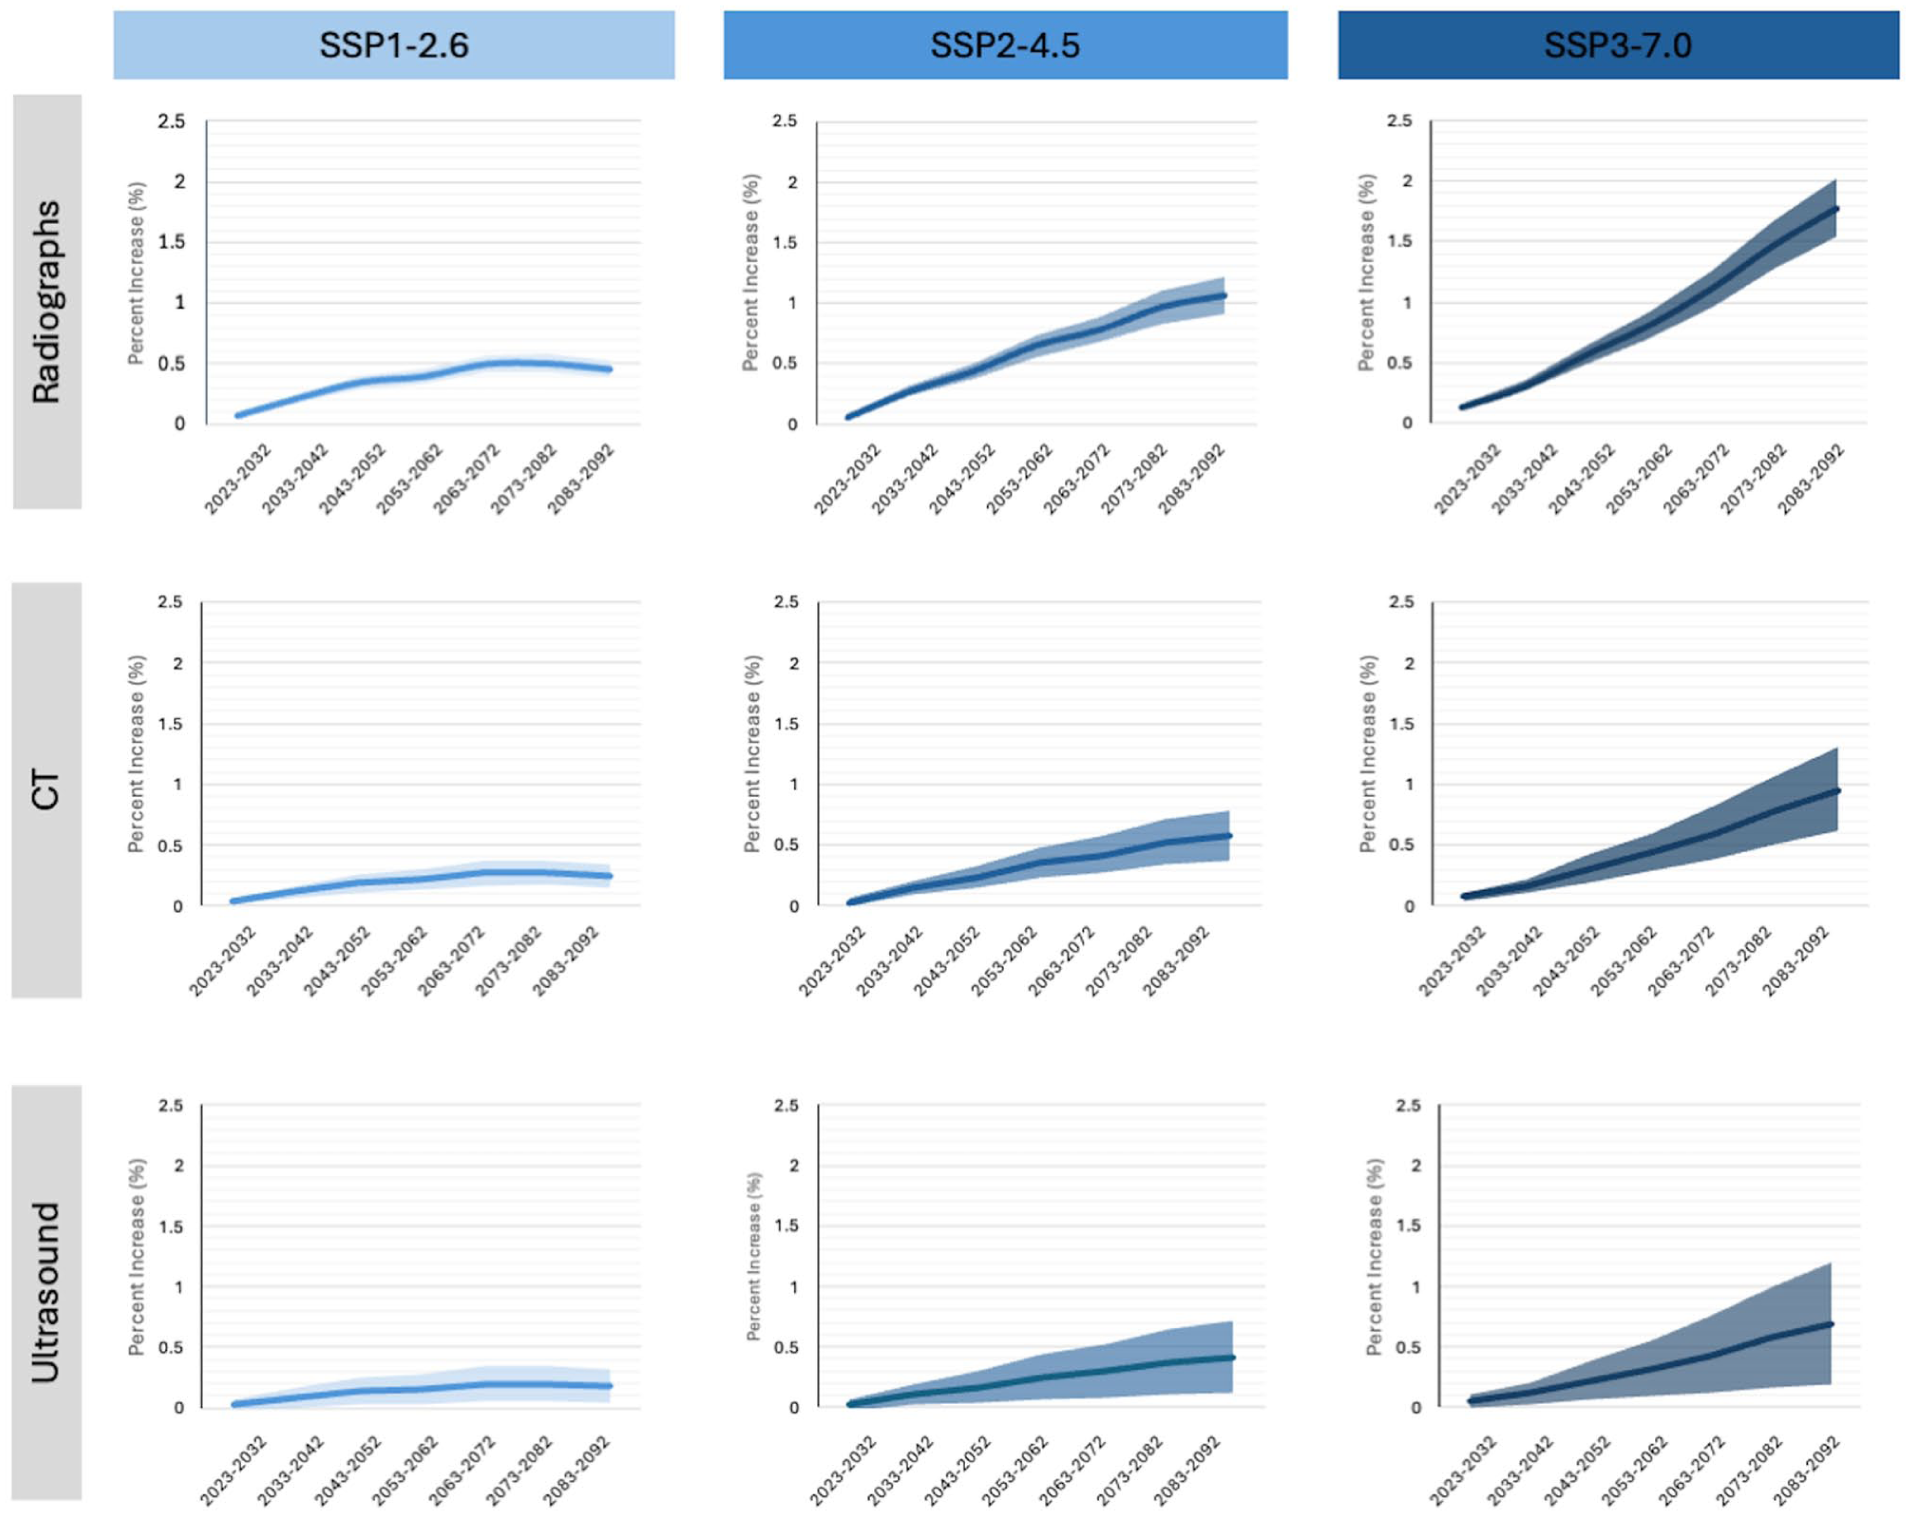
Projected temperature-attributable increase in imaging utilization by modality. Percent increase in imaging utilization relative to baseline for radiographs, CT, and ultrasound, with shaded areas representing 95% confidence intervals. All modalities show increasing demand over time, with the largest increases under SSP3-7.0. Radiographs demonstrate the greatest relative increase, whereas ultrasound shows the smallest.
In comparison, CT utilization is projected to increase by 0.24% (95% CI, 0.15-0.34) to 0.95% (95% CI, 0.61-1.30), and ultrasound utilization by 0.18% (95% CI, 0.04-0.32) to 0.69% (95% CI, 0.20-1.20) across the same scenarios. This modality gradient suggests differential sensitivity of imaging utilization to temperature-related clinical demand.
Sensitivity Analysis
Projected increases in imaging utilization were broadly consistent across alternative exposure definitions, including varying exposure windows and an extreme-heat–based definition, supporting the robustness of the primary model. Estimates varied modestly by exposure window, with higher projected increases observed with a 2-day moving average and lower estimates with a 7-day moving average, relative to the primary 5-day moving average model. Projections using the extreme heat definition showed similar patterns over time and across scenarios, with slightly attenuated relative increases compared to the primary model.
By 2083 to 2092, projected temperature-attributable imaging utilization increases using alternative exposure windows ranged from 0.28% to 0.49% under SSP1-2.6, 0.66% to 1.15% under SSP2-4.5, and 1.10% to 1.92% under SSP3-7.0. Using a 2-day exposure window, projected increases in the final decade were 0.49% (95% CI, 0.44-0.55), 1.15% (95% CI, 1.03-1.28), and 1.92% (95% CI, 1.72-2.14) under SSP1-2.6, SSP2-4.5, and SSP3-7.0, respectively. Using a 7-day exposure window, projected increases were lower at 0.28% (95% CI, 0.21-0.35), 0.66% (95% CI, 0.51-0.81), and 1.10% (95% CI, 0.86-1.36), respectively.
Using an alternative exposure definition based on extreme heat days, local excess imaging utilization was also projected to increase over time. Under SSP1-2.6, excess imaging increased modestly from 555 to 607 studies per year between 2023-2032 and 2083-2092. Under SSP3-7.0, excess imaging increased from 549 to 707 studies per year over the same period. These smaller increases relative to the primary model reflect the more restrictive exposure definition used in the extreme heat analysis, which captures only high-temperature days rather than the full distribution of rising ambient temperatures.
Discussion
Climate-driven warming is projected to increase ED imaging utilization through the end of the century. By 2083 to 2092, temperature-attributable imaging volumes are projected to rise by 0.32%, 0.75%, and 1.25% under low-, medium-, and high-emissions scenarios, respectively. This corresponds to an excess of 570 to 2219 imaging studies per year locally, or 13 900 to 55 475 excess imaging studies annually when extrapolated across Canada. Although relative increases are modest, these translate into meaningful absolute increases in imaging demand, particularly when aggregated at the health system level. Findings were consistent across alternative exposure definitions, supporting the robustness of the observed associations.
These findings extend prior evidence linking short-term heat exposure to increased healthcare utilization by providing scenario-based projections of future radiology demand. Prior studies have demonstrated substantial increases in heat-related hospitalizations and emergency care across diverse settings, particularly under higher-emissions pathways.36,37 For example, heat-related excess emergency hospitalizations for asthma in Japan are projected to increase 4.19-fold by 2091 to 2099 compared to 2011 to 2019 along the SSP5-8.5 pathway. 30 In Australia, 5707 to 9421 excess ED visits attributable to heat are expected in the 2030s and 2050s, resulting in AU$4.6 to 7.6 million in associated healthcare costs. 38 In China, excess hospitalizations from extreme heat are projected to reach 0.6 million, 3.8 million, and 5.1 million by 2100 without adaptations under low-, middle-, and high-emissions scenarios, respectively. 39 The present study builds on this literature by identifying medical imaging as a quantifiable and operationally relevant component of climate-sensitive healthcare demand. Unlike broader measures such as ED visits, imaging directly reflects downstream resource utilization, including equipment, staffing, and workflow constraints, making it a pragmatic metric for adaptation and resilience planning.
From a radiology perspective, even small relative increases in imaging utilization may have important operational implications. Emergency imaging services are often capacity-constrained, particularly for modalities such as CT, and incremental increases in demand may exacerbate bottlenecks in patient flow, reporting, and staffing. Further, emergency imaging volumes may be a marker of demand in both inpatient and outpatient settings, with total impact greater than evaluated in the current study. These effects may be amplified during periods of extreme heat, when healthcare systems are already under strain, supporting the need for proactive capacity planning, including workforce allocation, equipment investment, and ED workflow optimization.15,18,20,24 Anticipating heat-related increases in demand may enable radiology departments to better align staffing, scheduling, and resource allocation with projected needs.
At a systems level, the projected increases correspond to thousands of additional imaging studies when scaled nationally, representing a meaningful increase in workload, particularly over longer time horizons. 40 Importantly, these projections reflect temperature-attributable excess imaging relative to a fixed baseline and do not incorporate secular increases in imaging utilization due to population growth, aging, or evolving clinical practice. As a result, total future imaging demand may be substantially higher, suggesting that the combined impact of climate change and baseline growth may place increasing pressure on radiology services. 41 These projections also provide a foundation for climate-informed radiology preparedness. Anticipating heat-related demand surges may enable the development of targeted operational strategies, including seasonal staffing models, surge protocols during extreme heat events, and integration of environmental data into demand forecasting.42,43 In parallel, demand-side interventions that reduce heat exposure and associated morbidity may offer downstream reductions in imaging utilization, reinforcing the importance of cross-sector collaboration between healthcare, public health, and policy stakeholders. 36
The results also highlight an important feedback loop. Increasing demand for imaging driven by climate change has implications not only for capacity but also for environmental sustainability, as imaging services are resource-intensive and contribute to healthcare-related greenhouse gas emissions. 15 This underscores the need for integrated approaches that consider both adaptation and mitigation within radiology.6,44,45 Adaptation strategies include optimizing workflow efficiency, expanding capacity during high-demand periods, and improving surge preparedness during extreme heat events. Mitigation efforts focus on reducing the carbon footprint of imaging through equipment optimization, energy-efficient practices, the reduction of inappropriate imaging, and supply chain interventions.
This study has limitations. First, the temperature–imaging association was assumed to be linear, which may not capture potential non-linear or threshold effects at extreme temperatures. Short-term exposure–response relationships were extrapolated to long-term projections, although sensitivity analyses yielded consistent findings across alternative exposure definitions. Potential future adaptations, including changes in infrastructure, clinical practice, or population vulnerability, were not accounted for and could modify the observed associations. Second, projections isolate the effect of ambient temperature and do not incorporate other climate-related exposures, such as air pollution or humidity, which may independently influence imaging utilization. 46 Third, generalizability may be limited, as the analysis was based on data from urban academic hospitals in a single geographic region with a temperate climate. Future region-specific projections are needed to account for geographic variability in climate exposure and health system capacity.
In conclusion, climate-driven increases in ambient temperature are projected to raise demand for emergency medical imaging across all emissions scenarios, with larger and more sustained increases under higher-emissions pathways. Although relative increases are modest, their cumulative impact is substantial at the health system level. These findings highlight the need for integrated adaptation and mitigation strategies in radiology to ensure that imaging services remain resilient, efficient, and aligned with broader efforts to reduce the environmental impact of healthcare and strengthen climate-resilient imaging systems.
Supplemental Material
sj-docx-1-caj-10.1177_08465371261457322 – Supplemental material for Projected Increases in Heat-Related Emergency Department Imaging Utilization Under Climate Change Scenarios
Supplemental material, sj-docx-1-caj-10.1177_08465371261457322 for Projected Increases in Heat-Related Emergency Department Imaging Utilization Under Climate Change Scenarios by Eray Yilmaz, Chloe DesRoche, Pierre Masselot, Anish Kirpalani, Birgit Ertl-Wagner, Julien Aguet, Heidi Schmidt, Michael N. Patlas and Kate Hanneman in Canadian Association of Radiologists Journal
Footnotes
Funding
The authors disclosed receipt of the following financial support for the research, authorship, and/or publication of this article: RSNA R&E Foundation Emerging Issues Grant (EIEIS24-510) and University of Toronto Collaborative Centre for Climate, Health & Sustainable Care Seed Grant.
Declaration of Conflicting Interests
The authors declared no potential conflicts of interest with respect to the research, authorship, and/or publication of this article.
Supplemental Material
Supplemental material for this article is available online.
References
Supplementary Material
Please find the following supplemental material available below.
For Open Access articles published under a Creative Commons License, all supplemental material carries the same license as the article it is associated with.
For non-Open Access articles published, all supplemental material carries a non-exclusive license, and permission requests for re-use of supplemental material or any part of supplemental material shall be sent directly to the copyright owner as specified in the copyright notice associated with the article.