
Abstract
This study assessed women’s violent and nonviolent offending, using data from two online student samples (men and women: n = 344), reporting on either being a perpetrator and witness (women) or being a victim and witness (men). A comprehensive measure of general violence, intimate partner violence (IPV), and nonviolent offending was collected. From women’s self-reports, 59.9% reported perpetrating general violent offenses, 58.1% reported perpetrating IPV offenses and 85.6% reported perpetrating nonviolent offenses. Correlations showed that women were involved in a variety of offenses and demonstrated the interrelatedness of general violence and IPV, and of violent and nonviolent offenses. Regression analysis confirmed the close association between partner and general violence, and found that drug offenses were also related to the former and criminal damage to the latter. Overall, the prevalence data demonstrated women’s involvement in all types of offending, and a similar pattern of offending was supported across data sources. Limitations of the sampling method and measures are discussed.
Violent and nonviolent offending behavior is traditionally considered to be male-dominated, and this is borne out by self-reports, informant reports, and officially recorded statistics (Moffitt, Caspi, Rutter, & Silva, 2001; Steffensmeier & Allan, 1996). Men are reported to commit significantly more theft and drug-related offenses than women, and to be significantly more violent than women outside the home, at every age (Archer, 2004; Moffitt et al., 2001). As a result of this sex difference, research has commonly focused on men.
Violent Offending Behavior
Although men perpetrate more violence outside of the home than women do, women are still found to engage in a significant amount of violence toward others. British crime figures show that violence against the person accounted for 17% of all indictable offenses for women in 2007, compared to 19% for men (Ministry of Justice, 2007), and this was the second largest offense category for women (and men) after thefts and handling stolen goods. The U.S. crime figures demonstrate a similar trend. Violent crime and other assaults accounted for 12.9% of arrests for women and 13.8% for men in 2008 (U.S. Department of Justice, 2009). This was the third largest offense category for women after “all other offenses (except traffic)” and property crime, and was the second largest offense category for men after “all other offenses (except traffic).” Crime statistics of women’s violent convictions are likely to underestimate actual perpetration rates for several reasons. The first is that self-reported offending rates are higher than conviction rates, demonstrating that the likelihood of being caught and convicted following an offense is low (Farrington et al., 2006). Women are also more likely than men to be cautioned or have their case dismissed (George, 1999, 2003; Simmons, Lehmann, Cobb, & Fowler, 2005; Steffensmeier, Kramer, & Streifel, 1993). Women’s choice of victim may also obscure their violence as this is usually family members (George, 1999), even in the most extreme of violent crimes (e.g., Fox & Levin, 2005; Rodge, Hougen, & Poulsen, 2000).
Family conflict research over the last 40 years has consistently shown that women perpetrate violence toward their intimate partners (Straus, 2007) at equal or higher rates than men, which contrasts with the pattern of men being more physically aggressive than women for same-sex conflicts (Archer, 2009). Studies using unselected samples (e.g., student or community samples), from the United States and other western nations, have found that women are similar to men in their frequency of physical aggression within intimate relationships (Archer, 2000, 2002, 2006; Felson, 2002). This has been shown to be the case for “minor” violence (e.g., pushing, slapping, hitting) as well as more “severe” (e.g. kicking, biting, punching, hitting with an object) types of violence (Ehrensaft, Moffitt, & Caspi, 2004; Lussier et al., 2009). In contrast to the family conflict perspective, patriarchal theory holds that women’s partner violence is defensive, whereas men’s partner violence is coercive (e.g., Dobash, Dobash, Cavanagh, & Lewis, 1998) and that partner violence is overwhelmingly men perpetrating violence against women (Dobash & Dobash, 1980, 1998, 2004; Dobash, Dobash, Wilson, & Daly, 1992). However, a defensive response cannot account for all women’s perpetration of IPV (Gray & Forshee, 1997; Magdol et al., 1997; Stets & Straus, 1990) as women have been found to initiate half of all relationship violence (Straus & Gelles, 1988), and a significant proportion of women are violent toward nonviolent partners (Morse, 1995; Simmons et al., 2005; Straus & Ramirez, 2004).
Conduct disorder in childhood is a reliable predictor of adult women’s aggressive behavior (Burnett & Newman, 2005). Longitudinal research has found that women with adolescent conduct problems are more likely to enter into a relationship with a violent man and are likely to perpetrate violence toward their partners, in excess of their own victimization (Moffitt et al., 2001). Therefore this IPV “is but another expression of an earlier emerging antisocial propensity” (Moffitt et al., 2001, p. 65) and cannot be explained in terms of self-defense. Longitudinal data has demonstrated that the overlap between IPV and general violence perpetration is similar for men and women (Moffitt et al., 2001). In addition, research has shown that risk factors for aggressive and antisocial behavior tend to be shared by both boys and girls (Broidy et al., 2003; Côté, Tremblay, Nagin, Zoccolillo, & Vitaro, 2002; Moffitt et al., 2001) and that the same influences predict both general aggression and partner aggression in men and women (Moffitt, Krueger, Caspi, & Fagan, 2000, Tremblay et al., 2004). These shared risk factors suggest that the different forms of aggression are developmentally similar and likely to co-occur.
Studies on sibling abuse and child abuse find that females are as likely as males to be perpetrators of sibling violence (Goodwin & Roscoe, 1990) and child physical and emotional maltreatment (Cawson, Wattam, Brooker, & Kelly, 2000). Indeed some research in the United States has found that perpetrators of nonsexual child abuse are predominantly female and, when acting alone, women were twice as likely as men were to abuse their children (Gaudiosi, 2006, 2009). Although perpetrators of child sexual abuse are predominantly male (Cawson et al., 2000), women are still responsible for a significant amount (Fergusson & Mullen, 1999).
Nonviolent Offending Behavior
Both men and women are more likely to perpetrate offenses where the risk of confrontation, and therefore of physical harm, is low. From an evolutionary perspective, avoiding harm increases the likelihood of reproductive success in both sexes. It is theorized, however, that this effect may be more pronounced in women than men as they have less to gain and more to lose in terms of protecting existing offspring, making them more averse to physical risk (Campbell, 1999). Therefore men and women, but more so women, are more likely to perpetrate nonviolent than violent offenses. Evidence in support of this theory can be found in U.K. and U.S. crime statistics.
Sources of Data
Research into offending behavior frequently relies on self-report data, which although valuable can be subject to social desirability bias. Participants reporting about themselves may underreport their involvement in violent and nonviolent offenses as a result of wanting to respond in a socially desirable manner. Using additional sources of data, such as victim reports and third-party reports, may provide more accurate prevalence rates for women’s perpetration of offenses. Third-party data has previously been used widely in research and in a variety of settings. Moffitt et al. (2001) used reports from parents, teachers, and informants, as well as self-reports, to measure physical aggression in male and female participants of different ages. Third-party and partner reports have also been used alongside self-reports in partner violence research (Cui, Lorenz, Conger, Melby, & Bryant, 2005) to examine discrepancies in reporting hostile behavior within relationships. Using third-party data to report on the behavior of others, as well as self-reports of participants’ own behavior, may result in a more accurate account of women’s involvement in offending behavior. Therefore the current study employed three types of data from two sources: self-reports (women only), victim reports (men only), and third-party reports (men and women), of women’s offending.
Interrelatedness of Offending
General violence, partner violence, and nonviolent offending behavior are usually researched independently. However, there is evidence that these different offenses co-occur in both men and women (Farrington et al., 2006; Gottfredson & Hirschi, 2007; Moffitt et al., 2000; Straus & Ramirez, 2004). Previous research has found that women (and men) who perpetrate IPV have a history of antisocial behavior (Moffitt et al., 2001) and that aggressive adults are highly likely to have a history of aggressive behavior beginning in childhood (Conradi, Geffner, Hamberger, & Lawson, 2009; Hay, 2005).
The interrelatedness of IPV and general aggression has been shown in research by Moffitt and colleagues (2001), who found that partner-violent women at age 21 were 4.4 times more likely to aggress against nonfamily members than women who were nonviolent to partners. Similar results were found in a follow-up analysis of these data, at ages 24 to 26 years (Ehrensaft, Cohen & Johnson, 2006), and other longitudinal research has found similar findings (e.g., Giordano, Millhonin, Cernokovich, Pugh, & Rudolph, 1999). All this research demonstrates that different types of aggressive behavior are likely to co-occur in women. Consistent with these findings are studies of the criminal histories of women arrested for partner violence, which have found that a substantial subgroup of these women have prior convictions for crimes unrelated to partner abuse (Babcock, Miller, & Siard, 2003; Busch & Rosenberg, 2004; Henning & Feder, 2004; Moffitt et al., 2001). All this research provides evidence for the interrelatedness of different types of crimes and provides a rationale for assessing them all in the same sample.
Although the three offense areas are usually researched in isolation, there is some research that has examined them together. For example, Straus and Ramirez (2004) investigated the violent and nonviolent criminal history of IPV perpetrators. They found that a prior criminal history predicted IPV perpetration, and the relationship was stronger for prior violent crime than for property crime. However, previous research has typically not separated involvement in general violence and nonviolent offending, instead combining them into one category. For example, Moffitt et al. (2000) included general violence with nonviolent offenses as “general crime,” and compared this with IPV, finding that general crime was predicted by low self-control but that IPV was not. They did not assess whether general violence and nonviolent crimes were distinct. The current study extends the work of Moffitt et al. (2000) by analyzing the three offenses as three separate domains although with the limitation that the current study involved a relatively small student sample, whereas that of Moffitt et al. (2000) was a large representative longitudinal study.
Unfortunately, when previous research has been conducted in this area, researchers have used different measures for the three offense types, which hinders comparisons. In addition, the measures used to measure general violence and nonviolent offending have tended to be brief, which may threaten validity, particularly for women as less is known about the types of crimes in which they are involved. To overcome this limitation, the current research involved a measure that (a) assesses all three offense types using the same response formats, and (b) has a wide variety of criminal acts included, so that the profile of women’s offending can be adequately captured.
Thus the aim of the current study was to provide an assessment of women’s involvement in violent and nonviolent offending behavior, using self-reports (women), victim reports (men), and third-party reports (men and women), from an online sample unselected for previous criminal history. The purpose was threefold: First, to investigate a sample of unselected women’s involvement in violent and nonviolent offenses using the three types of data; Second, using women’s self-reports only, to investigate the interrelationships between the different types of offending; and third, using women’s self-reports only, to analyze the association between, first general violence, and second IPV, and other offense variables.
Method
Participants
Participants were a convenience sample, recruited online at the University of Central Lancashire, Preston, in the United Kingdom. There were 344 participants, 60 men and 284 women. Age ranged from 18 years to 68 years with a mean of 25.8 years. The response rate was 75.3% and was calculated using a statcounter, which identified the number of people on the homepage and the number of people on the end page. There were 497 people who visited the homepage and 374 of those submitted the questionnaire. Of those, 344 were retained for analysis: 30 were removed either due to missing data or respondents not being involved in a heterosexual relationship (ever since age 18). Individuals in homosexual relationships were not included in this study because the number of responses was very low.
Questionnaire Measure
The Nonviolent and Violent Offending Behavior Scale (NVOBS; Thornton, Graham-Kevan & Archer, 2010a) is a behavioral checklist consisting of 119 items and is designed to measure perpetration of general violence, IPV, and nonviolent offending. Items were selected by reviewing existing measures (Bendixen & Olweus, 1999; Charles & Egan, 2005; Dahlberg, Toal, & Behrens, 1998; Huizinga, Esbensen, & Weiher, 1991; Mak, 1993; Moffitt & Silva, 1988; Straus, Hamby, Boney-McCoy, & Sugarman, 1996) to include a broad range of criminal acts. Items were adapted for use in the current study so that they all had the same response options. There were 12 general violence items (e.g., pushed or shoved someone), 19 IPV items (e.g., pushed or shoved partner), 14 sexual offense items (e.g., forced someone above 16 to do sexual acts), 3 robbery offenses (e.g., used force to obtain money), 16 drug offenses items (e.g., sold cannabis), 5 offense against vehicles items (e.g., stole a car), 14 other thefts items (e.g., stole more than UK£100), 10 fraud and forgery items (e.g., been involved in benefit fraud), 10 criminal damage items (e.g., graffiti in a public place) and 16 other-offense items (e.g., driving under the influence of alcohol). The response options for these items were yes or no/not applicable. Women were asked to read each statement and then report whether they had committed that behavior since the age of 18 years. They were also asked to report whether they personally knew a woman of 18 years or older who had committed that behavior. Men were asked to read each statement and then report whether a woman of 18 years or above committed each offense toward them and also whether they personally knew a woman of 18 years or older who had committed each offense. Men and women were also asked to report if the statement did not apply to either themselves or another woman, otherwise it would not have been clear whether participants had not answered that question or if it was just not applicable to them. Kuder–Richardson Formula 20 (KR-20) was used to assess the internal reliability for the subscales as the measure is dichotomous. Reliability values are provided here for women’s self-reports; reliabilities for the other data sources are generally consistent with these and can be obtained from the first author: general violence = .84; IPV = .89; sexual offenses = .78; robbery offenses = .84; drug offenses = .80; offense against vehicles = .68; other thefts = .67; fraud and forgery = .78; criminal damage = .69; other-offense items = .67. This measure has been used in previous research (Thornton, Graham-Kevan, & Archer, 2010b) where further details of the measures can be found.
Procedure
A web link was emailed to students at a British university, and was placed on research web sites alerting potential respondents to the online questionnaire. Here the questionnaire content was explained along with eligibility criteria (aged 18 years or older). Participants who consented were then directed to the questionnaire. Participants were from a variety of courses, including psychology. Students volunteered for this study and did not receive course credit or compensation for taking part in the research. The study was approved by the University of Central Lancashire Ethics Committee.
Results
Prior to analysis, the data was screened for accuracy, missing data, outliers, and normality (Tabachnick & Fidell, 2007). Outliers were reduced, so that extreme scores were one more than the next most extreme score. Reducing outliers resulted in sexual offenses, robbery, offenses against vehicles, fraud and forgery, and criminal damage offense categories being converted into categorical variables on a 0/1 scale. To control for multiple comparisons the alpha level was set at .01 throughout.
Prevalence of Women’s Offending: Agreement Between Respondents
A prevalence score indicates whether one or more items in a scale were endorsed by respondents and was calculated for each offense category according to whether men or women had reported “yes” to one or more items (= 1), or “no” to all items in that category (= 0), creating dichotomous variables. Prevalence figures do not allow differentiation between how often or how many behaviors were endorsed. Women’s self-reports could involve male and female victims (except for IPV, which only includes heterosexual relationships, so that victims could only be male). Men only reported victimization from women. Table 1 shows the number and percentages of “yes” responses as a function of offense type and data source. Sex differences in prevalence figures for each of the offense categories were analyzed for each data source using a series of 2 × 2 χ2.
Number and Percentages of Women’s Prevalence for Each Offense Type by Data Source (N = 60 Men, 284 Women)
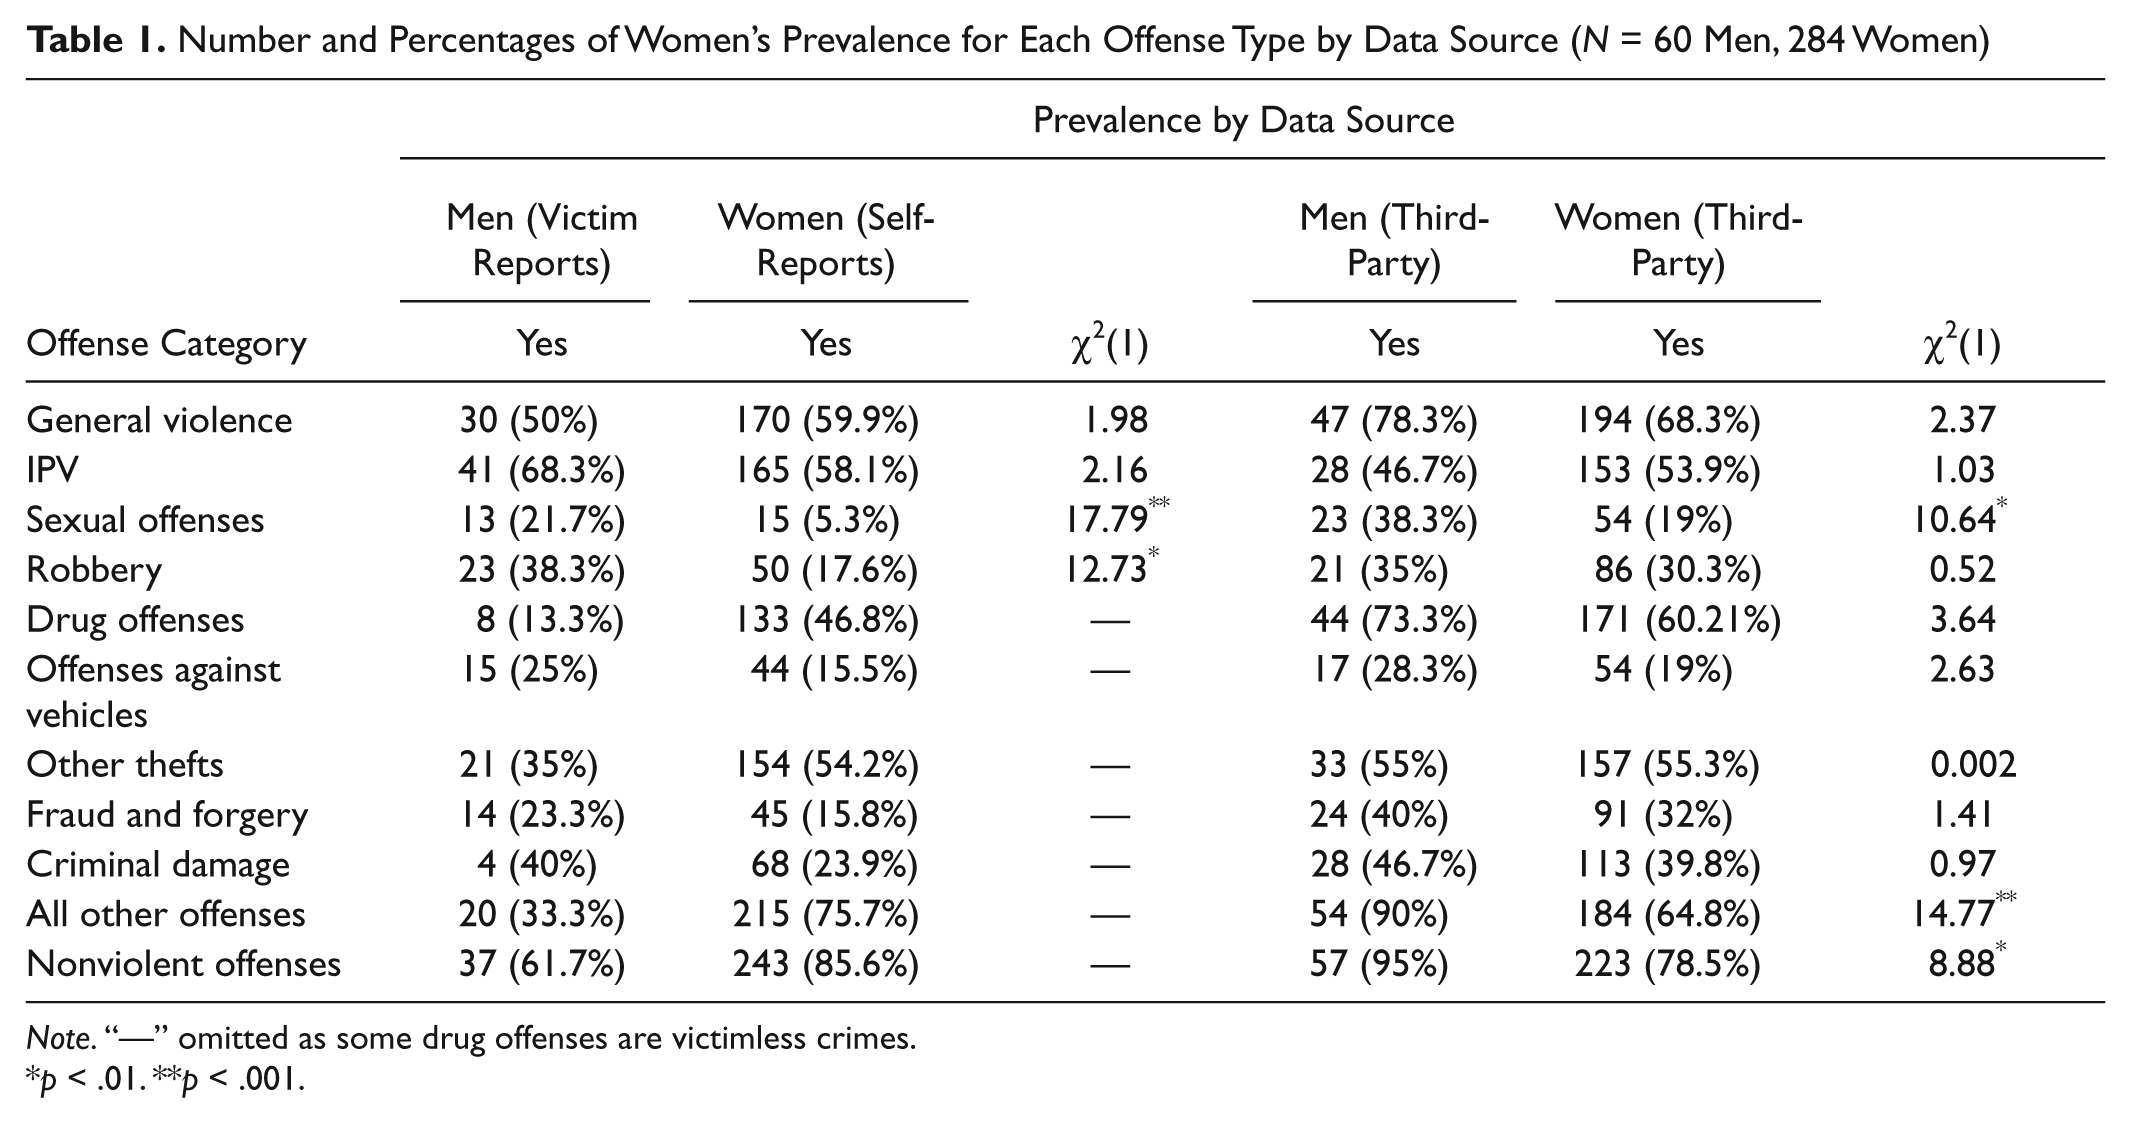
Note. “—” omitted as some drug offenses are victimless crimes.
p < .01. **p < .001.
The levels of women’s prevalence shown in Table 1 are generally high, and this is consistent across all four data sources. Women’s prevalence for general violence ranges from 50% to 78.3%, and for IPV ranges from 46.7% to 68.3%. The total nonviolent offenses demonstrate the highest prevalence rates and range from 61.7% to 95%. For the nonviolent offense category, offenses against vehicles, other thefts, fraud and forgery, criminal damage, and all other offenses were summed. Although women were reporting their own behavior toward both men and women, whereas men were reporting their victimization experiences from women only, there was a degree of similarity between men’s and women’s reports of women’s prevalence rates. Both men and women also reported as informants witnessing the behavior of women, and these reports could refer to several different women. Again there was good agreement between men’s and women’s third-party ratings of prevalence rates. The prevalence of the nonviolent offences were omitted from the self and victim report analyses (but the values have been included in the tables for information) because for some of the nonviolent offenses there is no immediate victim (e.g., stole from vending machine, fare dodging, drink drive no accident, yobbish in public place, drunk in public, thrown items from moving car, move road signs and all drug offences), rendering the comparisons meaningless.
Comparing Report Type on Occurrence of Women’s Offending
Variety scores were calculated by summing the “yes” responses for each item to create a scale of the variety of offenses perpetrated for each category. The mean scores and standard deviations for each offense category are presented by sex for perpetrator and victim self-reports in Table 2 and by sex for third-party reports regarding other women in Table 3. In most cases, the data are overdispersed, that is, the standard deviations are greater than the means. This is typically caused by a large proportion of zero values followed by a tail of other values. To accommodate this nonnormal distribution, a series of negative binomial regressions (Gardner, Mulvey, & Shaw, 1995; Hilbe, 2007; Hutchinson & Holtman, 2005) were used to analyze sex differences in the variety scores for the offense categories for each data source. The offense categories were the criterion variables and sex was dummy coded as the predictor variable.
Means and Standard Deviations for Variety Scores of Offenses Within Each Offense Category, for Men’s Victimization and Women’s Perpetration Self-Reports (N = 60 Men, 284 Women)

Note. “♦”indicates a dichotomous variable (range 0 to 1) – for robbery, offenses against vehicles and criminal damage this refers only to women’s self-reports. “—” omitted as men could not be the victim of some drug offenses.
Minus sign indicates that women’s values are higher than men’s.
p < .001.
Means and Standard Deviations for Variety Scores of Offenses Within Each Offense Category, for Men’s and Women’s Third-Party Reports (N = 60 Men, 284 Women)
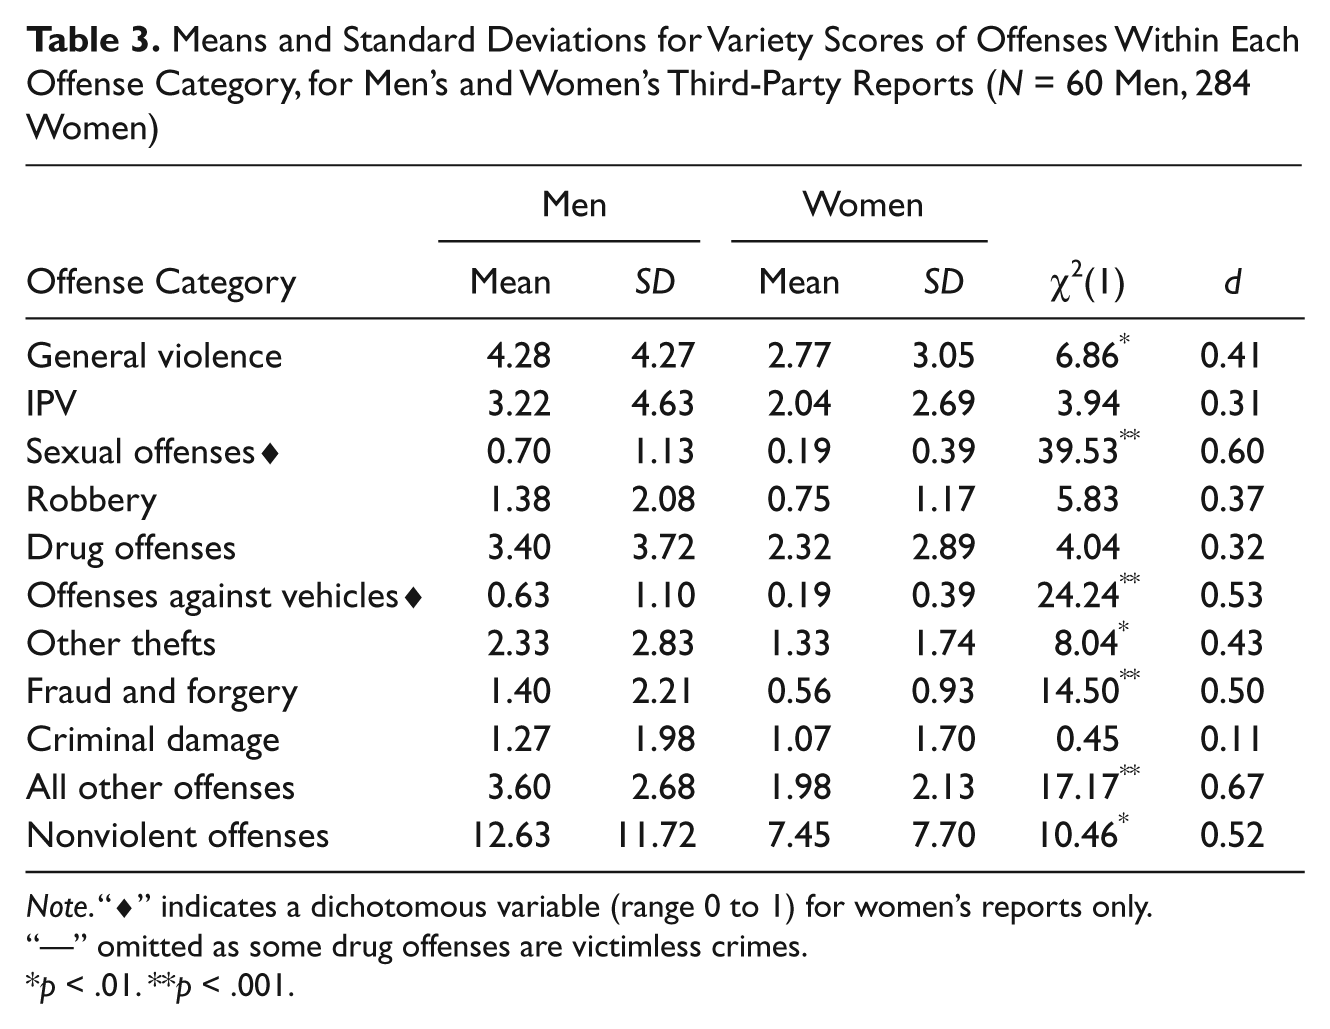
Note. “♦” indicates a dichotomous variable (range 0 to 1) for women’s reports only. “—” omitted as some drug offenses are victimless crimes.
p < .01. **p < .001.
Although women were reporting on their own behavior (which could be toward men or women) whereas men were reporting all their victimization experiences from women only (which could include several sources), the negative binomial regression results revealed some sex differences between men’s and women’s variety scores (Table 2). This does not reflect differences between two individuals experiencing the same acts, but instead refers to overall levels of personal experience. The scores for nonviolent offenses were omitted from the analysis, for the reason given before. The goodness-of-fit statistics were satisfactory as the Deviance value should be near 1 (general violence: Value/df = 1.05; IPV: Value/df = 1.07; sexual offenses: Value/df = 0.68; robbery: Value/df = 0.63). There were no significant differences between men’s and women’s scores for general violence. There was a significant difference between men’s and women’s scores for IPV, sexual offenses, and robbery, where men reported being victims of these offenses more than women reported perpetrating them. All these differences involved a medium-sized effect according to Cohen’s (1988) criteria, with the exception of robbery, which showed a large effect size. Overall, the levels were the highest for IPV, followed by general violence, although all other means were generally quite low.
Table 3 shows that there were significant differences between men’s and women’s third party report scores for general violence, sexual offenses, offenses against vehicles, other thefts, fraud and forgery, all other offenses, and nonviolent offenses overall with men being more likely than women to report the perpetration of these offenses by a woman. All these differences involved medium to large effect sizes according to Cohen’s (1988) criteria. For IPV, robbery, drug-related offenses, and criminal damage, the effect sizes were smaller (d ≤ .3), and there were no significant differences between men’s and women’s third party report scores. Again, the goodness-of-fit statistics were satisfactory (general violence: Value/df = 1.13; IPV: Value/df = 0.98; sexual offenses: Value/df = 0.79; robbery: Value/df = 0.82; drug-related offenses: Value/df = 1.08; offenses against vehicles: Value/df = 0.66; other thefts: Value/df = 1.01; fraud and forgery: Value/df = 0.80; criminal damage: Value/df = 0.87; all other offenses: Value/df = 1.16; nonviolent offenses: Value/df = 1.18).
Using Women’s Self-Reports to Explore the Interrelatedness of Women’s Offending
Table 4 shows the correlations between the variety scores of offense types for women’s self-reports. Pearson correlations were conducted between scores where both variables are continuous, point biserial correlations were conducted where one variable was continuous and the other was dichotomous, and phi was conducted where both variables were dichotomous (Howell, 2011). There were moderate, positive significant relationships between most offense categories, demonstrating that women who commit one type of offending also tend to be involved in the commission of other types. Of particular interest, there was a moderate, positive, highly significant relationship between women’s general violence and their IPV. Both general violence and IPV were positively correlated with nonviolent offenses, including offenses against vehicles, other thefts, criminal damage, and all other offenses. Overall, the correlational results indicate that violent and nonviolent offending is interrelated. There was no evidence of multicollinearity as there were no correlations above .70.
Pearson, Point Biserial and Phi Correlations Between Offense Categories for Women’s Self-Reports (N = 284 women)
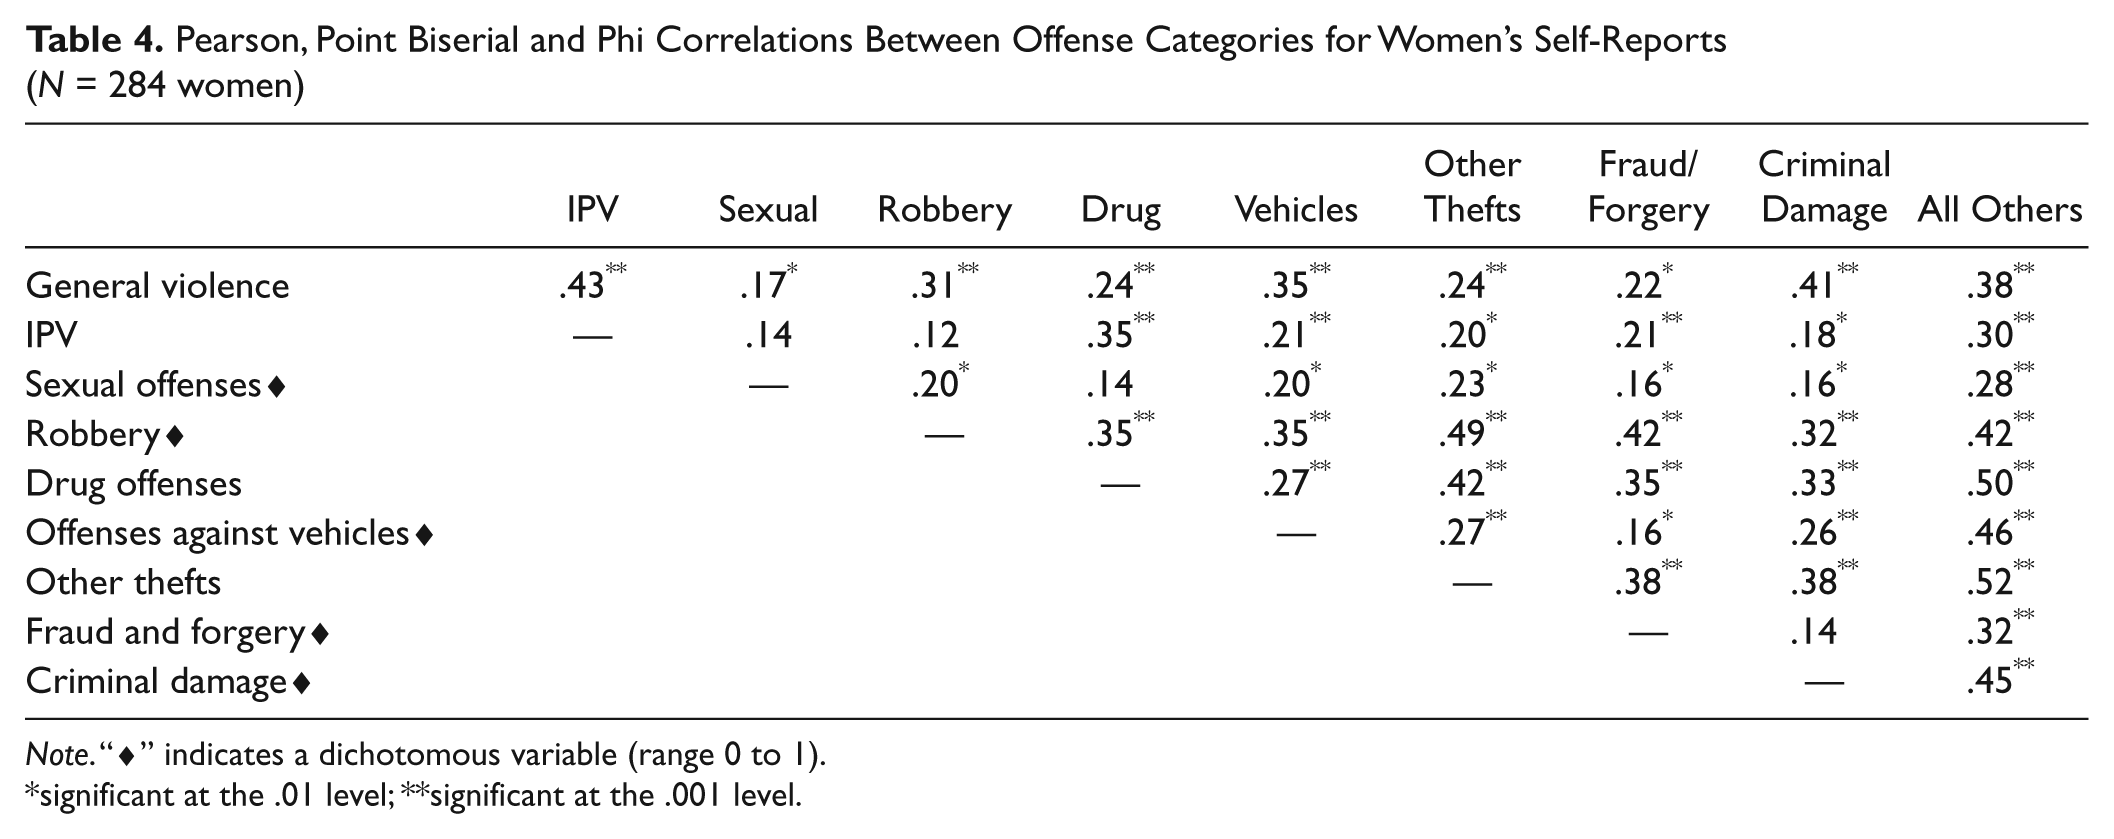
Note. “♦” indicates a dichotomous variable (range 0 to 1).
significant at the .01 level; **significant at the .001 level.
Negative Binomial Regression Using Women’s Self-Reports
It is apparent from Table 1 that for most variables, a majority of participants report zero scores. Even the two categories of principal interest, general violence and IPV, have more than 40% of participants recording a zero score. This sort of distribution is typically found in studies of IPV using the Conflict Tactics Scale and similar measures (Straus, 1979; Straus et al., 1996). The preferred method for such data sets, which are truncated at zero, highly skewed in the positive direction, and overdispersed (standard deviations are higher than the corresponding means), is negative binomial regression (Gardner et al., 1995; Hilbe, 2007; Hutchinson & Holtman, 2005). This has been used in recent studies of IPV (e.g., Archer, Fernández-Fuertes, & Thanzami, 2010; Finkel, DeWall, Slotter, Oaten, & Foshee, 2009), and was used in the present case to analyze the association between, first general violence, and second IPV, and the other variables for women’s self-reports.
Table 5 shows the results of a negative binomial regression with general aggression as the criterion and the other categories of offense as predictors. The goodness-of-fit statistic was satisfactory (Value/df = 1.15). Two variables were significant predictors of general violence: criminal damage and IPV. Table 6 shows a similar analysis using IPV as the criterion variable. The goodness-of-fit statistic was again satisfactory (Value/df = 1.13). General violence and drug offenses were the only two significant predictors of IPV. These analyses confirm the close association between violence to partners and other forms of violence. They also show that violence to partners or to others have some specific correlates, drug offenses in the case of IPV and criminal damage for violence to people who were not partners.
Negative Binomial Regression of the Other Categories of Criminal Behavior Onto Self-Reported General Violence
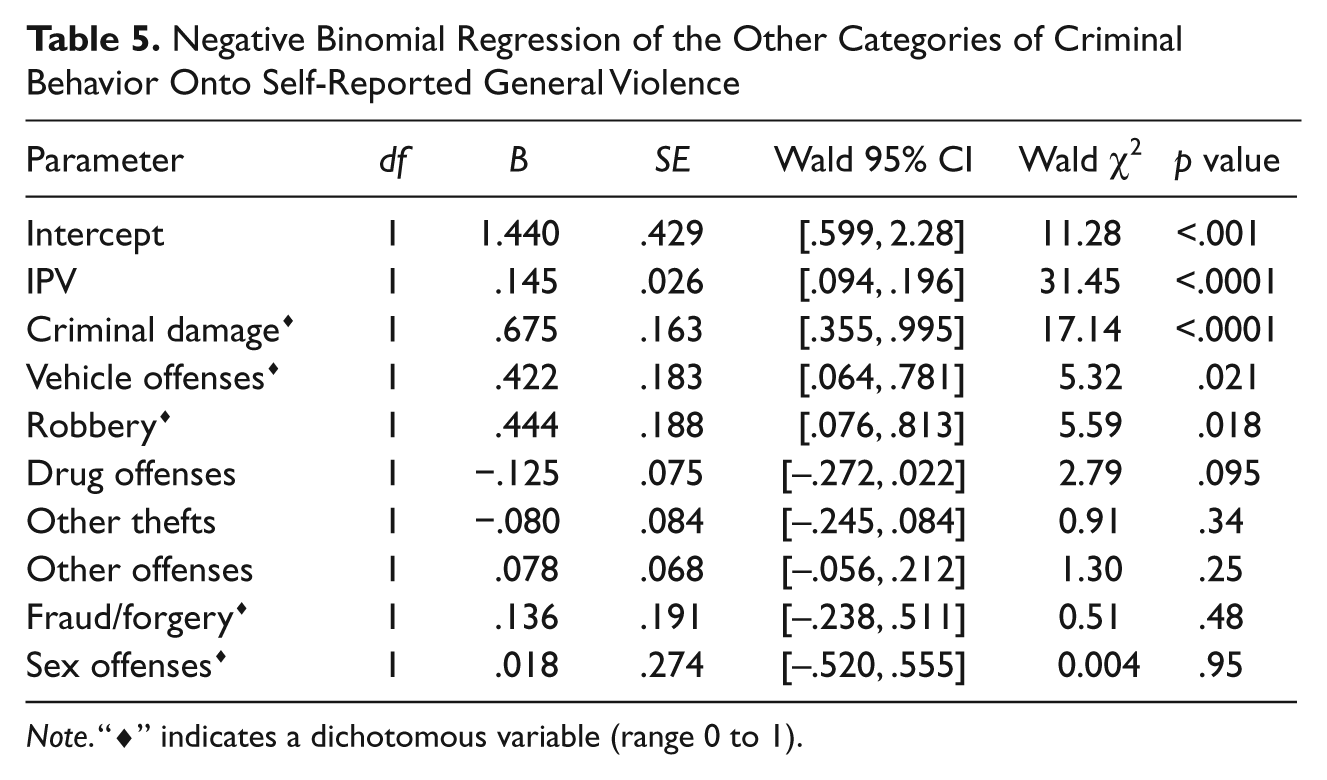
Note. “♦” indicates a dichotomous variable (range 0 to 1).
Negative Binomial Regression of the Other Categories of Criminal Behavior Onto Self-Reported IPV
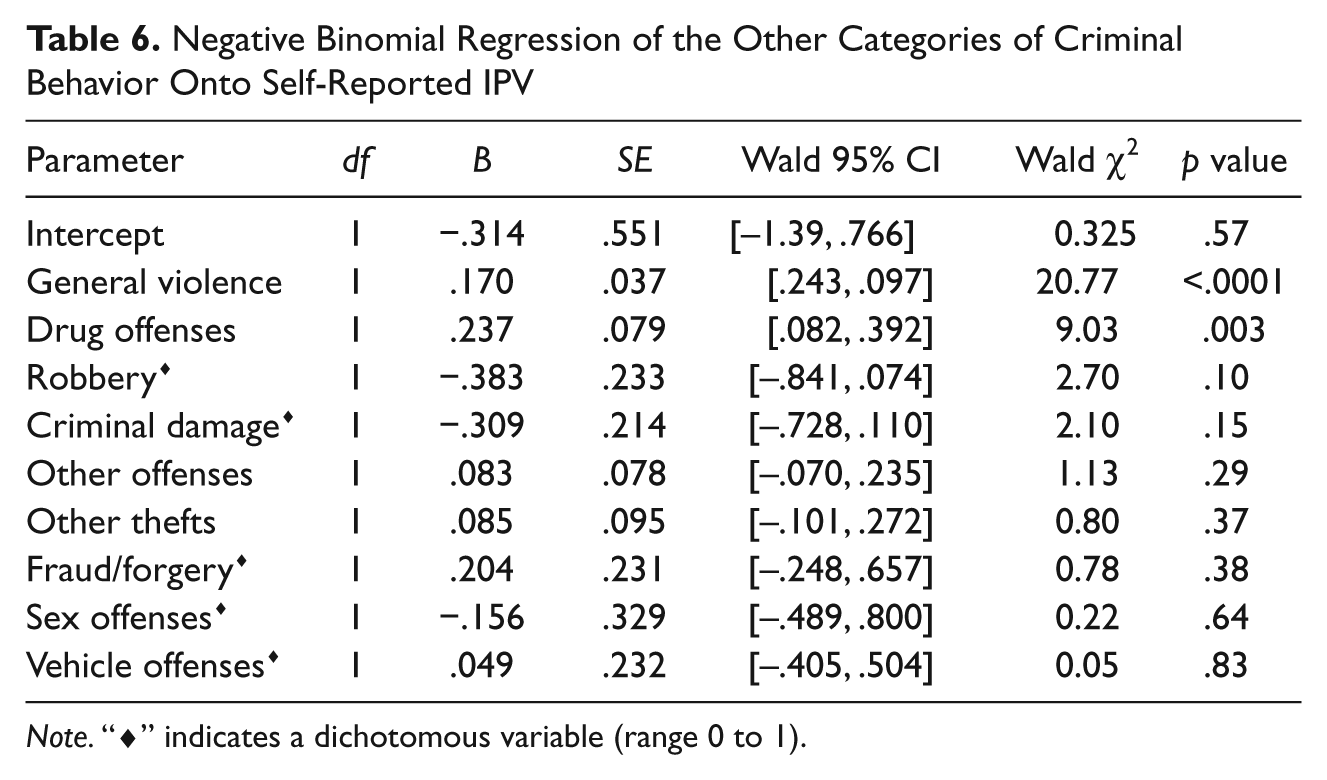
Note. “♦” indicates a dichotomous variable (range 0 to 1).
Discussion
Women’s prevalence of violent and nonviolent offending was assessed using self-reports from women, victim reports from men, and men’s and women’s third-party reports. The prevalence data showed that women were involved in all types of offending behavior, and this involvement was supported to a similar extent across data sources. Women’s self-reported prevalence rates for all three types of offending behavior were high, particularly the prevalence of nonviolent offending (75.7%), which suggests that having committed some form of nonviolent offence is essentially normative. This may be driven by the all other offence category, which showed the highest prevalence rate, with the item being drunk in public being endorsed by 62.1% of the women. The variety data showed that women were involved in a range of offenses. Variety scores were highest for IPV and general violence from self and victim reports, and were highest for general violence, IPV, other thefts and all other offenses from third party reports. Variety data were calculated for all categories: however, five categories were converted to binary variables following data screening. Overall, the results from the different data sources indicated that women are involved in both violent and nonviolent offenses. Although third party reports have been used in aggression (Moffitt et al., 2001) and IPV (Cui et al., 2005) the present research is unique in using third-party reports when examining violent and nonviolent offending. The intercorrelations between offense types for self-reports demonstrated the co-occurrence of different offenses and showed that the same women were likely to be violent toward partners as well as toward others and that violent women were also more likely to be involved in nonviolent offenses, including thefts, offenses against vehicles, and criminal damage.
Generally, there were few differences in prevalence estimates from women’s self-reports and men’s victim reports, and few differences between men’s and women’s third-party reports, demonstrating a good level of similarity between reports. Self and victim reports were similar for general violence and for IPV. Women reported perpetrating these offenses to a similar extent as men reported being victims of these offenses. More than 50% of men and women in the sample reported female perpetration of violent offenses. The third-party prevalence rates for general violence and IPV were also similar when reported by men and women: approximately 50% reported female perpetration of IPV and approximately 70% reported women’s involvement in general violence. These findings support previous research demonstrating that women can be violent toward intimate partners as well as outside of their intimate relationship (e.g., Moffitt et al., 2001). The IPV results are inconsistent with the view that women are overwhelmingly the victims of domestic violence (e.g., Dobash & Dobash, 1980, 1998, 2004; Dobash et al., 1992) because their levels of violence perpetration toward partners were quite high across all four data sources. However women’s motives for IPV were not assessed and therefore it is unclear to what extent the IPV reported here represents bidirectional or defensive violence.
The only differences between self and victim reports for women’s prevalence of offenses were for the categories robbery and sexual offenses. Men reported more victimization from robbery than women reported perpetration. The perpetrators of these actions may be outside the current sample of women, since female-to-male robberies tend to involve the use of weapons (Brookman, Mullins, Bennett, & Wright, 2007), and such women may be at the extreme end of the distribution of female criminal behavior. For sexual offenses, men reported more victimization than women reported perpetration: this could be a result of biased self-reporting, where perpetrators underreport their involvement in sexual offenses due to social disapproval, or a result of feeling ashamed (Fergusson & Mullen, 1999). Again, it could also be because the perpetrators of these actions were outside the current sample. The rates were very low, however, so the finding should be treated with caution. Hines and Douglas (2010) used a help-seeking and a community sample of men, asking them to report their own as well as their female partner’s perpetration of aggressive behavior using the revised Conflict Tactics Scales (CTS2: Straus et al., 1996). These reports included data on sexual aggression. Men in the help-seeking sample reported that their female partners used sexual aggression (i.e., insisting on sex) at significantly higher rates than they did. In the community sample reports, results showed that the men and their female partners engaged in similar levels of sexual aggression (i.e., insisting on sex). Therefore both the current study and that of Hines and Douglas (2010) confirm the occurrence of female sexual aggression toward male partners when using inclusive measure of aggression such as the CTS2.
The only sex differences in third-party reports of women’s offending prevalence were for sexual offenses and all other offenses. Men reported more female involvement in sexual offenses than women did. A discussion with an expert on sexual aggression (M. Davies, personal communication, October 2, 2009) suggested examining these offenses at the item level, as it was suggested that the items “showing genitals in public” and “prostitution” may be responsible for the differences. This was the case. Men reported knowing of a woman who showed her genitals in public or was being paid for sex more than women did. It is reasonable to expect that this significant effect was the result of men being more likely than women to witness female sex workers because more men than women access red light districts and lap dancing clubs.
Men’s third-party reports for the category “all other offenses” were significantly higher than women’s. This difference was also examined at the item level and it was found that 5 of the 16 items were responsible for the overall significant effect. These five items relate to two main categories: direct and indirect relational aggression (e.g., threats and blackmail) and illegal risky behavior (e.g., drunk driving). Men may be more sensitive to threats or damage to reputation or status (e.g., Daly & Wilson, 1988; Felson, 1982), and it may be that indirect (relational) aggression may be more salient to men than to women. This could explain why men’s third-party reports for “all other offenses” are higher. Furthermore, men tend to engage in more risk-taking behavior than women (Campbell & Muncer, 2009; Pawlowski, Atwal, & Dunbar, 2008) and because they are present in such situations they would see any woman who also took part. Women on the other hand do not generally take part in risky behavior and so would largely be unaware of the few women who do. This may explain why men’s third-party reports of risky behavior are higher than women’s.
The finding that women were involved in nonviolent offenses, and that nonviolent offending accounted for the largest proportion of women’s offending, was consistent with the view that women tend to be more represented in offenses that do not generally carry a risk of physical confrontation, as women are more averse than men to exposing themselves to physical harm (Campbell, 1999, 2002).
Consistent with previous research (Babcock et al., 2003; Moffitt et al., 2000, 2001), women in the current sample frequently reported engaging in more than one offense type. The interrelationships between offenses, for women’s self-reports, showed that frequently the same women were involved in more than one offense type. The correlational analysis found a moderately strong relationship between women’s IPV and general violence, and this was confirmed as the strongest association in regressions of IPV and of general violence on the other variables. These findings support the previous limited literature on women’s offending finding that women who perpetrate IPV are likely to have also perpetrated violence toward others (Ehrensaft et al., 2006; Moffitt et al., 2000, 2001; Thornton et al., 2010b), which is also consistent with the literature on men (Dixon & Browne, 2003; Holtzworth-Munroe & Stuart, 1994; Moffitt et al., 2000). Although between-sex comparisons are beyond the scope of the current research, they have been explored previously (Thornton et al., 2010b).
IPV was also moderately correlated with drug offenses and “all other offenses” although only drug offenses was a significant predictor in a regression analysis (along with general violence). Previous research (e.g., Babcock et al., 2003; Busch & Rosenberg, 2004; Henning & Feder, 2004; Moffitt et al., 2001) has found that female perpetrators of IPV tend to have a history of criminal behavior. Moffitt et al. (2000) measured general crime, comprising general violence and nonviolent offenses. The current study investigated these two variables separately and found that when the other variables were controlled, it was only criminal damage (along with IPV) that predicted general violence. These results show that the closest relationship is between violence to partners and to others, and that each of these have an additional predictor once the association with other types of offense have been controlled. Emerging research has also confirmed this relationship between violence and criminal damage; Howard and Dixon (2011) found that criminal damage predicted future violent offending.
Farrington et al. (2006, p. 1) found that self-reported male offenders tended “to be deviant in many aspects of their lives.” The current study builds on their findings by demonstrating that deviant women tend to be deviant in many aspects of their lives also. Similarly, in their general theory of crime, Gottfredson and Hirschi (2007) reported that offenders commit a wide variety of criminal acts and that specialism in one type of crime was rare. The moderate to high correlations between offense categories for women suggest that perpetration of one type of offense is associated with perpetration of other types.
To conclude, the results show that women are involved in both violent and nonviolent offending behavior, shown across 10 criminal categories, 4 violent and 6 nonviolent. The prevalence rates demonstrate that women’s involvement is generally high and is above 50% for general violence, IPV, and nonviolent offenses. The correlations show that the same women are involved in a variety of offenses, as men are known to be. A medium strength relationship was found between IPV and general violence, and between both general violence and IPV and nonviolent offending. The prevalence results demonstrate a fair level of consistency across sources, except for some specific categories, for example, sex offenses, robbery, and all other offenses, for which we have provided explanations. Overall, this research suggests that women who commit IPV are likely to have a range of problematic behaviors and risk factors, and these all need to be addressed during interventions and in future research so that women can benefit from appropriate treatment. Future research could use a sample of men and women to investigate sex differences in offending and also in individual differences variables (Thornton et al., 2010b).
Footnotes
Appendix
The authors declared no potential conflicts of interest with respect to the research, authorship, and/or publication of this article.
The authors received no financial support for the research, authorship, and/or publication of this article.