



Abstract
Criminologists have long noted that offenders are more likely to be the victims of crime as compared to nonoffenders. What has not been established, however, is why there is a significant degree of victim–offender overlap. While numerous explanations have been advanced and a significant number of studies have been conducted, there remains much to be learned about the etiology of the victim–offender overlap. The current study pushes this line of research forward by offering and testing a unique hypothesis: that victimization and offending share a genetic etiology that leads to victim–offender overlap. Findings culled from a sample of sibling pairs drawn from the National Longitudinal Study of Adolescent Health indicated that genetic factors explained between 51% and 98% of the covariance between victims and offenders. Nonshared environmental factors explained the remaining covariance, while shared environmental factors explained none of the covariance. Implications and interpretations of these findings are considered.
One of the more replicated, yet least understood findings in the criminological literature is the strong and consistent association between criminal involvement and victimization (Broidy, Daday, Crandall, Skalar, & Jost, 2006; Lauritsen & Laub, 2007; Lauritsen, Sampson, & Laub, 1991). A relatively large body of empirical research, for example, has revealed that criminal offenders are much more likely to be victimized when compared with law-abiding citizens. This victim–offender overlap has been observed in multiple samples using very different statistical techniques. Against this empirical backdrop, there is little doubt that the nexus between victims and offenders is real and not attributable to a methodological artifact (though it is worth noting that recent research questions whether criminal involvement [victimization] is a cause of future victimization [criminal involvement]; see Ousey, Wilcox, & Fisher, 2011). What have remained elusive are the causal mechanisms that are ultimately responsible for producing covariation between victimization and offending (Lauritsen & Laub, 2007). Numerous explanations have been set forth or can be extrapolated from extant criminological theories (see Schreck, Stewart, & Osgood, 2008, for a thorough account of the various theoretical explanations). For the most part, however, these theoretical perspectives account for a relatively small proportion of the covariance between victimization and offending (Broidy et al., 2006; Klevens, Duque, & Ramirez, 2002). These findings indicate that there are other not-yet-identified factors that are salient to producing the overlap between victims and offenders (Ousey et al., 2011).
At this point, most of the “usual suspects” that are studied by criminologists and victimologists have been thoroughly examined. For instance, variables drawn from routine activities/lifestyles theories, such as exposure to delinquent peers, residing in a disadvantaged neighborhood, and use of drugs/alcohol have all been analyzed in relation to explaining the connection between victimization and offending (Averdijk, 2011; Berg & Loeber, 2012; Chen, 2009; Lauritsen et al., 1991; Lauritsen & Laub, 2007; Schreck & Fisher, 2004; Schreck, Fisher, & Miller, 2004). One group of variables that has yet to be considered in relation to the victim–offender overlap is genetic factors. This is a serious omission because in recent years there has been a surge of criminological research revealing that antisocial behaviors, such as violence and criminal involvement, are under genetic influence (Moffitt, Ross, & Raine, 2011). At the same time, studies have also been published indicating that victimization is partially driven by genetic variance (Beaver, Boutwell, Barnes, & Cooper, 2009; Beaver et al., 2007). Logically, then, it is quite possible that genetic factors are involved in explaining victim–offender overlap. No research has examined this topic to date. The current study addresses this gap in the literature and explores the potential role that genetic factors play in the production of victim–offender overlap.
Genetic Effects on Antisocial Behavior and Victimization
Before proceeding to a discussion of how shared genetic effects could account for victim–offender overlap, it is first essential to examine the genetic foundations to antisocial behaviors and victimization. If either antisocial behavior or victimization were not influenced by genetics, then it would not be possible for genes to explain the connection between offending and victimization. Note, however, that even if antisocial behavior and/or victimization are strongly influenced by genetics that does not necessarily translate into the covariation between the two being influenced by genetics. Similarly, if antisocial behavior and/or victimization are weakly influenced by genetics, the covariation between the two could still be largely the result of genetic factors (Neale & Cardon, 1992). Whether the victim–offender overlap is partially explained by genetics does, however, hinge on first establishing that both are affected by genetic effects to some extent.
Most of the research that estimates genetic effects on behaviors is produced using behavioral genetic research designs. Behavioral genetic research designs can take a variety of different forms, but the one that is used the most frequently is the twin-based research design (Plomin, DeFries, McClearn, & McGuffin, 2008). The twin-based research design is able to quantify the proportion of variance in a measure that is due to genetic and environmental effects by comparing the similarity of monozygotic (MZ) twins to the similarity of dizygotic (DZ) twins. MZ twins are genetic clones of each other, meaning that they share 100% of their DNA. DZ twins, in contrast, share 50% of their distinguishing DNA, making them just as similar to each other as regular biological siblings. As long as the environments between MZ twins are no more similar than the environments between DZ twins (known as the equal environments assumption [EEA]), then the only reason that MZ twins should be more similar to each other than DZ twins is because they share twice as much genetic material. The more similar MZ twins are in relation to DZ twins, the stronger the genetic effect is on the measure. In behavioral genetic terms, the proportion of variance explained by genetic factors is known as heritability.
A point frequently overlooked by criminologists is that behavioral genetic research designs do not just focus on genetic effects but also environmental effects. Unlike most criminological research, though, they make the distinction between two types of environments: shared environments and nonshared environments. Shared environments are environments that are the same between siblings and that make siblings more similar to each other. Nonshared environments are environments that are unique to each sibling and that make siblings different from each other. Statistically, the nonshared environmental component also includes the effects of error. Together, heritability, shared environmental effects, and nonshared environmental effects explain 100% of the variance in any measure that is being studied (Plomin et al., 2008).
A large body of behavioral genetic research has employed the twin-based research design to examine the genetic effects on a range of antisocial behaviors (Raine, 1993). The results of these studies, which have been summarized in a number of meta-analyses and exhaustive literature reviews, have indicated that about 50% of the variance in antisocial behaviors is the result of genetic variance (Ferguson, 2010; Moffitt, 2005; Moffitt et al., 2011; Rhee & Waldman, 2002). Most of the remaining variance, moreover, is accounted for by nonshared environmental effects, with the shared environment explaining between 0% and 10% of the variance. Importantly, these results have been generated across hundreds of studies, using different measures of antisocial behaviors, and using very different samples and thus the findings are unlikely to be explained away as a methodological or statistical artifact (Beaver, 2009).
In comparison with the studies devoted to estimating genetic effects on antisocial behaviors, much less research has examined the genetic underpinnings to victimization. The limited number of studies that do exist, however, indicate that victimization, like antisocial behavior, is influenced by genetic factors. For example, Hines and Saudino (2004) estimated the extent to which genetic factors were involved in being a victim of psychological aggression and physical aggression by an intimate partner. Their analysis indicated that 25% of the variance in being the recipient of psychological aggression was due to genetic factors and 15% of the variance in being the recipient of physical aggression was the result of genetic factors.
In another twin-based research design, Beaver et al. (2009) estimated genetic influences on adolescent victimization in a sample of twins drawn from the National Longitudinal Study of Adolescent Health (Add Health). The results of their genetically informative analysis revealed that between 40% and 45% of the variance in adolescent victimization was the result of genetic factors. The remaining variance was accounted for by nonshared environmental effects. Follow-up analyses also indicated that 64% of the variance in repeat victimization was due to genetic factors.
Additional evidence linking genes to victimization comes from the findings of two molecular genetic association studies. In the first study, Beaver et al. (2007) examined whether variants of a polymorphism in the DRD2 gene were associated with adolescent victimization. Their analysis of respondents drawn from the Add Health sample revealed that this gene was related to victimization for White males who had relatively little exposure to delinquent peers. In another study also using the Add Health data, Vaske, Wright, & Beaver (2011) reported that this same polymorphism in the DRD2 gene delineated between offenders who were violently victimized and offenders who were not violently victimized. Specifically, offenders who carried the A1 allele were significantly more likely to be violently victimized in comparison with offenders who carried a different variant of the DRD2 gene.
Genetic Explanations for Victim–Offender Overlap
The available evidence culled from genetically informative research designs indicates that both offending and victimization are influenced by genetic factors. Whether the covariation between victimization and offending is being driven by genetic factors remains an open-empirical question. Although no research has ever examined this possibility directly, there are at least three reasons to suspect that victim–offender overlap is affected by shared genetic factors. First, there is a good deal of evidence indicating that both criminal involvement and victimization are affected by lifestyle factors and routine activities (Maldonado-Molina, Jennings, Tobler, Piquero, & Canino, 2010; Miethe & Meier, 1994). While there is little debate among criminologists about this finding, there is also little research examining the factors that cause differential exposure to lifestyle factors and routine activities (Schreck & Fisher, 2004). In short, why are some people more likely to engage in routine activities that place them at risk for being victimized and becoming involved in crime? Some evidence indicates that personality traits may play a role—Scheck, Stewart, and Fisher (2006) reported that self-control was predictive of later delinquent peer exposure. While there are certainly myriad factors that would contribute to such differential exposure, one potential influential factor that has yet to be studied by criminologists is genetics.
Outside the field of criminology, there has been a tremendous amount of research devoted to examining whether genes are involved in creating environmental variation (Kendler & Baker, 2007). At first blush it might seem a bit odd to consider the possibility that environments are scripted, in part, by genetic factors. But, that is exactly what research has revealed. The way in which genetic effects on environmental measures are estimated is by employing behavioral genetic research designs, where variance in environmental measures, not in measures of behaviors/personalities, is decomposed (Plomin, Reiss, Hetherington, & Howe, 1994). The results of these studies have revealed statistically significant genetic effects on virtually every measurable environment, including some of those that fall under the rubric of lifestyle/routine activities, such as exposure to delinquent peers or residing in a disadvantaged environment (Kendler & Baker, 2007). As a result, if an environment such as residing in a disadvantaged neighborhood is related to both victimization and offending and that same environment is partially influenced by genetic factors, then it is possible that genes account for some of the covariation between victimization and offending.
The second reason to suspect that genetic factors might be partially responsible for victim–offender overlap is because of the findings flowing from individual-level research focusing on the etiology of both victimization and offending (Ousey et al., 2011). There is now a significant body of research revealing that individual-level factors, such as impulsivity, low levels of self-control, and neuroticism, are strongly connected to the development of antisocial behaviors and criminal involvement (Jones, Miller, & Lynam, in press; Pratt & Cullen, 2000). At the same time, a number of studies have emerged revealing that some of these same individual-level factors also are related to the odds of being victimized (Haynie & Piquero, 2006; Higgins, Jennings, Tewksbury, & Gibson, 2009; Stewart, Elifson, & Sterk, 2004). Schreck and colleagues, for instance, have conducted a number of studies linking low levels of self-control to victimization experiences (Schreck, 1999; Schreck, Wright, & Miller, 2002). Ousey et al. (2011) revealed that the impact of victimization on offending (and vice versa) was weakened when observed measures of impulsivity, social bonds, and differential association with peers were included in their fixed effects regression models. These findings strongly suggest that victimization and offending may share common etiological factors that are tied to individual-level traits.
Behavioral genetic research has a long history of examining the genetic effects on virtually every imaginable individual-level trait. The overarching consensus that is supported by mounds upon mounds of empirical research is that individual-level traits are highly heritable, with most heritability estimates ranging between .50 and .80 (Plomin et al., 2008; Rutter, 2006). These findings implicating genetic factors in the etiology of individual-level traits also spillover to some traits that have been found to affect both victimization and offending. To illustrate, a number of studies have shown that variance in measures of low self-control is explained, in large part, by genetic factors (Barkley, 1997). A relatively recent study by Beaver, Wright, DeLisi, and Vaughn (2008) revealed that between 52% and 64% of the variance in low self-control was the result of genetic factors. Taken together, the above evidence indicates that victimization and offending may be produced by some shared individual-level traits and that variance in these shared individual-level traits is influenced by genetic factors (see Boisvert, Wright, Knopik, & Vaske, in press). Based on these findings, it is logically possible that genes account for part of the victim–offender overlap via genetic effects on individual-level personality traits.
The third key way in which genetic factors could be involved in the overlap between victimization and offending is through an indirect causal pathway between crime involvement and victimization. This explanation is grounded in research indicating that criminal involvement may actually be causing victimization. Wolfgang’s (1957, 1958) research on victim-precipitated homicide is particularly relevant. Wolfgang’s research revealed that murder victims frequently engaged in illegal actions that ultimately caused their own victimization (see also Broidy et al., 2006; Luckenbill, 1977). What is of particular relevance is that prior research has found that involvement in crime, especially violent types of crimes, is affected by genetic and biological factors (Ferguson & Beaver, 2009; Moffitt et al., 2011; Raine, 1993; Rhee & Waldman, 2002). Given that genes are antecedent to behaviors, it stands to reason that genetic variance accounts for variance in measures of crime (not vice versa). And, if crime is a cause of victimization, then the cause of victimization can ultimately be tied to the same genes that are partially responsible for criminal involvement. No research has directly studied this possibility, but the results from multiple lines of research do stack up to suggest that the victim–offender overlap could be caused partially by genetic tendencies for criminal involvement.
The Current Study
Extant research has consistently revealed a significant overlap between victims and offenders, but the precise reasons that account for this overlap have remained elusive (Lauritsen & Laub, 2007). The current study partially addresses this gap in the literature by examining two intertwined issues. First, and consistent with previous research, we examine the degree of overlap between delinquency and victimization at two different time periods in adolescence. Second, we estimate the degree of overlap between delinquency and victimization that is the result of common genetic factors, common shared environmental factors, and common nonshared environmental factors. Here, the term common denotes an effect that is shared between two outcomes (i.e., delinquency and victimization). To do so, we analyze data drawn from a sample of sibling pairs and estimate a series of bivariate Cholesky decomposition models.
Method
Data
Data for this study came from the National Longitudinal Study of Adolescent Health (Add Health; Harris, 2009). The Add Health is a longitudinal and nationally representative sample of adolescents who were enrolled in Grades 7 through 12 during the 1994-1995 school year. Identifying youth to be interviewed progressed in a series of steps. To begin, 132 schools were identified using stratified random sampling techniques. Next, all students in these schools were administered a self-report survey during a designated class session, netting information from more than 90,000 students. These respondents formed the basis and the sampling frame for the next stage of the study: the in-home interviews. The in-home interviews—which were more extensive and covered a wider variety of topics than the in-school surveys—were administered to a subsample of the original 90,000 respondents. Specifically, beginning in April 1995, interviews with 20,745 adolescents were conducted in the adolescent’s home (i.e., Wave 1). These interviews covered various sensitive topics including the respondent’s involvement in delinquent behavior and the respondent’s victimization experiences (Harris, Halpern, Smolen, & Haberstick, 2006).
Approximately 1 year after the Wave 1 in-home interviews were completed, 14,738 respondents completed a second round of in-home interviews (i.e., Wave 2). Most respondents were still in their teenage years during Wave 2 allowing the Add Health researchers to leave the in-home questionnaire largely unchanged from Wave 1. Questions regarding background information that is invariant over time, however, were removed from Wave 2 interviews. Importantly, respondents were again asked to report on their delinquent behavior and victimization experiences that had recently taken place.
A unique feature of the Add Health data is that a subsample of sibling pairs residing in the same household at Wave 1 was included (Harris et al., 2006). During Wave 1 interviews, respondents who lived with an identical twin (i.e., monozygotic [MZ]), a fraternal twin (i.e., dizygotic [DZ]), a half-sibling, or a step-sibling were selected with certainty (Rowe & Jacobson, 1998). Other sibling pairs entered the sample probabilistically. This process of identifying sibling pairs led to the interviewing of more than 3,000 siblings. However, the sibling subsample was compiled in a fashion that allowed more than one pair of siblings to be included per household. To eliminate any biases stemming from the inclusion of multiple sibling pairs per household, the current study restricted the sample to two children per home. Employing a semistructured selection method—wherein all MZ and DZ twins were selected with certainty and other sibling pairs were selected at a rate to ensure sample sizes large enough to perform multivariate modeling—produced a sample of 2,267 sibling pairs. The final analytic sample consisted of 289 MZ twin pairs, 450 DZ twin pairs, 1,036 full-sibling (FS) pairs, 358 half-sibling (HS) pairs, and 134 cousin pairs.
Measures
Delinquency at Wave 1
During Wave 1 interviews respondents were asked to report on their involvement in various forms of delinquent behavior. Specifically, respondents were asked whether and how often they had taken part in 17 different delinquent and criminal activities. A wide spectrum of behaviors was covered, ranging from minor acts such as stealing something worth less than US$50 to more serious acts such as stealing cars. Responses to most of the questions were coded as follows: 0 = never, 1 = one or two times, 2 = three or four times, and 3 = five or more times. Two questions asked whether the youth had carried a weapon to school and whether he or she had used a weapon in a fight. These items were coded dichotomously where 0 indicated that the event had not occurred and 1 indicated that the event had occurred. Principal component analysis indicated that a single latent construct best explained the correlation structure of the 17 items. As a result, a delinquency scale was created by summing the responses to all 17 items (α = .85). Higher values indicated more involvement in delinquency. Approximately 20% of the sample was coded as 0 and 95% ranged between 0 and 16. These measures have been used previously to tap delinquent behavior (Haynie, 2001).
Delinquency at Wave 2
Delinquent behaviors were also measured at Wave 2. Since most respondents were still adolescents during Wave 2 interviews, all of the questions tapping delinquent behaviors remained the same. Respondents were again asked to indicate whether and how often they had been involved in activities such as painting graffiti, damaging property, and committing armed robbery. Respondents were asked to report the frequency of these behaviors over the past 12 months and the questions were coded on a scale ranging from 0 to 3 (0 = never, 1 = one or two times, 2 = three or four times, and 3 = five or more times). The questions that asked about taking a weapon to school and using a weapon in a fight were again coded dichotomously (0 = no, 1 = yes). Principal component analysis indicated that all 17 items loaded onto a single construct, justifying the creation of a Wave 2 delinquency scale by summing the responses to each item (α = .82). As with the Wave 1 delinquency scale, higher values reflected more involvement in delinquency. Roughly 30% of the sample scored a 0 and 95% fell between 0 and 12. Prior researchers have analyzed these same items (Haynie, 2003). 1
Victimization at Wave 1
During Wave 1 interviews respondents were asked a series of questions about the frequency with which they were victimized in the past year. Specifically, respondents were asked how many times in the past 12 months they had a knife or gun pulled on them, they had been shot, they had been cut or stabbed, and they had been jumped. In addition, youth were asked about vicarious victimization experiences; respondents were asked how many times they had seen someone shot or stabbed. The six items were coded so that 0 = never, 1 = once, and 2 = more than once. Results from principal component analysis justified combining the items into one scale, thus they were summed together to create the Wave 1 victimization scale (α = .68) where higher values indicated more victimization experiences. These measures have been used previously to analyze victimization experiences (Haynie & Piquero, 2006; Schreck et al., 2008). A majority of the participants (~75%) received a score of 0 and the 95th percentile score was 3.
Victimization at Wave 2
Respondents were also asked about the frequency with which they were victimized in the past year during Wave 2 interviews. Similar to Wave 1, youth were asked how often they had a knife or gun pulled on them, they had been shot, they had been cut or stabbed, they had been jumped, and they had seen someone shot or stabbed (0 = never, 1 = once, and 2 = more than once). Guided by the results of principal component analysis, responses to these items were summed together to create the Wave 2 victimization scale (α = .68). Higher values indicated more victimization. Approximately 80% of the sample received a score of 0. The 95th percentile score was 2. This scale has been used previously by scholars analyzing the Add Health data (Beaver et al., 2009).
Analysis Plan
There were two stages to the analysis. The first stage involved estimating the degree of overlap between the various delinquency and victimization scales. To do so, a correlation matrix was estimated. These relationships were examined at the bivariate level, meaning that the influence of covariates was not partialled out of the associations. Since the purpose of this first step was to establish a relationship between delinquent behavior and victimization experiences, it was unnecessary to control for outside influences. The findings from this stage of the analysis paved the way for the second stage.
The second stage to the analysis was to determine how much of the covariation (i.e., correlation) between the delinquency and victimization scales was due to common genetic (h2), common shared environmental (c2), and common nonshared environmental (e2) influences. Two analytic approaches were employed to analyze the genetic and environmental influences on victim–offender overlap. The first step was to examine cross-sibling, cross-trait correlations (rCC). rCCs analyze the degree to which one sibling’s score on a measure, say delinquency, correlates with his or her cosibling’s score on a different measure (e.g., victimization). Thus there were four sets of rCCs to be analyzed: Sibling 1’s Wave 1 delinquency and Sibling 2’s Wave 1 victimization, Sibling 1’s Wave 1 victimization and Sibling 2’s Wave 2 delinquency, Sibling 1’s Wave 2 delinquency and Sibling 2’s Wave 2 victimization, and Sibling 1’s Wave 2 victimization and Sibling 2’s Wave 1 delinquency (siblings were randomly assigned as Sibling 1 or Sibling 2 so it was unnecessary to reverse the sibling order and reestimate rCCs).
To understand how rCCs can be used to garner information about genetic and environmental influences it is important to recall that MZ twins share 100% of their DNA; DZ twins and full siblings share 50% of their distinguishing DNA; half-siblings share 25% of their distinguishing DNA; and cousins share 12.5% of their distinguishing DNA (Plomin et al., 2008). To the extent that the rCCs revealed that MZ twins correlated higher than DZ twins and full siblings, DZ twins and full siblings correlated higher than half-siblings, and half-siblings correlated higher than cousins (i.e., MZ>DZ & FS>HS>cousins), genetic influences on victim–offender overlap could be inferred.
Though the rCCs are useful in determining whether genetic and environmental factors are operative, they do not tell us how much each factor influences victim–offender overlap. Thus the second step was to garner estimates of the proportion of covariance between victimization and delinquency that was due to genetic and environmental factors operating on both outcomes (i.e., common genetic and common environmental influences). This step of the analysis was carried out by estimating the bivariate Cholesky decomposition model (Neale & Maes, 2004). A graphical depiction of the Cholesky model is presented in Figure 1.
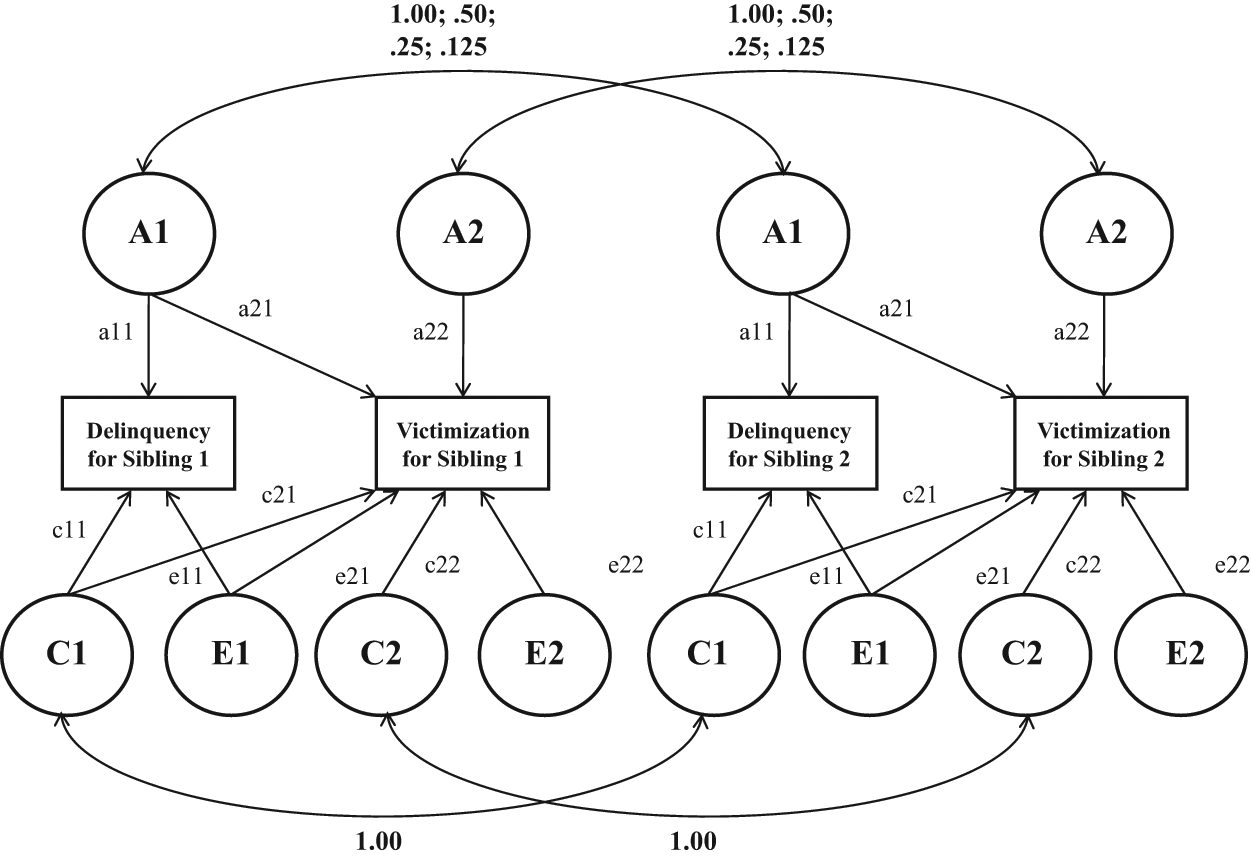
Diagram of the Bivariate Cholesky Model
Three elements of the Cholesky model warrant attention. First, the model contains two observed variables per sibling. Specifically, the model includes measures of delinquent behavior and victimization experiences for Sibling 1 and for Sibling 2. Second, notice that A, C, and E are estimated as latent factors that explain the variance in the measures of interest. The A factor captures genetic effects, the C factor captures shared environmental effects (environments that make siblings similar to one another), and the E factor captures nonshared environmental effects (environments that make siblings differ from one another). Third, there are two versions of A, C, and E. Some factors have a 1 while others have a 2. For the present efforts, the factors with a 1 were the primary focus since factors A1, C1, and E1 are used to generate estimates of the genetic and environmental influences on the correlation between the two measures. For instance, A1 is used to garner an estimate of the amount of genetic influence that is common to both delinquency and victimization.
In the Cholesky analyses presented below, the best-fitting model is always presented. Also, it may be important to control for sex and age effects when analyzing victim–offender overlap (Ousey et al., 2011). These effects were accounted for by first regressing the four outcome variables (i.e., Wave 1 delinquency, Wave 2 delinquency, Wave 1 victimization, and Wave 2 victimization) on participant sex and age. Next, residual scores from these regression models were saved and used as the observed scores in the Cholesky models. It is important to note that the substantive conclusions were identical when the original (i.e., not residualized) variables were analyzed.
Findings
Presented in Table 1 are summary statistics and the bivariate correlation coefficients for each of the different combinations of the delinquency and victimization scales. A quick glance at the table reveals that all of the relationships were positive and statistically significant at the conventional .05 (two-tailed) alpha level. In other words, respondents who were more involved in delinquent activity reported more victimization experiences and vice versa. Beginning with the coefficients presented in column 4, the Wave 1 delinquency variable correlated significantly with both Wave 1 (r = .51) and Wave 2 victimization (r = .35). The findings in column 5 revealed that Wave 2 delinquency correlated significantly with Wave 1 victimization (r = .29). Finally, column 6 showed that Wave 2 delinquency was significantly associated with Wave 2 victimization experiences (r = .45). In brief, the findings from Table 1 fall in line with the substantial literature that has linked delinquent behavior with victimization experiences. Regardless of whether the relationship is considered cross-sectionally or longitudinally, the victim–offender overlap is observable.
Correlation Matrix Revealing Victim–Offender Overlap

p < .05, two-tailed.
Cross-sibling, cross-trait correlations (rCC) are presented in Table 2. As explained above, genetic influences on victim–offender overlap can be inferred to the extent that these correlations are higher for siblings that share more genetic material (i.e., MZ>DZ & FS>HS>cousins). Table 2 shows that this pattern of findings emerged, with two exceptions, across each of the different combinations. For example, the rCC for Wave 2 delinquency and Wave 2 victimization revealed that MZ twins correlated higher (r = .23) than did DZ twins and full siblings (r = .12), DZ twins and full siblings correlated higher than half-siblings (r = .09), and half-siblings correlated higher than cousins (r = .004). The two exceptions concerned the correlations between cousins; the rCC for cousins was higher than the rCC for half-siblings for Wave 1 delinquency/Wave 1 victimization and for Wave 2 victimization/Wave 1 delinquency.
Cross-Sibling, Cross-Trait Correlations (rCC)
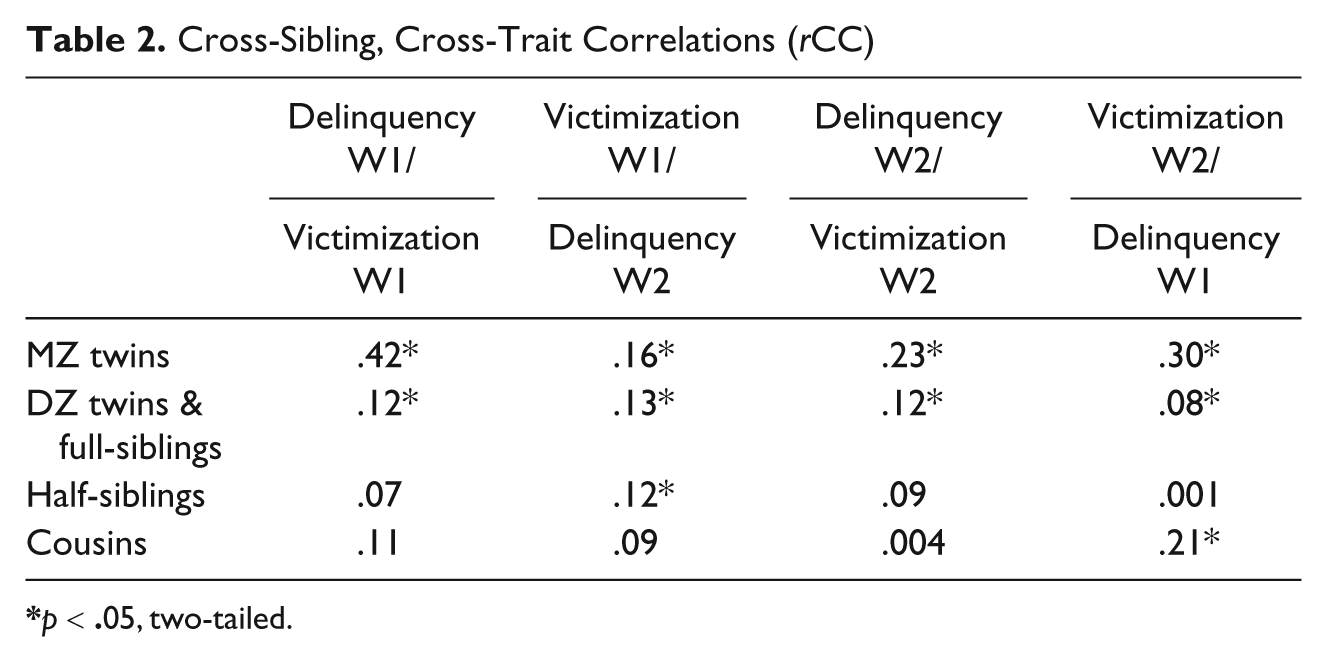
p < .05, two-tailed.
The final step in the analysis was to estimate the extent to which genetic and environmental factors accounted for the victim–offender overlap. The results of the bivariate Cholesky decomposition models are summarized in Table 3. Four different models were estimated: two cross-sectional models and two longitudinal models. As can be seen, genetic factors explained a significant amount of the victim–offender overlap in all four of the equations. Specifically, genetic factors explained 54% of the covariance between Wave 1 delinquency and Wave 1 victimization, 98% of the covariance between Wave 1 victimization and Wave 2 delinquency, 51% of the covariance between Wave 2 delinquency and Wave 2 victimization, and 71% of the covariance between Wave 2 victimization and Wave 1 delinquency. The remaining amount of covariance was attributable to nonshared environmental effects. In all four of the models, shared environmental factors explained none (0%) of the covariance. 2
Cholesky Parameter Estimates for the Covariation Between Delinquency and Victimization
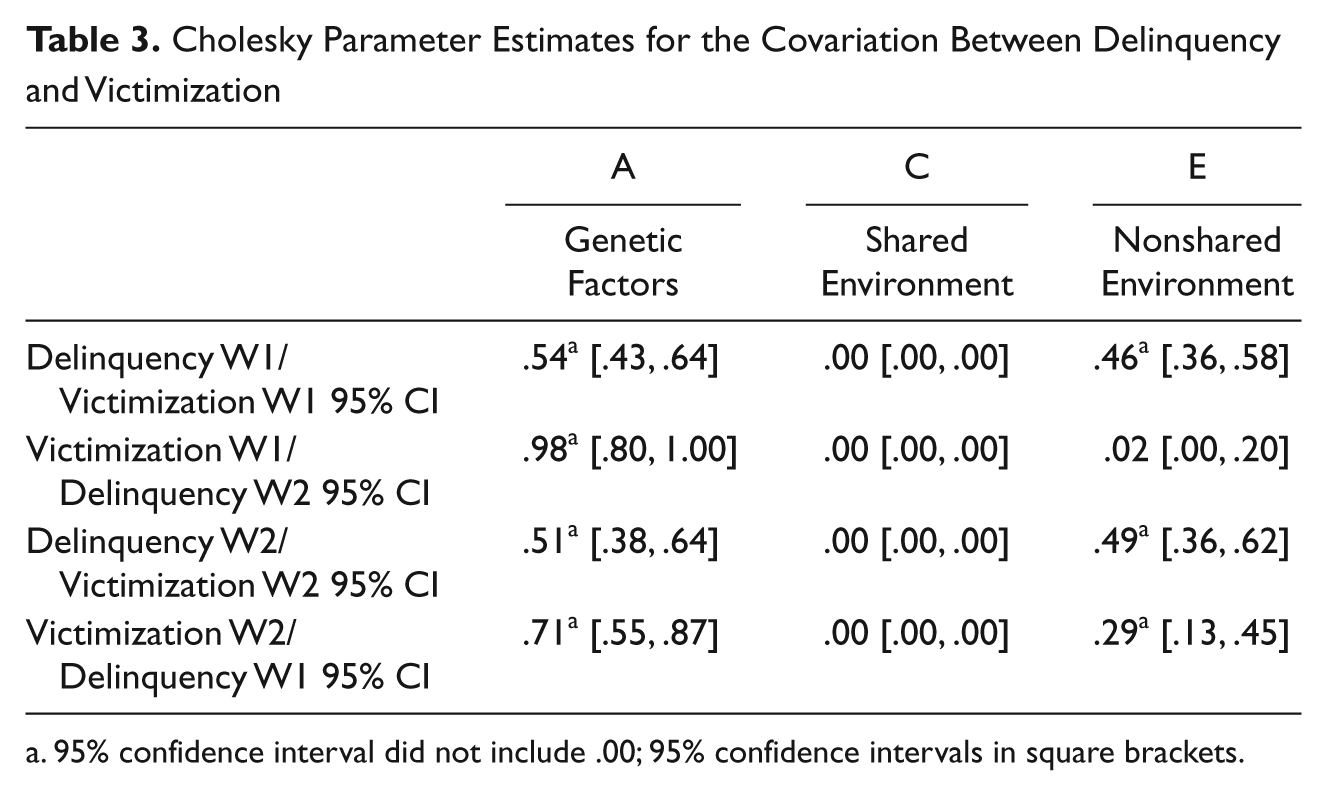
95% confidence interval did not include .00; 95% confidence intervals in square brackets.
Discussion
A substantial knowledge base has revealed that offenders run a high risk of being victimized (Broidy et al., 2006; Lauritsen et al., 1991; Lauritsen & Laub, 2007). Theoretical and empirical insight has suggested that victim–offender overlap results from routine activity effects, neighborhood factors, peer influences, as well as individual-level personality traits (Maldonado-Molina et al., 2010; Miethe & Meier, 1994; Ousey et al., 2011; Schreck, 1999; Schreck et al., 2002; Schreck, Stewart, & Fisher, 2006). Though viable explanations, the empirical tests stemming from these hypotheses have revealed that much of the covariation in victim–offender overlap remains unexplained. Furthermore, identifying the covariation between factors such as personality traits and victimization/offending may not get to the root cause of victim–offender overlap. Put differently, research has shown that levels of self-control predict victimization (e.g., Schreck, 1999) and offending (Pratt & Cullen, 2000), but these studies were unable to determine whether the relationship is causal or due to a shared etiology. The current study addressed this gap in the literature by proposing and testing an alternative explanation tying genetic factors to the well-known association between victims and offenders. The findings presented herein provide some of the most powerful evidence concerning the etiology of the victim–offender overlap to date.
The contributions of the current study are twofold. First, the current study makes a methodological contribution to the criminological literature on victim–offender overlap. To date, research into this phenomenon has relied exclusively on methodological techniques that do not allow for the estimation of the genetic influence on offending, victimization, or victim–offender overlap. The current study offers an example of how behavioral genetic techniques can be used to estimate whether and to what degree genetic and environmental factors contribute to the covariance between two measures.
The second contribution of this study is a substantive one. Specifically, the results revealed two important findings. First, between 51% and 98% of the covariance in victim–offender overlap resulted from genetic factors that are operating on both outcomes (i.e., common genetic factors). In other words, the findings suggest that victim–offender overlap is largely the result of a shared genetic etiology between victimization and delinquency. This finding deserves attention, especially in regard to understanding how genetic factors might influence complex outcomes such as victim–offender overlap. One explanation, as outlined above, is that genetic influences on victim–offender overlap may be mediated by personality traits. An individual’s level of self-control is predictive of both victimization experiences (Schreck, 1999) and delinquency (Pratt & Cullen, 2000). Since self-control is partially scripted by genetic factors (Wright & Beaver, 2005), the genetic influences on victim–offender overlap may work through this personality trait.
An alternative, and equally plausible, explanation is that genetic factors play a role in environmental exposures and that these environments contribute to the victim–offender overlap. Research has indicated that genetic factors influence a person’s decision to live in certain neighborhoods (Rowe & Rodgers, 1997). Thus if a neighborhood affects a person’s delinquent behavior and his or her likelihood of being victimized (see, generally Anderson, 1999), a genetic component to victim–offender overlap might be expected.
The second key finding to emerge from this study was that the nonshared environment explained a significant portion of the correlation between delinquency and victimization experiences. Recall that the nonshared environment operates to make siblings less similar. The significant effect of the nonshared environment certainly is an interesting one and should be the focus of future research. Although the current study was not designed to unpack the factors that account for nonshared variance, note that this finding is compatible with some of the more dominant theories used to explain the victim–offender overlap. For example, lifestyle factors/routine activities would capture a significant amount of nonshared variance, wherein one sibling may engage in routine activities that their cosibling does not. Exposure to antisocial peers, moreover, is a known risk factor for both offending and victimization and behavioral genetic research has shown that peer groups represent a salient nonshared environment (Barnes, Boutwell, & Fox, in press; Beaver, 2008). Levels of self-control, too, may represent an important source of nonshared variance. It would be interesting and important to blend together a genetically sensitive research design with tests of extant theories to create an interdisciplinary explanation to the victim–offender overlap. This type of theoretical integration has been shown to be particularly useful among biosocial criminologists (Walsh, 2002).
Policy implications are important to consider when discussing the victim–offender overlap. To the extent that involvement in delinquency raises victimization likelihood, an obvious implication from both a criminal justice and public health standpoint is that researchers should attempt to reduce criminal activity. This implication is supported by the current results. To the extent that behavioral scientists can unpack the factors that promote the development of antisocial behavior, victimization rates are likely to be affected similarly. At this point, biosocial research such as that presented here is too premature to suggest policies based on genetic information. Note, however, that the nonshared environment emerged as a salient factor underlying victim–offender overlap. To the extent that biosocial research can identify specific nonshared environmental influences (see, for example, Barnes et al., in press), much clearer policy implications will begin to emerge.
Limitations of the study must be addressed. First, while an extensive list of delinquent behaviors were measured by the Add Health researchers there was a comparatively smaller list of victimization experiences that were measured. Indeed, 17 questions tapping involvement in delinquency were included, compared to only 6 questions tapping victimization experiences (for Wave 1; there were only 5 at Wave 2). This leaves open the possibility that certain types of victimization were not covered and, therefore, victims of crime were erroneously coded as nonvictims. 3 This type of classification error will tend to inflate the nonshared environmental component in behavioral genetic analyses and perhaps even attenuate genetic effects. As such, the results reported here in respect to genetic influences on the victim–offender overlap should be viewed as conservative lower-bound estimates.
A second limitation has roots in behavioral genetic research methods. These methods are very informative and represent a first step to unpacking the etiology of criminological phenomena. Unfortunately, behavioral genetic methods are unable to identify which genes and which environments are influential. In addition, gene–environment interactions are difficult to unpack with behavior genetic modeling. It may be possible that certain genetic “risk factors” are only viable when teamed with environmental risk (known as gene–environment interaction [Purcell, 2002]). The next step is to determine which specific genes and which specific nonshared environments are operating on both outcomes. To answer this question, future research must use alternative methodologies that allow for the examination of molecular genetic data (e.g., Vaske et al., 2011) and specific nonshared environments (e.g., Beaver, 2008). A final limitation to note is that some of the delinquency-victimization correlations may have been inflated due to a high proportion of zeros on some of the scales. While this may have inflated the correlation between some of the delinquency and victimization scales, it is unclear exactly how (and if) this affected the Cholesky results. 4
In summary, this study is the first to analyze victim–offender overlap by using a genetically informed methodology. Results revealed that a substantial portion of the correlation between delinquent involvement and victimization experiences is due to genetic factors that are shared by both outcomes (i.e., common genetic influences). At the same time, the current results highlighted the importance of the nonshared environment in explaining the victim–offender overlap. It is our hope that the current findings will pave new avenues for research that ultimately unpacks and specifies the causal pathways that culminate in victim–offender overlap.
Footnotes
Acknowledgements
Special acknowledgment is due to Ronald R. Rindfuss and Barbara Entwisle for assistance in the original design. Information on how to obtain the Add Health data files is available on the Add Health web site ( ). This research uses data from Add Health, a program project directed by Kathleen Mullan Harris and designed by J. Richard Udry, Peter S. Bearman, and Kathleen Mullan Harris at the University of North Carolina at Chapel Hill, and funded by grant P01-HD31921 from the Eunice Kennedy Shriver National Institute of Child Health and Human Development, with cooperative funding from 23 other federal agencies and foundations. No direct support was received from grant P01-HD31921 for this analysis.
Declaration of Conflicting Interests
The authors declared no potential conflicts of interest with respect to the research, authorship, and/or publication of this article.
Funding
The authors received no financial support for the research, authorship, and/or publication of this article.