
Abstract
This study examined the overlap in teen dating violence and bullying perpetration and victimization, with regard to acts of physical violence, psychological abuse, and—for the first time ever—digitally perpetrated cyber abuse. A total of 5,647 youth (51% female, 74% White) from 10 schools participated in a cross-sectional anonymous survey. Results indicated substantial co-occurrence of all types of teen dating violence and bullying. Youth who perpetrated and/or experienced physical, psychological, and cyber bullying were likely to have also perpetrated/experienced physical and sexual dating violence, and psychological and cyber dating abuse.
Introduction
Teens’ experiences with dating violence and bullying have often been studied separately, but seldom together, with two studies to date empirically examining their co-occurrence. Miller and colleagues (2013) classified a sample of nearly 800 middle school students (50% female, 27% White) into groups based on their experiences, as perpetrators and as victims, with physical dating violence, psychological dating violence, sexual harassment, and bullying. They identified one group of youth (12% of the sample) who exhibited strong co-occurrence of all problem behaviors, including victimization and perpetration of physical and psychological dating violence, bullying, and sexual harassment. They found another group (24% of the sample) who showed little to no problem behaviors. Similarly, Espelage and Holt (2007) examined a sample of 684 middle and high school youth (53% female, 61% White) and found that physical dating violence, emotional abuse, and sexual harassment victimizations were significantly highest among those who both bullied and were victimized by peers and least among those uninvolved in peer bullying/victimization.
This study aims to add further information to this knowledge base by identifying the specific co-occurrence rates of dating violence and bullying with regard to acts of physical and sexual violence, psychological abuse, and—for the first time ever—digitally perpetrated cyber abuse. Technology (e.g., texting via cellphones, social media) has become another tool in the toolbox of potential perpetrators in this modern, digital age.
Our analysis is guided by three, empirically focused research questions. First, how likely is dating violence for youth who engage in or experience bullying? Second, how strong is the association between teen dating violence and bullying? Third, what are the specific co-occurrence rates of teen dating violence and bullying with regard to victimization, perpetration, and reports of both perpetration and victimization?
Method
Design
The design of this study consisted of a large-scale, cross-sectional survey of 7th- to 12th-grade youth in 10 schools in rural New York (3 high schools, 2 middle schools), urban Pennsylvania (3 high schools), and suburban New Jersey (2 high schools). Participating students anonymously completed the survey via paper-pencil format. A two-stage consent process was approved by the Urban Institute’s Institutional Review Board, which included passive parental consent and informed assent for students. 1 The survey was conducted on a single day and included the census of youth attending school that day. On completion of the survey, each student was given contact information for local service providers and national hotlines.
Sample
The final sample included a total of 5,647 surveys, which represents an overall response rate of 84%. Fifty-one percent of the sample identified as female, 94% identified as heterosexual, 89% were in high school, 81% were ages 14 to 17, 75% identified as White/Caucasian, and 67% reported living with both parents. For additional details on the study’s design and sample, see Zweig, Dank, Yahner, and Lachman (2013).
Measures
Teen dating violence and abuse
Of the 5,647 youth who completed valid surveys, two thirds reported currently being in a dating relationship or having been in one during the prior year. These youth were asked questions about dating violence in the prior year, whereas youth who did not report being in a current or recent relationship and who appropriately skipped over the dating violence questions were coded as not having experienced dating violence during the prior year.
Physical dating violence in the prior year was assessed using a 14-item scale developed and validated by Foshee (1996) for both victimization (α = .896) and perpetration (α = .888). Item examples include scratching, slapping, twisting arms, slamming or holding someone against walls, choking, and hitting with a fist.
Psychological dating abuse was based on measures adapted from the Michigan Department of Community Health’s (MCH; 1997) Control and Fear Scales, as well as Foshee’s (1996) Psychological Abuse Scale. These questions did not distinguish between psychological abuse that had occurred in person and that which might have occurred via technology, although they were originally developed without the technological aspect being a part of youth’s lives as it is today. All 21 items were asked for both victimization experiences (α = .897) and perpetration behaviors (α = .897). Examples include damaging something that belonged to the partner, threatening to hurt the partner, not letting the partner do things with others, trying to limit contact with family and friends, insulting partners in front of friends, and making the partner feel unsafe or uneasy when they spent time alone together.
Sexual coercion was an additional measure developed using two items from Foshee’s (1996) Physical Abuse Scale (being forced to have sex and forced to do sexual things that person did not want to), one item from Zweig, Barber, and Eccles (1997; being pressured to have sex), and one additional item from Zweig, Sayer, Crockett, and Vicary (2002; having sexual intercourse when the person did not want to; only included in the victimization measure). Measures of internal consistency were α = .737 for victimization and α = .723 for perpetration.
Cyber dating abuse was measured by 16 questions, 6 of which were adapted from Picard (2007) and 10 of which were created for the current study; however, we also examined a cyber bullying measure (Griezel, 2007) and adapted several items from that work. All 16 questions were asked twice to capture both victimization (α = .907) and perpetration (α = .944) experiences. Item examples include pressuring partners to send sexual or naked photos of themselves, sending threatening text messages to partners, sending partners so many messages (texts, emails, chats) that they felt unsafe, and writing nasty things about a partner on his or her profile page (e.g., on Facebook or MySpace).
Bullying
All respondents, regardless of their relationship status, were also asked questions about violent experiences involving peers with whom they had not been romantically involved. These questions were used to measure three types of bullying victimization and perpetration in the prior year: physical bullying, psychological bullying, and cyber bullying.
The physical bullying measure included six items adapted from Parada (2000) for both victimization (α = .848) and perpetration (α = .872). Item examples include pushing and shoving, hitting and kicking, throwing something to hit, and being physically threatened with hurt or harm. Psychological bullying was also based on measures (11 items) adapted from Parada (2000) and previously used in Griezel (2007). As with psychological dating abuse, items did not distinguish between psychological abuse that occurred in person and that via technology. Similar versions of all 11 items were asked for both victimization experiences (α = .915) and perpetration behaviors (α = .903). Examples include making someone feel afraid in school, teasing or calling another student mean names, getting other students to ignore or turn against someone, and intentionally leaving another student out of activities and games.
The cyber bullying measure (12 items) was adapted from Griezel (2007), with some minor edits to item language (e.g., used the phrase “cell phone” in lieu of “mobile phone”). Measures of internal consistency were α = .898 for victimization and α = .974 for perpetration. Item examples include sending a student a nasty or threatening email; sending a student an instant message, chat, or text to hurt his or her feelings; and writing things about a student on a profile page (such as MySpace or YouTube) to hurt his or her feelings.
Results
As shown in Table 1, 25% reported dating violence perpetration and 41% victimization; whereas 43% and 57% reported bullying perpetration and victimization, respectively. The highest rates of abuse across all categories were those involving psychological harm, followed by physical violence. About 1 in 6 youth reported experiencing cyber dating abuse, the same share who reported cyber bullying victimization, whereas 1 in 12 youth reported perpetrating each of cyber dating abuse and cyber bullying.
Prevalence of Teen Dating Violence and Bullying (N = 5,647).

Note. Valid, non-missing data for measures in this table ranged from 89% to 96% of the respondents.
Table 2 shows the percent of each type of teen dating violence by whether youth engaged in or experienced bullying behavior. Youth who reported perpetrating any, physical, psychological, and/or cyber bullying were approximately twice as likely to also report perpetrating dating violence or abuse. Youth who reported experiences of bullying victimization were about 1.5 times as likely to also report dating violence victimizations.
Percentage of Teen Dating Violence by Youths’ Bullying Behavior (%).

Note. Valid, non-missing data on cross-tabulations of perpetration behaviors were present for 84% to 86% of the respondents.
Chi-squared for cross-tabulation with any bullying perpetration is significant at p < .001.
Chi-squared for cross-tabulation with physical bullying perpetration is significant at p < .001.
Chi-squared for cross-tabulation with psychological bullying perpetration is significant at p < .001.
Chi-squared for cross-tabulation with cyber bullying perpetration is significant at p < .001.
In Table 3, we show Kendall’s tau for each pairing of teen dating violence and bullying experiences. Coefficients less than .10 indicate a weak relationship; .10 to .19 indicate a moderate relationship; .20 to .29 indicate a moderately strong relationship; and .30 and higher indicate a strong relationship (Pollock, 2011). All but one of the associations indicate at least a moderate association between teen dating violence and bullying, with regard to both perpetration and victimization experiences, and several indicate moderately strong relationships.
Kendall’s Rank Correlation of Teen Dating Violence and Bullying.
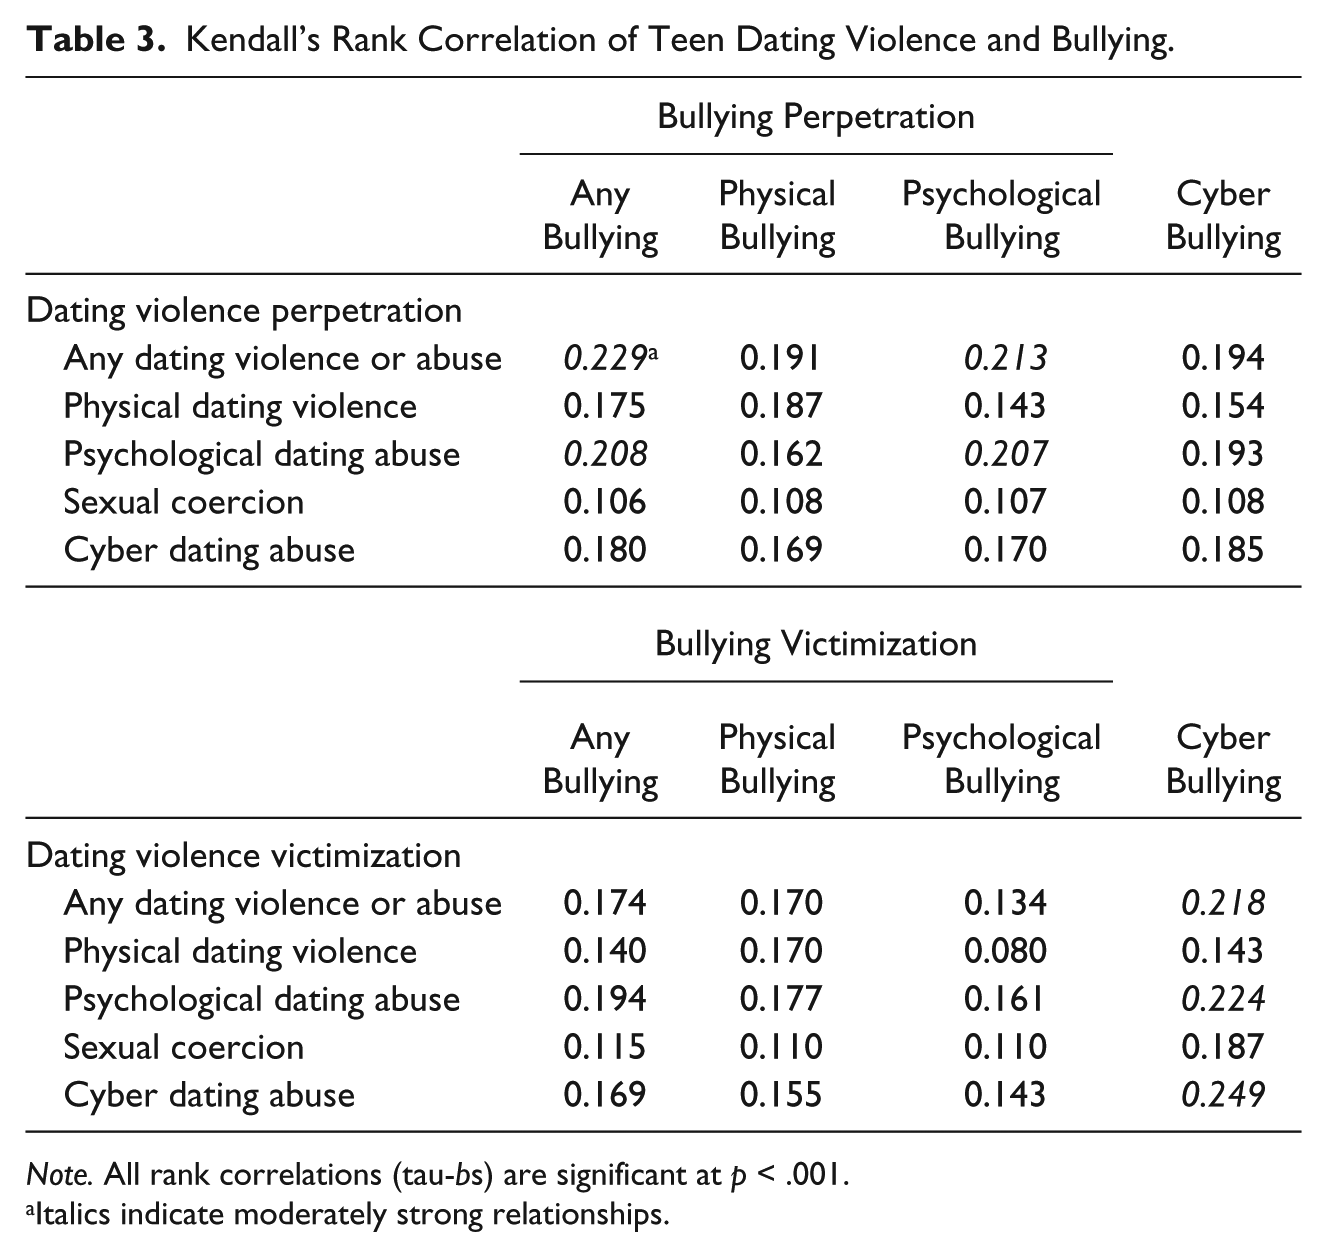
Note. All rank correlations (tau-bs) are significant at p < .001.
Italics indicate moderately strong relationships.
Last, we identify the overall co-occurrence rates of teen dating violence and bullying experiences. Toward this end, we followed work by prior researchers (e.g., Espelage & Holt, 2007) and classified youth according to their joint perpetration and victimization experiences regarding the two behaviors. For example, youth who reported being bullied and being victimized by bullying were classified as “bully-victims” and so forth. A quarter of the surveyed youth were completely uninvolved in teen dating violence and bullying (Table 4), whereas 44% were involved in either dating violence or bullying but not both (sum the percentages of 13.4, 4.9, and 15.2 for those involved in bullying but not dating violence, and 5.5, 0.5, and 4.0 for those involved in dating violence but not bullying). The remaining third of youth (32%) experienced some type of teen dating violence and bullying co-occurrence. One in 8 youth (13%) experienced the full gamut of dating violence and bullying—as both perpetrators and victims of each. One in 10 youth (10%) reported being perpetrators and victims of either dating violence or bullying, and victims but not perpetrators of the other behavior. Four percent of youth reported being victims (and not perpetrators) of both dating violence and bullying.
Co-Occurrence Rates of Teen Dating Violence and Bullying (%).
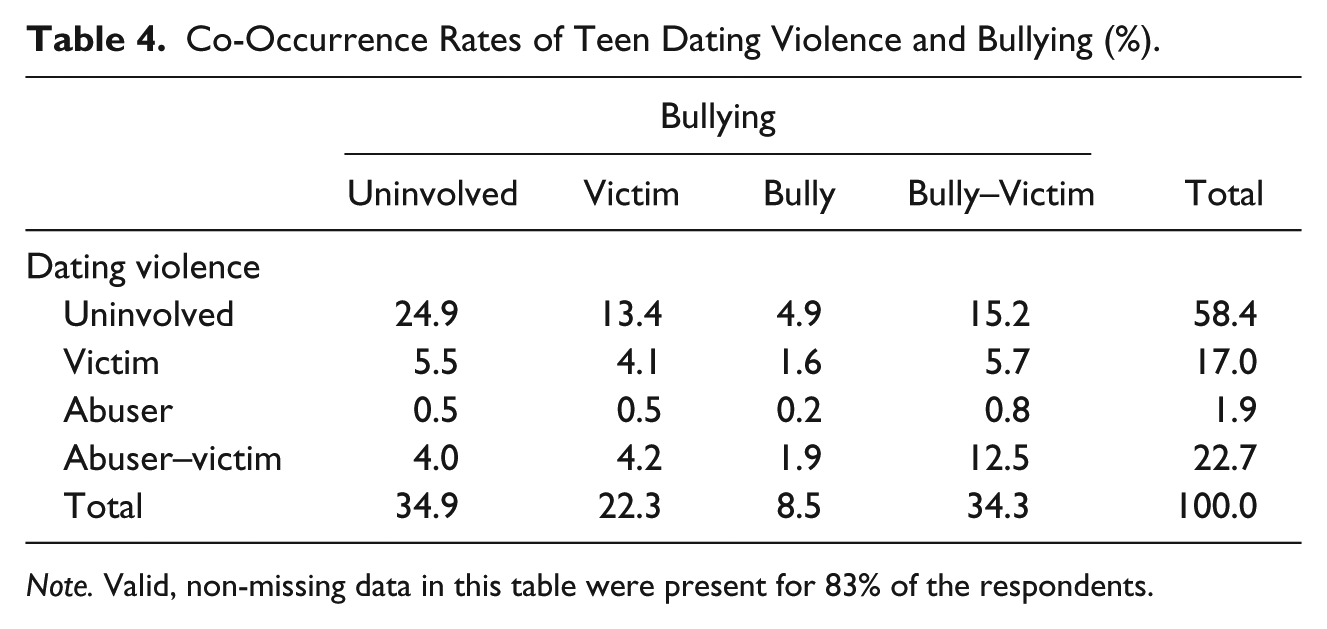
Note. Valid, non-missing data in this table were present for 83% of the respondents.
Discussion
The goal of this study was to expand the empirical knowledge base on youth violence by simultaneously examining teens’ most common experiences with violence—that in dating relationships and that in non-intimate, peer relationships—using a large sample of middle and high school youth. We identified moderate to strong associations between the two behaviors. More specifically, we found that youth who bully and those who are bullied are approximately twice as likely to also abuse their dating partners or suffer dating violence, respectively, when compared with those who do not bully and are not victimized by bullying. We also found that one in eight youth reported both perpetration and victimization experiences in both dating and peer relationships during the prior year. These findings support the limited prior research on such co-occurrence (Espelage & Holt, 2007; Miller et al., 2013).
Many of the stronger associations we found between dating violence and bullying involved digitally perpetrated cyber abuse—something never before examined in such a large sample. More than half of cyber bullies also perpetrated dating violence, compared with less than a quarter of those who did not cyber bully, and almost two thirds of cyber bullying victims, compared with just over a third of non-victims, also experienced dating violence. It may be that once youth realize the ease and relative anonymity with which cyber abuse can be perpetrated, they accept it as an appropriate tool for such perpetration across different social relations.
Footnotes
Acknowledgements
The authors would like to thank (a) the administrators, faculty, and staff of schools who assisted us in collecting the data documented in this report, (b) CJ Pascoe of Colorado College and Cindy Southworth, Erica Olsen, and Sarah Tucker of the National Network to End Domestic Violence for their input on survey measures, and (c) the National Institute of Justice and Dr. Nancy La Vigne, Director of the Urban Institute’s Justice Policy Center, for their careful review of project findings.
Authors’ Note
The opinions, findings, and conclusions and recommendations expressed in this document are those of the authors and do not necessarily reflect those of the Department of Justice, or of the Urban Institute, its trustees, or its funders. Elements of this article were reported to the National Institute of Justice in the form of a final technical report as per grant obligations.
Declaration of Conflicting Interests
The author(s) declared no potential conflicts of interest with respect to the research, authorship, and/or publication of this article.
Funding
The author(s) disclosed receipt of the following financial support for the research, authorship, and/or publication of this article: This project was supported by Award No. 2010-WG-BX-003, awarded by the National Institute of Justice, Office of Justice Programs, U.S. Department of Justice.