



Abstract
Interpersonal youth violence is a growing public health concern in the United States. Having a high sense of school connectedness has been found to be a protective factor for youth violence. A high school course that aims to enhance school connectedness was developed and evaluated to investigate the students’ sense of school connectedness and its association with violent attitudes and behaviors. Survey data from 598 students from a predominately Asian and Pacific Islander student body were analyzed to assess their level of school connectedness and violent attitudes and behaviors. Analysis of Variance was used to identify differences in the school connectedness and violence scores related to students’ demographic characteristics. The role of school connectedness in the relationship between student demographic characteristics and violent attitudes and behaviors was examined with structural equation modeling. Overall, students reported a moderately high sense of school connectedness. School connectedness was found to be negatively associated with violent attitudes but not self-reported violent behaviors. Multiple-group analyses were conducted across the ethnic groups, which found differential associations between the school connectedness and violence variables. These results highlight the value of disaggregating the Asian and Pacific Islander category and the need for future research to further contextualize and clarify the relationship between school connectedness and interpersonal youth violence. This will help inform the development of evidence-based strategies and prevention programming that focus on school connectedness to address disparities in interpersonal youth violence outcomes.
Interpersonal youth violence is a growing public health concern in the United States. Homicide is the third leading cause of death for youth between the ages of 10 and 24 (Centers for Disease Control and Prevention [CDC], 2013). In addition to physical violence, emotional violence has also been shown to have detrimental effects on youth wellness (Williams, Fredland, Han, Campbell, & Kub, 2009) and includes verbal threats, taunts, and the use of intimidation, humiliation, or fear to cause psychological harm. Victims of emotional violence are at risk of poor academic engagement, low self-esteem, social anxiety, and psychosomatic symptoms (Nansel et al., 2001; Wilkins-Shurmer et al., 2003). With the growing popularity of cellular phones and social websites among youth, cyberbullying has become a recent concern, with 49% of youth involved in cyberbullying (Raskaukas & Stoltz, 2007). Effects of cyberbullying can be more devastating than traditional forms of youth violence because perpetrators are able to continue harassing their victims without being physically present (Kiriakidis & Kavoura, 2010). Cyberbullying victimization is related to substance use, depression, and suicide attempts (Goebert, Else, Matsu, Chung-Do, & Chang, 2011).
Links between youth violence and demographic characteristics of youth, such as ethnicity, socioeconomic status, academic achievement, grade level, and gender have been well-established (Herrenkohl et al., 2000; Rudatsikira, Muula, & Siziya, 2008). Ethnic minority youth are more likely to experience violence than White youth (Mayeda, Hishinuma, Nishimura, Garcia-Santiago, & Mark, 2006). Youth from low socioeconomic backgrounds, who tend to face multiple life stressors, are more likely to be exposed to and engage in violence (Aisenberg & Herrenkohl, 2008). Low academic performance is also predictive of violence (Rodney, Johnson, & Srivastava, 2005; Wegner, Garcia-Santiago, Nishimura, & Hishinuma, 2010). In high school, ninth graders are more likely to engage in violent behaviors than students of higher grades (Youth Risk Behavioral Survey [YRBS], 2013). Males are more likely to engage in violence than females (Grunbaum et al., 2003). These findings demonstrate the need for more research to examine how demographic and social characteristics of youth interplay with risk and protective factors.
Until recently, research on protective factors has been minimal, with most attention being on risk factors. This paradigm shift to strength-based research has encouraged researchers to identify, incorporate, and promote existing protective factors to foster healthy behaviors and communities. School connectedness has consistently been shown to be a protective factor in the healthy development of youth (Catalano, Haggerty, Oesterle, Fleming, & Hawkins, 2004; CDC, 2009; Klem & Connell, 2004; McNeely & Falci, 2004). School connectedness is a multidimensional construct that consists of how involved students are at their school, how academically motivated they are, how positive they feel about school, and the quality of students’ relationships with their teachers and peers (Chung-Do, Goebert, Chang, & Fumigani, 2015). Youth who feel connected to their school are less likely to engage in interpersonal violence in and away from the school setting, including physical fighting, hitting, shoving, stabbing, shooting someone, threatening someone with a weapon, and carrying a weapon (Borrowsky, Ireland, & Resnick, 2002; Catalano et al., 2004; Johnson, 2009; Resnick et al., 1997).
Although the State of Hawai‘i is often portrayed as an idyllic paradise given its climate and ethnic diversity, youth violence is a public health concern. For example, according to the 2013 Hawai‘i YRBS, one in six students reported having been in a physical fight in the last year (Saka, Takeuchi, Fagaragan, & Afaga, 2014). In addition, in 2013, one in seven students in Hawai‘i reported being a perpetrator of cyberbullying, and one in six students reported being hurt by having mean things said to them via the Internet or email (Saka et al., 2014). Native Hawaiians and Pacific Islanders report higher rates of deviant and violent behaviors (Mayeda, Pasko, & Chesney-Lind, 2006; Rudatsikira et al., 2008), which may reflect the long-lasting consequences of colonization and discriminatory policies that have limited the access to educational and socioeconomic opportunities for these historically marginalized communities (Kaholokula, Nacapoy, & Dang, 2009). The State of Hawai‘i is considered home to one of the highest percentages of ethnic minorities in the United States, with three quarters of residents identifying themselves as Asians and/or Pacific Islanders (U.S. Census Bureau, 2015). Although Asian Americans and Pacific Islanders are among the fastest-growing minority groups in the United States and projected to reach 20 million by 2020, they are often lumped together as one homogeneous group. This practice ignores the notable historical, socioeconomic, and political context of the more than 32 distinct ethnic groups that are placed in the Asian and Pacific Islander group, which can mask urgent health disparities (Le, 2002). It also perpetuates the “model minority myth,” which may prevent Asians and Pacific Islanders from receiving adequate resources and being appropriately included in research initiatives.
Recognizing the importance of school connectedness, a course called Personal Transition Plan/Leadership (PTP/L) was created by a public high school in Hawai‘i. This course was designed to build students’ sense of school connectedness in developmentally appropriate ways from freshman to senior year. Through a school-university partnership, a course evaluation plan was developed and implemented. Given the extensive amount of evidence that shows school connectedness is an important protective factor against youth violence, this study hypothesized that school connectedness would be inversely related to violent attitudes and behaviors. Given the need to understand the diverse experiences of Asian and Pacific Islander students, this study also examined the relationship between school connectedness and violence by disaggregating the ethnic groups using structural equation modeling (SEM).
Method
Setting
This study took place at a public high school in Hawai‘i with an ethnically diverse student population that is largely composed of Asian and Pacific Islander students (Hawai‘i State Department of Education, 2014). All students at this school are required to register and participate in the weekly PTP/L course every year. The weekly lessons are designed for students to explore various career and college options, build leadership skills through service activities, and develop their sense of school connectedness in developmentally appropriate ways. Lessons for underclassmen focus on increasing students’ interactions with their classmates, teachers, and school staff through service learning and team-building activities, while upperclassmen focus on college and career readiness. Class sizes are purposefully kept to 10 to 15 students. In addition, students remain with the same teacher and classmates throughout their entire time at the school to develop personal and consistent relationships to foster their sense of school connectedness (Black, 2000; Reynolds, Barnhart, & Martin, 1999).
Participants
The PTP/L course evaluation survey and school wellness survey were administered to the entire student body toward the end of the 2009-2010 academic school year. A total of 598 (67%) students out of 899 students enrolled in the PTP/L course completed both surveys, which were used for the following analyses.
Measures
Demographic variables
Four demographic questions were asked on the PTP/L survey: (a) What is your sex? (b) Which of the following (ethnicity) do you most strongly identify with? (from a list of 14 possible ethnic groups), (c) Do you qualify to get free or reduced-cost lunch? and (d) On average, what were your grades on your last report card? Sex was coded boy = 0 and girl = 1. Ethnicity was grouped into six racial/ethnic categories and dummy coded into categorical variables: Native Hawaiian (part or full; defined as indigenous people of Hawai‘i), Pacific Islander (defined as immigrant and migrant Pacific Islanders including Samoans, Tongans, Micronesians, etc.), Filipino, Japanese, Caucasian, and Other (including Black/African American, Portuguese, Puerto Rican, Latino, Chinese, Other Asian, and Other). Socioeconomic status was coded as students who qualify for free or reduced-cost lunch = 1, and those who do not qualify = 0. Self-reported grade point average (GPA) was calculated by coding an A or A− average as 4, B+ to B− average as 3, C+ to C− average as 2, and D or less average as 1. Grade level was determined by school records and coded as an ordinal variable.
School connectedness
The PTP/L survey measured school connectedness using a comprehensive psychometrically sound five-factor scale (Chung-Do et al., 2015), which assessed academic motivation, school attachment, school involvement, teacher support, and peer relations with Cronbach’s coefficient alphas for the five factors ranging from .73 to .93. Questions were worded to assess how much the course was responsible for feelings of school connectedness at the end of the school year (e.g., “This course has encouraged me to get involved in school-related activities” and “This course has contributed to making me feel like I am part of this school”). All items were measured with a 5-point Likert-type scale (1 = strongly disagree, 2 = disagree, 3 = neutral, 4 = agree, 5 = strongly agree). A composite score was created by calculating the mean of the 15 items.
Violent attitudes and behaviors
The outcome variables, violent attitudes and behaviors, were measured through a student wellness survey with 12 items adapted from the CDC Compendium (Dahlberg, Toal, Swahn, & Behrens, 2005). The four indicators of violence were (a) violent attitudes, (b) physical violence perpetration, (c) emotional violence perpetration, and (d) cyberbullying perpetration. All indicators were measured with a 4-point Likert-type scale (1 = strongly disagree, 4 = strongly agree). Violent attitudes were measured with three items (e.g., “It’s okay to hit someone who hits you first”; α = .70). Physical violence was measured with three items (e.g., “In the past year, I pushed shoved, or hit a student”; α = .69). Emotional violence was measured with four items (e.g., “In the past year, I have spread rumors, gossip, or talked smack about someone”; α = .76). Cyberbullying was measured with two items (e.g., “In the past year, I sent someone an embarrassing, threatening, mean, or insulting message on a cell phone/email/instant message”; α = .84). Composite scores were created by calculating the mean for each of the four violence indicators.
Procedures
The PTP/L and student wellness surveys were administered to all students in May 2010. No parent permission or youth assents were collected because the evaluation was considered to be a part of the school’s internal evaluation. Each student was assigned an ID code for confidentiality and to link data from the two surveys. Surveys were administered on two different days by classroom teachers, who were provided written instructions. Students were reminded that answers were confidential and would not affect their grades. To protect confidentiality, a cover sheet with the student’s name was attached to the front of his or her survey so teachers could distribute surveys accordingly. Teachers instructed all students to remove the cover sheet before completing the survey. The cover sheets were collected separately from the surveys and destroyed. Therefore, the survey tools only included the student ID codes, but not names. The PTP/L survey took approximately 30 min, and the student wellness survey took approximately an hour to complete. University staff members were available throughout both of the survey administration to help answer questions and to collect the surveys from each classroom immediately after the class period. The University of Hawai‘i Institutional Review Board approved this study as research of existing data.
Data Analysis
Surveys were scanned, and data were imported into SAS 9.2 for cleaning and coding. Chi-square was conducted to assess the representativeness of the sample by comparing the participants’ demographic variables (sex, GPA, ethnicity, and socioeconomic status) with the student body. The demographic information of the student body was obtained from de-identified school records and the annual school report (Hawai‘i State Department of Education, 2010). Data were coded so higher scores reflected a strong sense of school connectedness and higher levels of violent attitudes and behaviors. The violence-related items on the school wellness survey were rescaled to follow a 5-point (rather than a 4-point) Likert-type scale to be comparable with the 5-point school connectedness score. ANOVA was conducted to assess for any sex, ethnic, socioeconomic, GPA, and grade-level differences in the mean scores of school connectedness and the four indicators of violence.
MPlus 5.2 was utilized to examine the measurement and structural equation models. To account for the skewness in the data, each school connectedness and violence variable was computed as a categorical variable with five response options. Confirmatory factor analysis (CFA) was performed on the violence variables to examine the fit of the measurement model. Missing data were minimal (<3%), and multilevel multiple imputation was used to impute sets of missing values (Schaefer, 2001) to ensure that complete data sequences were available for all cases (Allison, 2002). The imputed values were bounded to valid data ranges, which allowed all imputed dichotomous variables to range between 0 and 1 rather than rounding values (Allison, 2005). Utilizing SEM, partial and full mediation models of school connectedness were assessed to examine the strength of associations of the students’ demographic characteristics, school connectedness, and violence outcomes. A direct effect model was also tested to assess the relationships of students’ demographic characteristics and school connectedness with the violence outcomes.
The following goodness of fit (GFI) indices were used to compare the fit of the three tested models. The comparative fit index (CFI) was used to compare the ability of a model to replicate the variance–covariance matrix compared with no model at all (Jöreskog & Sörbom, 1984 cited in Grimm & Yarnold, 2000). The CFI values range from 0 to 1, with models with values greater than .90 considered to be a good fit. The Tucker–Lewis Index (TLI) is a non-normed fit index that allows for a penalty for adding parameters. Similar to CFI, TLI values of greater than .90 are considered to indicate a good fit (Tucker & Lewis, 1973). The root mean square error of approximation (RMSEA) is a fit index focusing on the estimated population fit. A well-fitting model should have a value approaching 0, with a value of .08 or less indicating an adequate fit. Robust weighted least square means and variance (WLSMV) estimation was used in all analyses to account for the categorical variables within a limited sample size.
Using ethnicity as a grouping variable, we performed multiple-group SEM to investigate for any ethnic difference of the direct effects of school connectedness on the four types of violence factors (i.e., physical violence, emotional violence, and cyberbullying). To do comparative analyses of relational characteristics between school connectedness and violence factors, we imposed metric invariance of measurement models of school connectedness and the four violence factors. The metric invariance measurement models ensured qualitative equivalence of all latent variables among the six ethnic groups and allowed us to quantitatively depict any ethnic differences.
Results
Participant Description
Demographic characteristics of the participants are shown in Table 1. The proportion of female and males was relatively equal. Nearly 43% of the participants reported their ethnic identity as Native Hawaiian, 16% as Filipino, 13% as Caucasian, 11% as Japanese, 8% as Other, and 7% as Pacific Islanders. Slightly less than half of the participants reported that they qualified to receive free or reduced-school lunch. The majority of the sample reported that their GPA on their last report card was a B average. The sample included 135 ninth graders, 158 tenth graders, 151 eleventh graders, and 154 twelfth graders. Statistically significant differences were found in ethnicity and GPA between the study participants and the student body of the school. There were less Native Hawaiian students and more Filipino, Japanese, Caucasian, and Pacific Islander students in the sample compared with the ethnic composition of the student body. The overall self-reported GPA of the sample was higher than the GPA of the student body. There were no statistical differences in sex and socioeconomic status between the sample and the student body.
Sample Characteristics (N = 598).
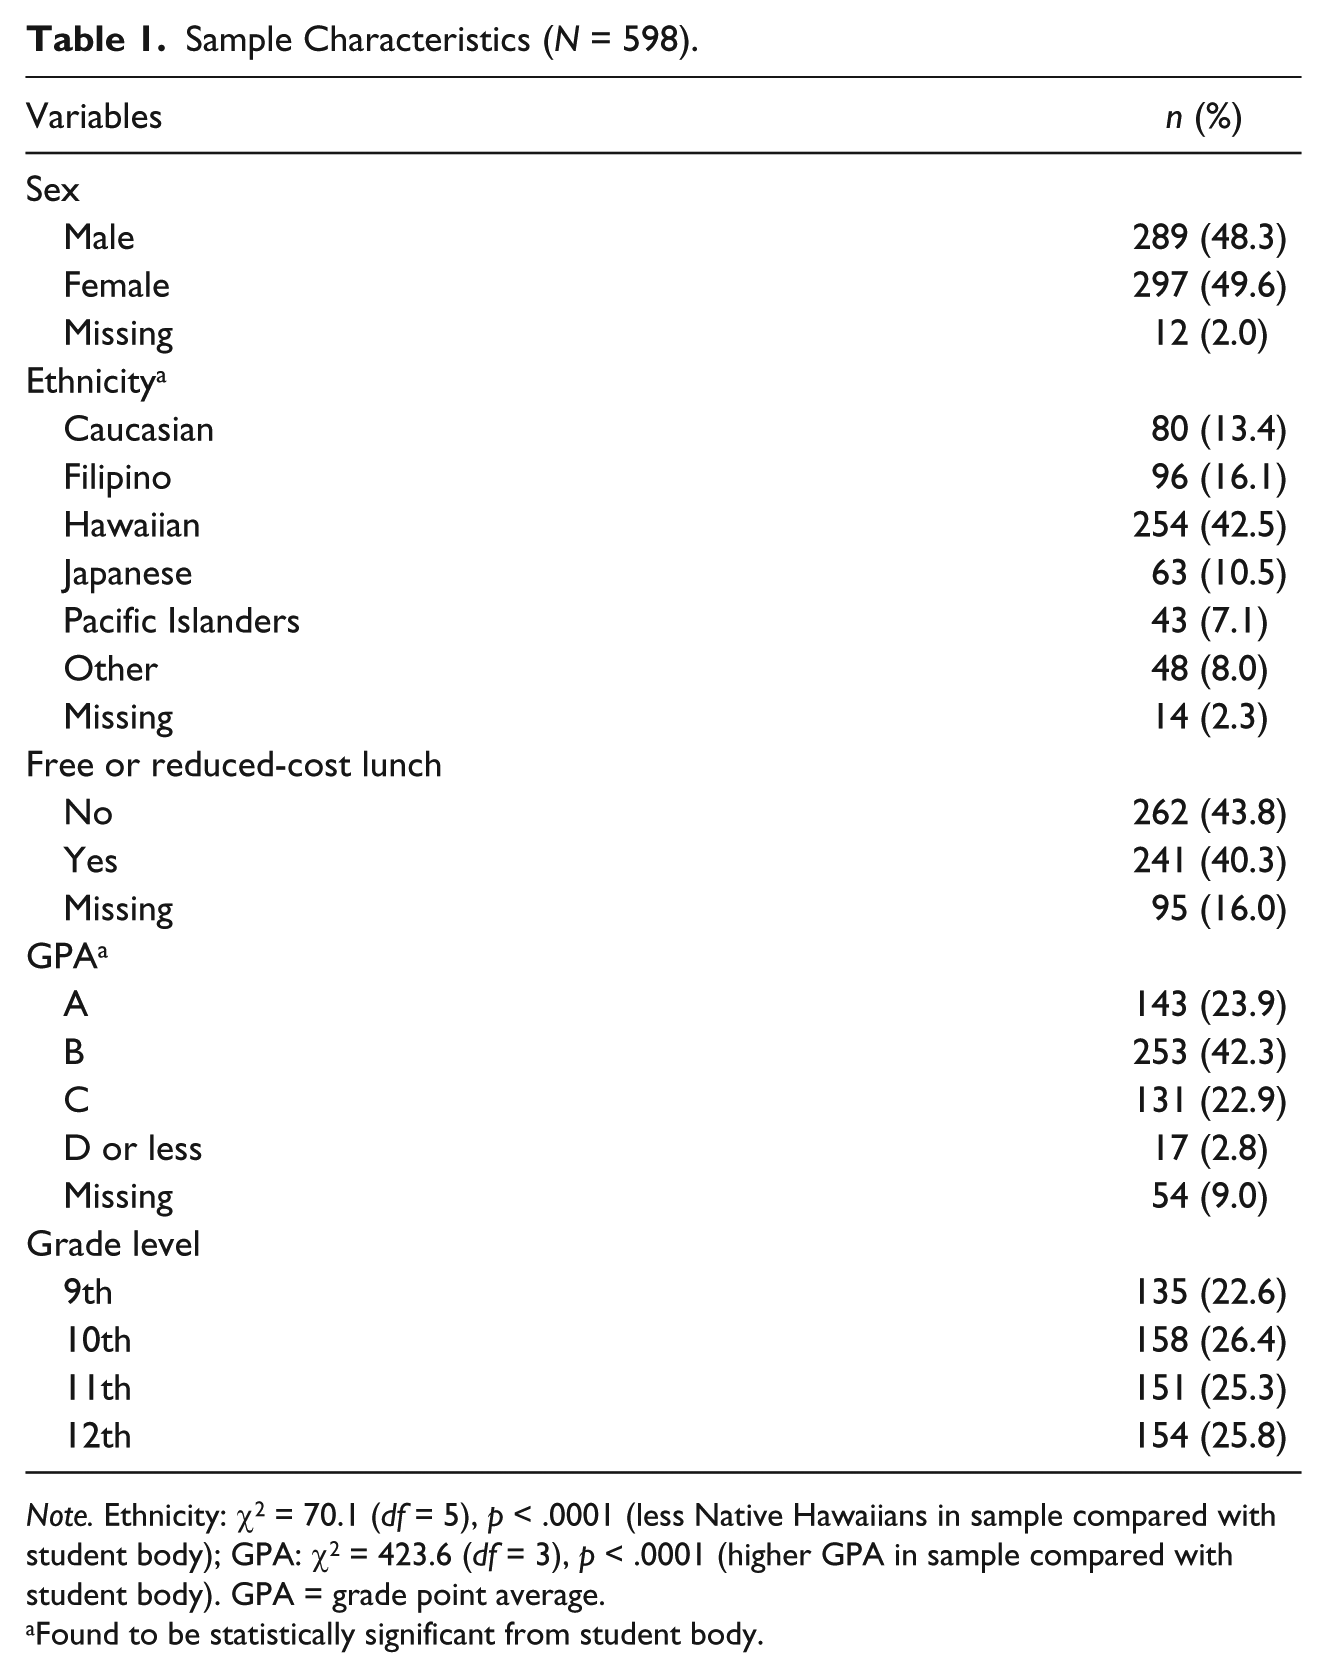
Note. Ethnicity: χ2 = 70.1 (df = 5), p < .0001 (less Native Hawaiians in sample compared with student body); GPA: χ2 = 423.6 (df = 3), p < .0001 (higher GPA in sample compared with student body). GPA = grade point average.
Found to be statistically significant from student body.
The mean school connectedness score for the entire sample was 3.42 (SD = .72) on a 5-point Likert-type scale. Table 2 displays the mean scores of school connectedness and violence by students’ demographic characteristics. Statistically significant differences were found by ethnicity and grade level with school connectedness. Pacific Islanders had the highest mean score for school connectedness at the end of the course, followed by Filipinos and Native Hawaiians, while Caucasians reported the lowest. Students in 11th and 10th grades had higher scores of school connectedness compared with students in 9th grade, with 12th graders reporting the lowest.
Descriptive Data of School Connectedness and Violence Outcomes by Sample Characteristics (N = 598).

Note. All scores are on a scale of 1 to 5, with 5 indicating the highest level of school connectedness and violence. ns = not statistically significant.
Students’ mean scores for the four violence indicators significantly differed by demographic characteristics. Males were more likely to report higher levels of physical, emotional, and cyberbullying violent behaviors, and hold violent attitudes compared with females. Native Hawaiians and Pacific Islanders were more likely than other ethnicities to report physical violent behaviors and violent attitudes, with Japanese students reporting the lowest levels. Students who reported that they qualify for free or reduced-cost school lunch also reported higher levels of physical violent behaviors and violent attitudes compared with those who do not qualify. The lower the students’ self-reported GPA, the more likely they were to report violent attitudes.Students who reported a GPA of C or lower were more likely to engage in physically violent behaviors compared with those who had B or higher. Students who reported a GPA of D or lower were more likely to engage in cyberbullying than those who reported C or higher averages. Although ninth graders reported the highest level of violence across all four violence indicators, the differences were not statistically significant.
Measurement Model
CFAs were conducted to assess the model fit of the four violence indicators: (a) physical violence, (b) emotional violence, (c) cyberbullying, and (d) violent attitudes. The first CFA assessed the fit of the four indicators as a single latent variable for all four latent variables, which provided a mediocre fit, χ2 = 142.7 (df = 23), p < .0001, CFI = .963, TLI = .981, RMSEA = .093. The standardized factor loadings were .85 for physical violence, 1.00 for emotional violence, .90 for cyberbullying, and .59 for violent attitudes. The second CFA assessed the fit of the violence measures as four separate latent variables, which improved the model fit, χ2 = 105.5 (df = 23), p < .0001, CFI = .975, TLI = .987, RMSEA = .077. Therefore, the four indicators of violence were entered into the structural model as four separate factors. Table 3 displays the standardized factor loadings for the 12 items embedded within the four violence indicators.
Standardized Factor Coefficients of Violence Measures Based on Confirmatory Factor Analysis.
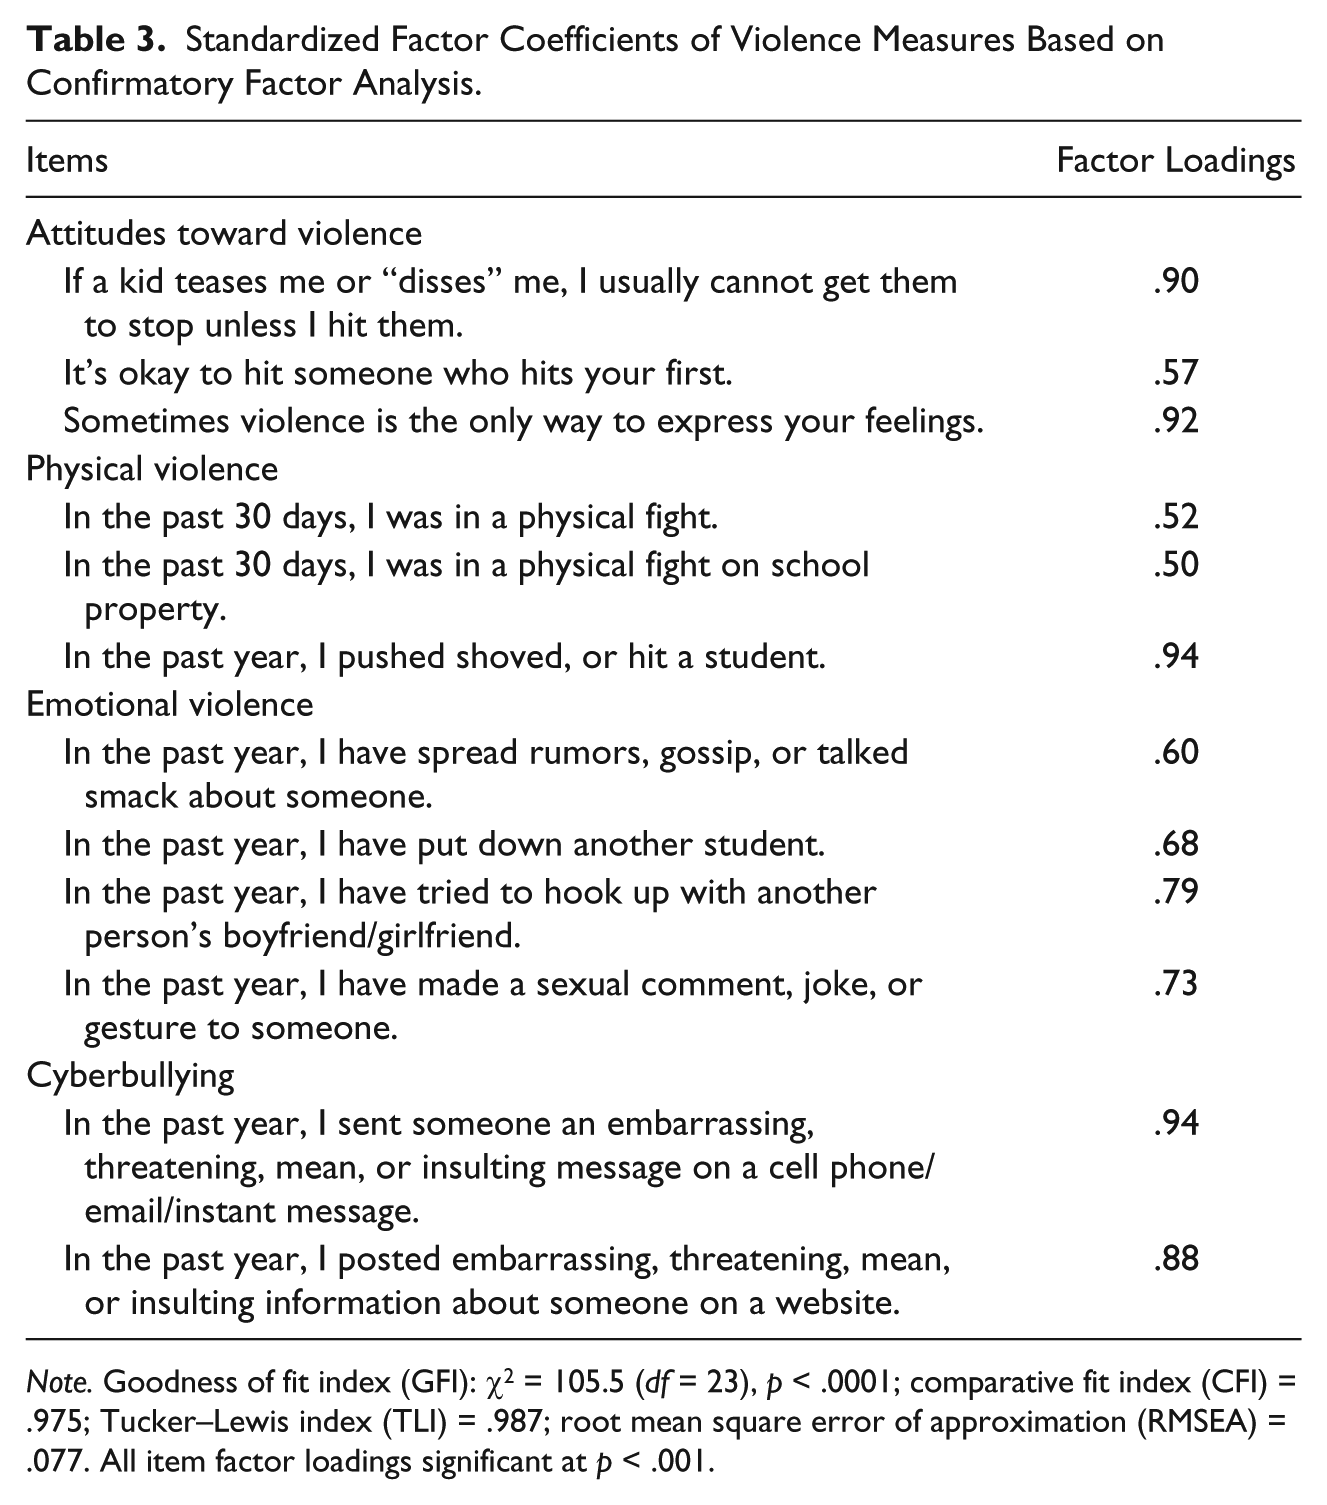
Note. Goodness of fit index (GFI): χ2 = 105.5 (df = 23), p < .0001; comparative fit index (CFI) = .975; Tucker–Lewis index (TLI) = .987; root mean square error of approximation (RMSEA) = .077. All item factor loadings significant at p < .001.
Structural Equation Model
Three structural models were tested to examine the role of school connectedness in the relationship between students’ demographic characteristics and violent attitudes and behaviors. School connectedness was tested as a partial and full mediator of this relationship. It was also tested as a direct contributor to the four violence indicators. The partial mediation model adequately fit the data, χ2 = 344.2 (df = 94), p < .0001, CFI = .957, TLI = .980, RMSEA = .078. A higher level of school connectedness was associated with being a Pacific Islander, while other ethnicities had no statistical significance. Demographic characteristics of students had varying effects on the four measures of violence. Being qualified for free or reduced-cost lunch was a significant contributor to violent attitudes. Grade level was negatively related to physical violence and cyberbullying. Self-reported GPA was negatively related to violent attitudes, physical violence, and cyberbullying. Being a Pacific Islander was positively associated with physical violence. Being male was a significant contributor to all four violence indicators. Although school connectedness was not significantly related to violent behaviors, it was a statistically significant negative contributor to violent attitudes, accounting for 22% of the variance.
The full mediation model also had an adequate fit, χ2 = 334.3 (df = 85), p < .0001, CFI = .958, TLI = .978, RMSEA = .081. The relationships among school connectedness and violent attitudes and being a Pacific Islander were maintained. The direct effect model was also assessed with school connectedness and demographic variables each directly influencing violent attitudes and behaviors, which provided the best fit, χ2 = 168.9 (df = 54), p < .0001, CFI = .980, TLI = .984, RMSEA = .069. School connectedness continued to have a significant protective influence on violent attitudes, and all associations between demographic variables and the four violence indicators were maintained. The standardized path coefficients in the direct effect model are shown in Table 4. The direct effect model is presented in Figure 1, which illustrates the statistically significant associations of school connectedness and students’ demographic characteristics with the four violence indicators.
Standardized Path Coefficients of Direct Effects Model of School Connectedness and Demographics Characteristics Predicting Youth Violence.
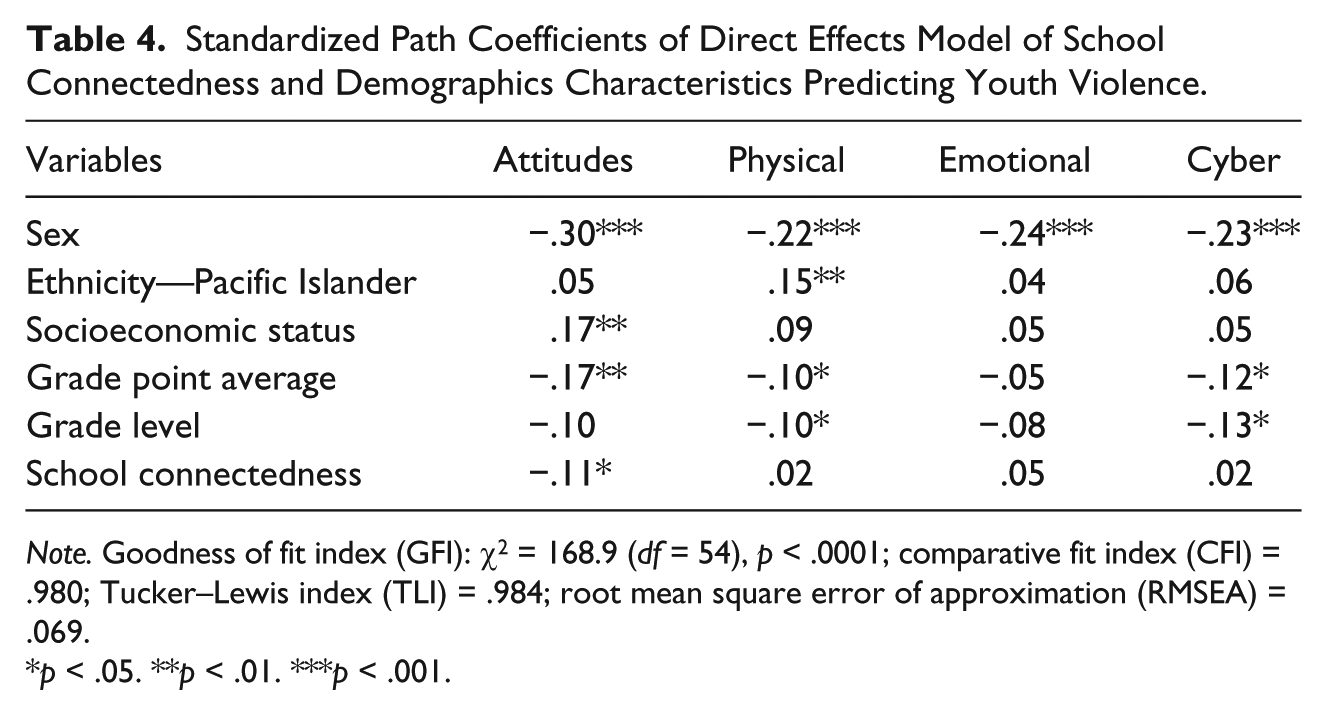
Note. Goodness of fit index (GFI): χ2 = 168.9 (df = 54), p < .0001; comparative fit index (CFI) = .980; Tucker–Lewis index (TLI) = .984; root mean square error of approximation (RMSEA) = .069.
p < .05. **p < .01. ***p < .001.

Structural equation model for statistically significant associations of students’ demographic characteristics and school connectedness with violence indicators.
Multiple-Group Analyses
For the multiple-group models, we examined whether or not the regression effects of school connectedness on the four violence factors were different across the six ethnic groups controlling for the other demographic variables. The basic multiple-group model was examined to assess whether there were unique factor mean intercepts, unique factor variance and covariance, and the unique factor regression effects of school connectedness. However, by default, the measurement model (factor loadings) was specified metrically invariant across ethnic groups. For this model, we did not control the effect of demographic variables on violence factors. The multi-group testing showed that the model did not fit well, χ2 = 441.4 (df = 130), p < .0001, CFI = .875, TLI = .914, RMSEA = .157. The regression effects of school connectedness on different types of violence varied across the six ethnic groups as shown in Table 5.
Regression Effects of School Connectedness on Violence Factors Across Ethnic Groups.
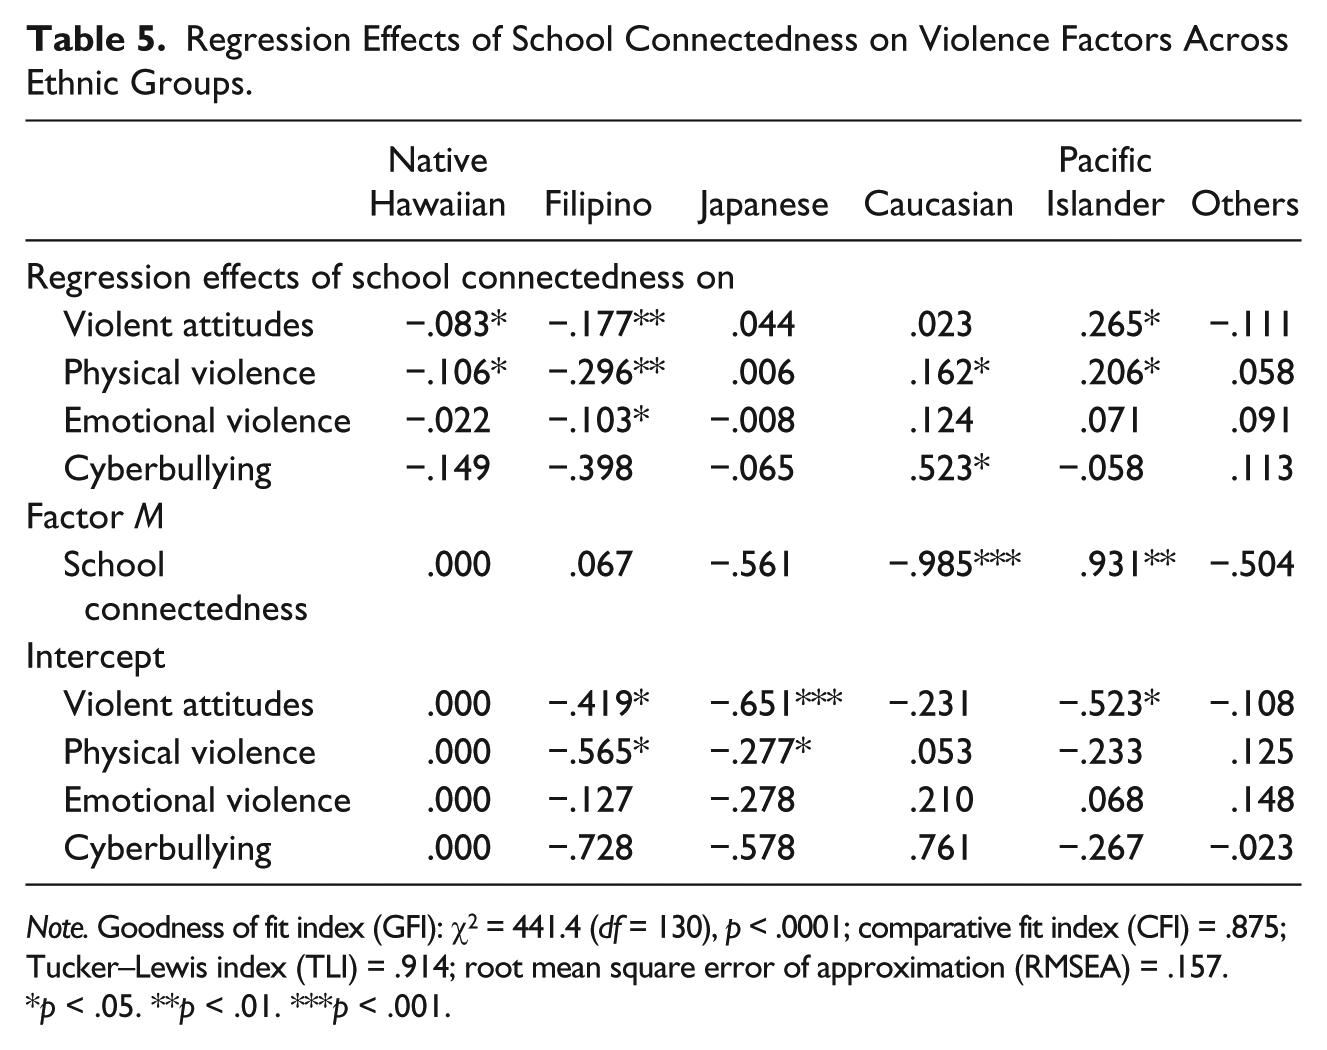
Note. Goodness of fit index (GFI): χ2 = 441.4 (df = 130), p < .0001; comparative fit index (CFI) = .875; Tucker–Lewis index (TLI) = .914; root mean square error of approximation (RMSEA) = .157.
p < .05. **p < .01. ***p < .001.
Based on the results of the multiple-ethnic-group SEM model, we found that Caucasian indicated the lowest factor mean for school connectedness (µschool connectedness = −.985), Japanese and Others were mid-groups on the factor mean (µschool connectedness = −.561 and −.504, respectively), the factor means of Native Hawaiian and Filipino groups were numerically similar (µschool connectedness = .000 and .067, respectively), and that the factor mean of Pacific Islander was the highest (µschool connectedness = .931). For Japanese and Others, the effect of school connectedness on violent attitudes and behavior was not statistically significant. For the remaining ethnic groups, school connectedness had different influences on the four factors of violence. For Native Hawaiians, school connectedness was significantly associated with lower violent attitudes and physical violent behaviors. This effect was the same for Filipino students, in addition to emotional violence. However, for Caucasian and Pacific Islander students, we found that school connectedness was associated with higher levels on the violence factors. For Caucasian students, school connectedness seemed to increase the likelihood of engaging in physical violence and cyberbullying. For Pacific Islanders, school connectedness was associated with higher levels of self-reported violent attitudes and physical violence.
We also performed alternative nested multiple-group models to examine the salience of the factor regression effect of school connectedness. First, we tested whether the regression effect of school connectedness was important. For this analysis, we set the null constraint on all the parameter paths from school connectedness to violence factors, which was found to not have a good fit (Δχ2 = 59.3, Δdf = 24, p < .0001). We also examined the importance of effects of school connectedness on the violence factors for each ethnic group. To do so, we removed regression paths from school connectedness to the violence factors for the specific ethnic group with those path coefficients estimated for the remainder of the five ethnic groups. When we removed regression paths for the Native Hawaiian group, the model fit worsened (Δχ2 = 9.0, Δdf = 4, p = .06), indicating certain regression paths from school connectedness to the violence factors were important. Filipino, Caucasian, and Pacific Islander groups followed a similar pattern, which showed that removing the regression paths of school connectedness also did not yield a good fit and suggests school connectedness has significant effects on violence factors (Δχ2 = 22.2, Δdf = 4, p = .00031 for Filipino; Δχ2 = 10.9, Δdf = 4, p = .027 for Caucasian; Δχ2 = 10.0, Δ df = 4, p = .0403 for Pacific Islanders). However, for both Japanese and Other ethnic groups, removing these factor regression paths did not worsen the model fit (Δχ2 = 1.0, df = 4, p = .9112 for Japanese; Δχ2 = 6.1, Δdf = 4, p = .1942 for the Others, respectively).
Furthermore, we examined whether or not the regression effects of school connectedness on violence factors were the same across all ethnic groups. To do so, we set equality constraints of the regression path from school connectedness on violence factors across all ethnic groups. For example, the path coefficient from school connectedness to physical violence was set numerically equivalent across all ethnic groups. Similarly, the other three paths from school connectedness to violent attitudes, emotional violence, and cyberbullying were set numerically equivalent across the six ethnic groups. We found that these regression effects were not invariant across ethnic groups (Δχ2 = 55.0, Δdf = 20, p < .0001). We also examined whether or not the specific ethnic group was different from the remaining five ethnic groups in terms of the regression effect of school connectedness. To do so, we specified the regression paths from school connectedness to violence factors to be numerically equivalent across five ethnic groups, with these paths set to be numerically different for the remaining specific ethnic group. We found that the model fit of these alternative models worsened. Thus, this indicates that school connectedness may have a varied impact on violence factors across the six ethnic groups. Results of the likelihood difference tests of the model comparisons are presented in Table 6.
Results of Likelihood Ratio Difference Tests of Alternative Nested Multiple-Group Models for the Regression Effects of School Connectedness on Violence Factors.

Note. The full model for the multiple-group model comprises different factor mean and intercepts, different factor variance–covariance, and different factor regression across ethnic groups; Goodness of fit index (GFI): χ2 = 441.4 (df = 130), p < .0001; comparative fit index (CFI) = .875; Tucker–Lewis index (TLI) = .914; root mean square error of approximation (RMSEA) = .157.
Discussion
This study aimed to measure the level of students’ sense of school connectedness at the end of a mandatory high school course and investigate the association of students’ levels of school connectedness with violent attitudes and behaviors in a sample of largely Asian American and Pacific Islander students. The association of student demographic variables with violence outcomes in this study was similar to patterns found in the broader youth violence literature. Sex differences were clearly demonstrated, with males having higher scores across all four violence measures, which also corroborate findings from other studies with Asian American and Pacific Islander samples (Hishinuma et al., 2005). This relationship was maintained in the SEM. These findings raise the question of whether youth violence prevention programs targeted specifically at males should be developed. Boys are less likely to be connected to school and are at more risk of engaging in risky behaviors, such as substance use and violence (Appleton, Christenson, & Furlong, 2008; Resnick et al., 1997). Although not statistically significant, males reported lower levels of school connectedness compared with females in our sample. Academic standing, measured with self-reported GPA, was also negatively associated with all measures of violence except emotional violence. This is reflective of findings from Wegner et al. (2010) that school achievement was one of the strongest protective factors for violence among Asian American and Pacific Islander youth. Wegner et al. (2010) also found that having college aspirations and favorable attitudes toward school were protective of youth violence, which are major goals of the PTP/L course. Thus, efforts to strengthen and evaluate the PTP/L course as a strategy to prevent and reduce youth violence by enhancing the students’ educational achievement and school connectedness may be worthwhile.
We found that Native Hawaiians and other Pacific Islanders self-reported the highest levels of physical violence and violent attitudes compared with all other ethnic groups in our sample. Studies that disaggregate the Asian American and Pacific Islander population have found racial/ethnic disparities similar to our study. A national study of the YRBS from 1999 to 2009 found that Native Hawaiian and other Pacific Islander youth are more likely to carry weapons, feel unsafe, and engage in fighting than youth of other ethnicities (Sugimoto-Matsuda, Hishinuma, & Chang, 2013). In Hawai‘i-based research, Mayeda, Chesney-Lind, and Koo (2001) found that Native Hawaiian and Samoan youth self-reported higher rates of overall risky behavior (e.g., violence, delinquency, property offense, and substance use) compared with youth of other ethnicities. Despite the small sample size of this study, Pacific Islanders (not including Native Hawaiians) self-reported the highest level of school connectedness out of all ethnic groups in the sample, suggesting that the course is especially effective for Pacific Islander students who often report facing educational and social challenges. In Hawai‘i, many Pacific Islanders are recent immigrants and migrants from islands that include Samoa, Tonga, Guam, the Marianas, the Marshall Islands, the Federated States of Micronesia, and Palau. As immigrants and migrants adapt to life in the United States, many face cultural, linguistic, and socioeconomic barriers in multiple settings, including the school environment. Mayeda et al. (2001) found that the perceived lack of school connectedness among Pacific Islander and Native Hawaiian students is a pervasive stereotype that exists in school settings. These students’ negative experiences with teachers and school staff can lead to the internalization of these stereotypes, which may diminish their overall sense of school connectedness (Mayeda, Pasko, & Chesney-Lind, 2006).
Given that Native Hawaiians and Pacific Islanders are underrepresented in the higher education system compared with other major ethnic groups in Hawai‘i (Mayeda, Okamoto, & Mark, 2005), more attention should be paid to enhancing the educational outcomes of these students. Relationship-building may be an important component to the learning styles of Pacific Islander youth (Scull & Cuthill, 2007). Qualitative evaluation of the PTP/L course conducted with students also revealed that the quality of the teacher–student relationships created through the course is vital to its success (Chung-Do et al., 2013). Providing Native Hawaiians and Pacific Islanders opportunities to build strong relationships with teachers may help to create positive experiences at school.
School connectedness was found to have a modest, but direct protective relationship with violent attitudes in the overall model. However, school connectedness was not significantly related to violent behaviors, which conflicts with findings of prior studies. This may be because the goals of this course do not explicitly include prevention and reduction of violence. Theories of behavior change, such as the Theory of Reasoned Action and the Health Belief Model, assert that attitudes and social normative perceptions are predictors of behaviors (Glanz, Rimer, & Lewis, 2002). Therefore, the modest association between violent attitudes and school connectedness may be reflective of the intermediary outcomes before violent behaviors. However, attitudes do not always predict behavior, especially when situational pressures are present (Gleitman, Fridlund, & Reisberg, 1999). For example, students who hold non-violent attitudes may behave violently if their family member is being threatened (Adler, 2008).
It is also important to note that the results of multiple-group SEM found differential associations of school connectedness across the ethnic groups. For example, school connectedness was not significantly related to violence behaviors and attitudes for students of Japanese and other ancestries. For Native Hawaiian and Filipino students, school connectedness seemed to have inverse associations with violent attitudes and behaviors, whereas it has a moderate opposite association for Caucasian and Pacific Islander students. Spriggs, Iannotti, Nansel, and Haynie (2007) also found inconsistent associations with aggressive behaviors and school connectedness across ethnic groups and identified parental communication and peer relationships as important factors. Thus, gaining a better understanding of the home environment, as well as the social structures and dynamics within and among these ethnic groups in the school and community settings, could shed more light on this spurious finding. Including measures of students’ experiences of violence victimization could also be helpful in developing a more contextualized understanding of this finding. For example, Eisenberg, Neumark-Sztainer, and Perry (2003) found ethnic differences in the victimization rates of peer harassment, which could moderate the protective effect of school connectedness and contribute to differing rates of violence perpetration. Future studies with larger samples and a deeper look at the context of the ethnic relations and social boundaries within the school and the surrounding neighborhoods may provide more insights (Van Dorn, Bowen, & Blau, 2006).
Limitations of this study include the cross-sectional nature of the data, which limits the ability to discern causation. Future studies should collect baseline scores of violence and school connectedness at the beginning of the school year to be compared with scores at the end of the school year to assess at least the temporal, if not causal, relationship between the two variables. In addition, the possibility of a ceiling effect may have affected the results. In other words, the course may have limited impact on students with already-high levels of school connectedness. Because baseline scores were not collected, we could not account for maturation effects. Recruiting another school to serve as a comparison group would also strengthen the findings of the evaluation. Because the findings of this study are limited to students from one high school in a specific region of the United States, more studies in other regions with diverse samples should be conducted. Caution should also be exercised when interpreting these findings due to the small sample size of some of the ethnic groups and the potential of statistical outliers overly influencing the results. Chi-square analyses revealed sample bias with proportionally less Native Hawaiian students and students with higher GPA in the sample compared with the student body. Students who were chronically absent or truant may have been less likely to complete the surveys, as well as students who have difficulty reading or maintaining attention for a long period of time. In addition, the study solely relied on the self-report surveys to measure student perceptions, attitudes, and behaviors. Although using direct observation would be beneficial in gaining a more complete picture of the interactions that are occurring at the school to assess school connectedness (Fraser, 1998), the survey methodology can advantageous because it captures data that an observer could miss or consider unimportant. In addition, allowing the students to self-report their perceptions and experience may be beneficial because they have encountered many learning environments to form accurate impressions. Moreover, ensuring confidentiality during survey administration may have improved self-report accuracy, especially when measuring delinquent behaviors among youth (WestEd, 2010).
The findings of this study highlight the value of disaggregating the Asian American and Pacific Islander category to uncover potential disparities (Le, 2002). Further research is needed to determine the relationship between school connectedness and violence for the ethnic groups that are included in the Asian American and Pacific Islander category. The focus on Asian Americans and Pacific Islanders is important because approximately 1 out of every 10 Americans will be of Asian and/or Pacific Islander descent by 2050 (Asian American and Pacific Islander Primer, 2011). Therefore, it is imperative to develop a better understanding of the experiences of youth violence among the Asian American and Pacific Islander population and identify protective factors that can be enhanced. In addition to strengthening the evaluation efforts of this course, examining other sources of data, such as actual GPA, types of school involvement, and college attendance, can also help shed light on the potential impact of the PTP/L course. This study is one of the few studies to focus on the relationships between school connectedness and violence with a large Asian American and Pacific Islander sample. Because changing attitudes and behaviors takes time, a social–ecological perspective in the future evaluation of the PTP/L course may help to clarify the role that school connectedness plays in youth outcomes (Goebert et al., 2012). These efforts may inform schools and policymakers on evidence-based strategies to effectively promote school connectedness to prevent violence for all youth.
Footnotes
Authors’ Note
The contents of this article are solely the responsibility of the authors and do not necessarily represent the official views of the funding agencies. Special thanks to the staff of the Asian/Pacific Islander Youth Violence Prevention Center for their assistance with this study and Kailua High School for its collaborative efforts in enhancing youth wellness.
Declaration of Conflicting Interests
The author(s) declared no potential conflicts of interest with respect to the research, authorship, and/or publication of this article.
Funding
The author(s) disclosed receipt of the following financial support for the research, authorship, and/or publication of this article: This study was supported in part by Grant R49/CCR918619–01 and Cooperative Agreement 1 U49/CE000749-01 from the Centers for Disease Control and Prevention (CDC).