




Abstract
Blalock proposed that the threat of a minority group toward a majority in sheer size, economic competition, or power will result in an increase in discrimination toward that group. His original formulation of this theory of minority group threat, and its subsequent extensions, has focused almost exclusively on racial minority–majority relationships; however, Blalock asserted that his theory would apply to any minority–majority group relationship. Extensions to religious groups have shown this is likely the case. The current analysis assesses a further extension of minority group threat by reframing the arguments of the theory and adding two additional sources of threat to examine sexual orientation bias. Data from the Uniform Crime Reports Hate Crime Statistics program are used to assess whether the minority group threat hypotheses explain the reporting of sexual orientation bias crimes. The findings indicate that the original formulation of Blalock’s theory does not suffice to explain the reporting of anti–Lesbian, Gay, and Bisexual bias crime, but the proposed extensions may explain some of this variation.
Throughout history, society has been divided into groups (an in-group and an out-group) that are often at odds with each other. Emile Durkheim (Durkheim, 1984; Garland, 1990) explained the need for an out-group by suggesting that to develop a cohesive group identity and thus a collective conscience, the group must be able to define “the other.” In such a way, the other becomes an important defining characteristic of the group itself. The other becomes especially important when the group is threatened. As Blalock (1967) points out in his seminal book, this threat may represent the gaining of resources by the other, either economic or political.
The collective conscience that Durkheim (1984) points to allows the group to dominate the other by creating rules and laws. Although this dominant group gains more power, the other becomes subjugated, lacking the power to change the laws created by the dominant group. These power differentials create the conflict between the groups that Karl Marx (Garland, 1990) points to.
Over the history of modern civilization, “other” has been defined in many ways. In the last 60 years, the powerful group has been defined by race differences, ethnic and cultural differences, gender differences, and differences in sexuality. Social movements have developed to reduce the power differential and increase the equality between the groups. The civil rights movement has led to policies and laws that have reduced, although not resolved, the inequality between the African American community and the Caucasian community. The women’s rights movement has similarly produced changes in an effort to reduce the inequality between men and women. In the United States today, two groups with the greatest defined inequality with active social movements fighting against it are the immigrant community and the lesbian, gay, bisexual, and transgendered (LGBT) community. Examination of the movement toward immigration reform is beyond the scope of this article; however, recent advances in the LGBT movement may be especially salient for the purpose of explaining and describing social control of sexual orientation minorities.
Over the past two decades, the political and social landscape for the LGBT population has changed dramatically. With the recent Supreme Court decision (Obergefell v. Hodges, 2015) to legalize same-sex marriage in all 50 states, it would seem that at least one major step has been taken toward relieving some of the prejudice that has plagued this population. However, as was the case during the civil rights movement of the 1950s, 1960s, and 1970s, changes in the political and social atmosphere often lead to changes in the social control of minority groups. These changes can lead to increased tension between the minority and majority and can result in violence. Research on the LGBT population, however, often focuses on demographics (Black, Gates, Sanders, & Taylor, 2000), homophobia (Igartua, Gill, & Montoro, 2009), and health issues, such as suicidality (Hammelman, 1993), with few studies (Garnette, Irvine, Reyes, & Wilber, 2011; Mogul, Ritchie, & Whitlock, 2011) examining the social control of the LGBT population much less attempting to explain that social control. 1 It is the purpose of the current article to propose and test a potential explanation for the social control of the lesbian, gay, and bisexual (LGB) population. 2
There have been many theories proposed to explain the social control of minority groups; however, none have been examined as extensively as Blalock’s (1967) theory of minority group threat. In his original formulation of his theory, Blalock proposed it would apply to any minority–majority group relationship. The majority of studies applying this theory, however, have focused on the social control of the African American community (Bobo & Hutchings, 1996; Eitle, D’Alessio, & Stolzenberg, 2002; Stults & Baumer, 2007). Recently, research has expanded this theory to apply to the social control of the Hispanic population (Stacey, Carbone-Lopez, & Rosenfeld, 2011) as well as to religious minorities (King & Brustein, 2006; King & Weiner, 2007). As such, there appears to be support for Blalock’s claim that his theory should apply to any minority–majority group relationship. The question to be examined here, however, is whether Blalock’s theory of minority group threat will apply to sexual minority–majority relationships, especially the LGB population.
Minority Group Threat
Original Formulation
In its original formulation, the theory of minority group threat consisted of three primary hypotheses. First, Blalock (1967) asserted that as the size of the minority group grew, the majority would feel threatened and would act to reduce that threat. The means of threat reduction, which was the focus of Blalock’s original exposition of the theory was discrimination; however, since his original statements were made, many researchers have extended this theory to other forms of social control, both formal such as arrest (Parker, Stults, & Rice, 2005) and prosecution (King, 2008) and informal such as hate crime (King, 2008; Stacey et al., 2011). The second hypothesis in Blalock’s theory of minority group threat asserts a threat to the power of the majority. Specifically, this hypothesis states that as the minority group grows in size, it will be able to assert greater authority and will thus threaten the power position of the majority. This hypothesis has since been reformulated into what is now known as political threat and suggests that it is the political power of the majority that will be threatened as the minority group becomes larger and begins to assert its own political power (Behrens, Uggen, & Manza, 2003). Finally, the third proposition in the original formulation of the theory is often referred to as economic threat. This hypothesis proposes that as a minority grows in size, it will compete with the majority for scarce resources, mostly economic in nature such as jobs and income.
In addition to the direct effects of minority group size, political power, and economic competition, Blalock (1967) and his contemporaries point toward the moderation of the effect of minority group size on discrimination and social control by the political and economic stability of the society. Blalock specifically says, in Proposition 94 of his theory, “Increases in dominant-group mobilization, resulting from increased minority mobilization and/or minority gains relative to the dominant group, are least likely under conditions of political and economic stability, general prosperity, and overall rising levels of living” (p. 189). He thus suggests that where there is greater political and economic stability, the relationship between a growing minority group and discrimination should be attenuated.
The minority group threat perspective has been examined in relation to many forms of social control. These include sentencing and imprisonment (Britt, 2000; Jacobs & Carmichael, 2001), the size of the police department (D’Alessio, Eitle, & Stolzenberg, 2004; Holmes, Smith, Freng, & Muñoz, 2008; Kent & Jacobs, 2005; Liska, Lawrence, & Benson, 1981), police brutality (Holmes, 2000; Smith & Holmes, 2003), and levels of (Jacobs, Carmichael, & Kent, 2005) or opinions about capital punishment (Baumer, Messner, & Rosenfeld, 2003).
Explaining Sexuality Bias: Expanding Group Threat
Although minority group threat has been used to examine hate crime (King, 2008; Stacey et al., 2011), it has not been assessed in relation to anti–sexual orientation bias. As such, it is the purpose of the current study to offer an expansion of the threat perspective toward sexual orientation bias. It is the assertion here that the original formulation and subsequent expansions of the theory (Jackson, 1989; Liska et al., 1981; Liska & Yu, 1992; Stults & Baumer, 2007) may not suffice in explaining sexual orientation bias.
The first hypothesis, that a growing minority group will threaten the majority, suggests that a growing LGB community may signify threat to the majority heterosexual community leading to increased animosity and bias. Although there is some question about whether there has been a significant change in the number of gay and lesbian individuals in society due to a lack of clear measures of this population, there has certainly been a growth in the visibility of the gay and lesbian population. Indeed, over the course of the past two decades, gays and lesbians have become an increasingly powerful group. Advocacy groups such as the Human Rights Campaign (HRC), the National Gay and Lesbian Task Force (NGLTF), and the Anti-Defamation League (ADL) have worked to promote equal rights for all regardless of sexual orientation. States are faced with a growing demand from their LGBT community for equal protection under the law (West, 1998). Sexual orientation has been added to national laws protecting employment rights, voting rights, as well as the federal hate crime statutes (Barnard & Downing, 1999). If the political threat hypothesis is correct, the mobilization of the LGBT community around these political issues will pose a threat to the majority group, in this case, heterosexuals. Evidence of this political threat abounds in the discussion surrounding the issue of gay marriage, with conservative and religious groups claiming that gay marriage threatens the very foundation of marriage and the family (Stacey, 1996). 3
Blalock’s (1967) third mechanism through which minority threat should manifest is economic competition. Indeed, Christian Right leaders, specifically Tony Marco, have argued that gays and lesbians are immensely wealthy. He suggested,
Homosexuals claim they are economically, educationally and culturally disadvantaged. Marketing studies refute those claims. Homosexuals have an average annual household income of $55,430, versus $32,144 for the general population and $12,166 for disadvantage African-American households. (Marco, 1992)
However, these statistics come from a survey done by the Wall Street Journal in 1991, and are thus likely skewed toward those individuals who are readers of the publication. In fact, research suggests that Marco’s statements are not entirely correct. Allegretto and Arthur (2001), in a comparison of heterosexual with homosexual male earnings, concluded that homosexual men make considerably less than their heterosexual counterparts. Likewise, Black, Makar, Sanders, and Taylor (2003) found that homosexual men make about 15% less than heterosexual men; however, the researchers also determined that homosexual women make over 20% more than their heterosexual counterparts. In addition to the research on the wage gap between homosexual and heterosexual men and women, research has examined whether sexual orientation plays a role in the hiring process. Unlike race and gender, gay and lesbian individuals are not protected from discrimination in employment in most states (Holmberg & Smith, 2014). 4 Research on discrimination in employment has shown that if the sexual orientation of the individual is known, the prospective employer may be less inclined to hire that individual (Ahmed, Andersson, & Hammarstedt, 2013; Badgett, 1995; Elmslie & Tebaldi, 2007; Tilcsik, 2011).
As with other assessments of the minority group threat perspective, there are likely other forms of threat that apply specifically to the LGB community and should thus be assessed. First, religion’s definition of homosexuality as “an abomination” is the root of the social climate that leads to discrimination of gays and lesbians (Herek, 1990; Herek & Capitanio, 1996). This social climate is evidenced by the arguments made by Conservative Christian groups around issues of gay and lesbian relationships to and influence over children (Briggs, 2012; Perry & Whitehead, 2015). Specifically, questions exist over whether gays and lesbians should be able to adopt children, teach in primary and secondary schools, or even be portrayed by mainstream media. There is an assumption underlying each of these issues in which homosexuality is capable of corrupting, or is contagious, and thus may rub off on those individuals (children) over whom the gay or lesbian person has influence (Clarke, 2001; McLeod, Crawford, & Zechmeister, 1999; Regenerus, 2012).
Although this moral argument is based on more than just religion, its foundation is in religion. The view of homosexuality as being depraved, or corrupting, comes from a literal interpretation of the Bible. As such, it is expected that these moral arguments, this anti-gay/lesbian social climate, may be more pronounced in areas that are highly religious, and more specifically religiously conservative. This hypothesis will be referred to as religious threat.
In addition, it has been suggested by the anti-gay marriage campaigns (Brumbaugh, Sanchez, Nock, & Wright, 2008) that homosexuality threatens the foundation of marriage and the family. Given this perception that same-sex relationships somehow threaten the stability of heterosexual relationships and “traditional” families (Kavanagh, 2009), it may also be the case that where there is a perception of a threat to “traditional” marriage and family, there is increased animosity toward the gay and lesbian population. Indeed, research on minority group threat often finds that it is the perception of the threat that matters, rather than the actual threat posed (King & Wheelock, 2007). Although religious threat and the threat to “traditional” families have not been used to define mechanisms of threat previously, it is possible that these mechanisms are important to the understanding of the social control of sexual orientation minorities, a possibility explored here.
Prior Research Examining Sexual Orientation Bias
The majority of research on sexual orientation hate crime, as with hate crime in general, has been at the individual level (Berrill, 1992; Comstock, 1991; Herek, Cogan, & Gillis, 2002; Stacey, 2011). This examination of sexual orientation as a motivation for victimization at the individual level has not translated to the macro level. However, two studies have been conducted in this area. The first conducted by Green, Glaser, and Rich (1998) adds credence to the assumption that there is little relationship between the economic conditions in an area and anti-gay/lesbian hate crime. Specifically, Green, Glaser, and Rich (1998) found that monthly total unemployment rates are not significantly related to anti-gay/lesbian hate crime in New York City from January 1987 to December 1995. The second, conducted by Green, Strolovitch, Wong, and Bailey (2001), assessed the relationship between the density of the gay and lesbian population and hate crime against those groups in the five boroughs of New York City, finding strong correlations between population density and hate crime. This study was limited, however, to the examination of a single city.
To assess whether minority group threat can be expanded to examinations of sexual orientation bias and increase understanding of sexual orientation hate crime, the current study uses a large sample of jurisdictions from all regions of the United States. Using data from multiple sources, it is possible to assess whether minority threat, economic threat, political threat, religious threat, and the threat to “traditional” marriage explain the social control of sexual orientation minorities.
Method
Sources and Sample
To examine the relationship between minority group threat in its original formulation and the extended hypotheses proposed here to sexual orientation hate crime, data have been drawn from five sources. First, the Uniform Crime Reports (UCR) Hate Crime Statistics Program provides information on the number of reported hate crimes by bias motivation from 2005 to 2012. Hate crimes are rare occurrences and do not happen everywhere; as such, it was necessary to combine multiple years of data to obtain a large enough sample of cases with sexual orientation bias crimes for the current analysis. Second, the UCR 5 itself is utilized to provide additional crime information. In addition, data on the social, structural, and economic characteristics of the counties are drawn from the 2000 and 2010 Decennial Census. The Association of Religion Data Archive’s (ARDA) Religious Congregations and Membership study conducted every 10 years provides information on the religious population of the counties. Finally, political data were coded by the researcher to assess the potential political threat that the minority population may pose.
Due to the nature of the Hate Crime Statistics Program, specifically the voluntary reporting aspect of the program, not all jurisdictions in the United States report hate crimes to the program. In addition, of those that do report, the majority report zero hate crimes annually. In an effort to capture as much variation as possible, data from the 2005 to 2012 reports were combined. This resulted in a sample of 1,739 counties that reported to the UCR Hate Crime Statistics Program from 2005 to 2012. Due to missing data on some of the predictors, 22 cases were dropped from the initial models through listwise deletion, along with an additional five cases 6 in the final model presented below.
Dependent Variable
To assess whether the extended minority group threat theory proposed here is related to sexual orientation bias, the dependent variable represents the number of anti- LGB bias crimes reported in the sampled counties from 2005 to 2012. Although the UCR counts the number of sexual orientation bias crimes based on anti-heterosexual bias as well, given the focus here on perceived minority threat on the part of the majority, only those crimes in which the minority group, here homosexual and bisexual individuals, were victimized are included.
Predicting Minority Group Threat
Given Blalock’s (1967) prediction that it is the change in demographics over time that will lead to a perceived threat, many of the predictors of minority group threat represent those temporal changes in the social, structural, and political context of the county. First, Blalock conceived of minority group threat itself as a change in the size of the minority population. Although there are no known comprehensive sources of data on the number of LGB individuals in the United States, the Decennial Census includes a proxy indicator that has been utilized in prior research (Black et al., 2000; Green et al., 2001). This proxy measure represents the percentage of same-sex unmarried-partner households. To capture the change in this measure over time, change was calculated using data from the 2000 and 2010 Decennial Census. 7 As such, the measure of minority group threat represents the change in the LGB population from 2000 to 2010.
Political threat is measured in two ways. First, an indicator of overall political power of the minority group is included representing the level of LGB political power. This measure is calculated as the number of civil rights and other anti-discrimination laws present in the state in which the county resides. 8 These civil rights are provided at the state level and are thus coded at this level on a scale from 0 to 8 representing the degree to which laws and protections are in place. The laws and rights assessed include the following: gay marriage (counted as zero where prohibited, one where some marriage rights are provided, two where equivalent rights are provided, and three where same-sex marriage is legal), adoption laws (including provisions for both joint and second-parent adoption), anti-bullying statutes, hate crime laws including sexual orientation as a protected category, and protections against discrimination in public accommodations, employment, and school. In addition, to assess whether a change in political power over time influences the treatment of sexual orientation minorities, an indicator of the change in LGBT political power was calculated. This measure represents whether a change in the number of civil rights and other anti-discrimination laws occurred during the study period (2005-2012), and is coded 1 if there was a change and 0 if there was no change during this period.
To test the economic threat hypothesis, the Decennial Census data provides a number of potential indicators of the state of the economy. For the purpose of this analysis, economic threat is measured as the change in the percent unemployed. Although this measure only provides for overall economic conditions, there are no known data sets available that approximate the economic capacity of the LGB population at this level of analysis (i.e., county). It is likely, however, that if the state of the economy influences the reporting of anti-LGB bias crimes, it has less to do with the actual economic influence of the population and more to do with the overall economic position of the county.
In addition to testing the traditional minority group threat framework as it applies to the reporting of anti-LGB bias crimes, the two additional hypotheses proposed above must also be tested. Thus, religious threat is measured as the change in the rate of evangelical adherence from 2000 to 2010 using data from the ARDA’s Religious Congregations and Membership study. Religious adherents include “all full members, their children, and others who regularly attend services or participate in the congregation” (ARDA, 2001). The analysis was limited to evangelical 9 religious groups because not all religious groups have the same opinion of homosexuality. On the contrary, it is expected that the most conservative Christian groups, those that believe in a literal interpretation of the Bible and those that are most committed to their faith, will be the most likely to feel threatened by the increased policy attention paid to gay and lesbian issues in the past 20 years. Evangelical congregations generally represent these more conservative groups. These evangelical congregations are defined as those that “have typically sought more separation from the broader culture, emphasized missionary activity and individual conversion, and taught strict adherence to particular religious doctrines” (Steensland et al., 2000). Finally, a potential threat to the “traditional” family is measured using a proxy in the form of the change in the percentage of married couple households with kids (family households) from 2000 to 2010. If there is a threat to the “traditional” family, this measure, which approximates the change in the number of so-called “traditional” families in the United States, should coincide with an increase in the number of anti-LGB bias crimes reported.
Controls
Three controls are also included in the models examining the relationship between minority group threat and reported anti-LGB bias crime. These controls include indicators often seen in research on minority group threat, including the change in the percentage of the population that is Black and the change in the percentage of the population that is of Hispanic origin. These two measures control for the potential of perceived threats coming from other minority populations that may spill over into anti-LGB bias. Finally, the average index crime rate from 2005 to 2012 is included to account for the possibility that the reporting of hate crimes is more prevalent in places with more crime generally.
Analysis
To assess whether the expanded version of minority group threat posited above explains the number of reported anti-LGB bias crimes in a county, it was necessary to utilize a count modeling structure. Due to the over-dispersion present in the models, a negative binomial regression function was selected; however, as stated previously, hate crime generally and sexual orientation hate crime in particular are very rare events. As a result of this rarity, a large number of counties (about 46%) reported zero anti-LGB bias crimes from 2005-2012 necessitating the use of a zero-inflated model. Thus, the models presented below include two portions. The first is a logistic regression model predicting whether a case is a true zero and the second a negative binomial regression model predicting the number of anti-LGB bias crimes in the county. Variables included in the negative binomial model are those discussed previously as well as an exposure term. This exposure term serves to allow for the interpretation of the results as rates, and represents the natural log of the overall size of the LGB population in 2010. The coefficient for the exposure term is constrained to 1 by the model.
For the purpose of the logistic regression model, it was necessary to determine what factors may influence whether a county has no anti-LGB bias crimes. For this purpose, four predictors have been included in these models. The first is the proxy for the size of the LGB population. It is expected that where there are few LGB individuals, there will be few anti-LGB bias crimes. Although some theories (see Green, Strolovitch, & Wong, 1998) may see a few minority individuals as being particularly vulnerable, Blalock (1967) proposes that the vulnerability does not occur until the minority is larger. Likewise, a control for the overall number of hate crime cases reported in the jurisdiction is included. Where there are no or few hate crimes generally, there will be no or few anti-LGB bias crimes. In addition, a control for whether the state in which the county is located included sexual orientation as a protected category (which is included in the scale for LGB political power) is included to control for jurisdictions in which anti-LGB bias crimes may not be criminalized. Finally, a control for region in the United States is included in these models to account for any regional variation in culture or structure that may not be present in the models.
The findings of the analysis are presented next starting with a description of the sample.
Results and Discussion
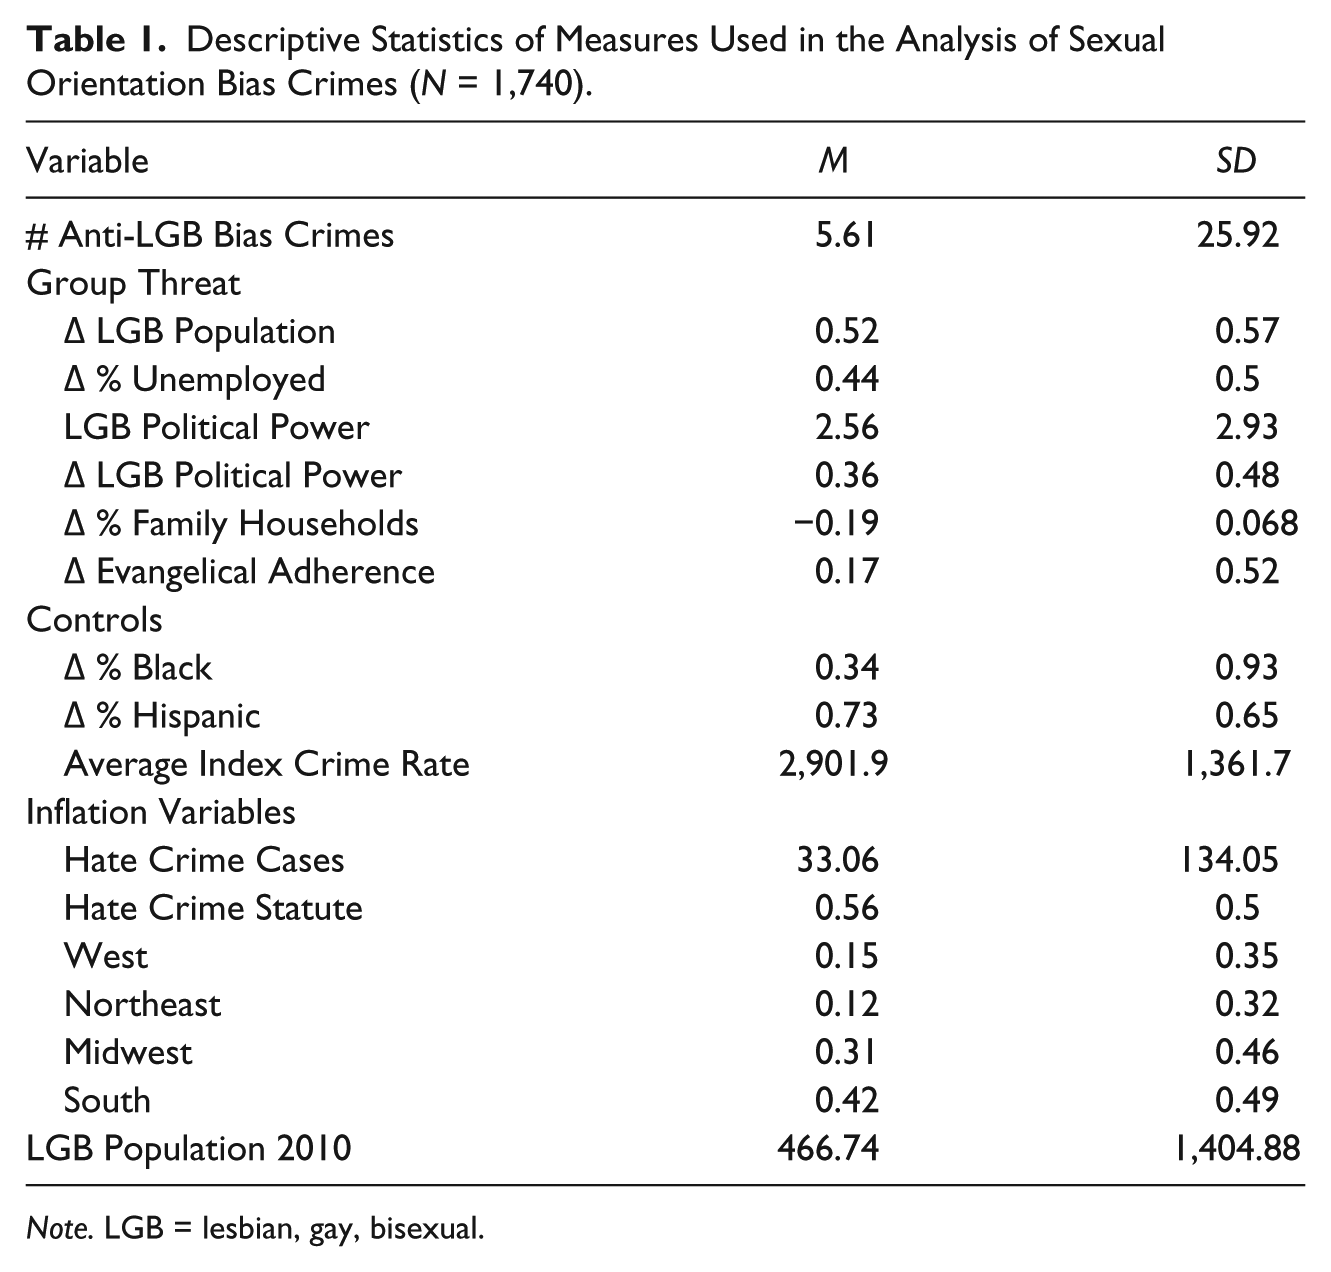
The descriptive statistics for the measures used in the analysis are presented in Table 1. These statistics show that there is considerable variation in the number of anti-LGB bias crimes reported among the sample as well as in the predictors. The average number of anti-LGB bias crimes reported from 2005 to 2012 by the counties in the data set is 5.61 (ranging from 0 to 643). 10 As noted, counties in the sample heavily reported zeros, which likely pulls the average down. Among those counties that reported any anti-LGB bias crimes, the average number reported is 10.4 cases (not shown). 11
Descriptive Statistics of Measures Used in the Analysis of Sexual Orientation Bias Crimes (N = 1,740).
Note. LGB = lesbian, gay, bisexual.
Among the predictors of group threat, the average change in the percentage of the population that is LGB from 2000 to 2010 was .52 (average of .43 in 2000, .61 in 2010), suggesting substantial growth in the population of same-sex unmarried partner households during this 10-year period. Likewise, the unemployed population increased during this time period, with an average change of .44 (average of 3.47 in 2000, 4.68 in 2010). LGB political power also grew from 2005 to 2012, with an average change of 2.56, and 36% of counties in the sample reside in states that changed their policies during this time period. However, the percentage of family households decreased a factor of 19 from 2000 (M = 23.85%) to 2010 (M = 19.31%), while the evangelical adherence rate changed by a factor of 0.17 on average from 2000 (M = 205.39 per 1,000) to 2010 (M = 212.92 per 1,000).
As for the controls and the predictors in the logistic regression model, the Black population and Hispanic population both increased substantially during this time period. The average index crime rate was just over 2,900 per 100,000, and the average number of hate crime cases reported among the sample was 33. Approximately 56% of counties in the sample reside in states that provide protections for sexual orientation in their hate crime laws. Finally, the sample consists primarily of counties in the southern region of the United States (42%), followed by the Midwest (31%), and West (15%), with the smallest proportion of the sample in the Northeast (12%).
Table 2 presents the results of the regression models. Model 1 serves as a baseline for the negative binomial regression, in which only the controls are included in the model. None of the controls are significantly related to the number of reported anti-LGB bias crimes. This model also includes the full logistic regression equation to assess the likelihood of a county truly having zero anti-LGB bias crimes, versus only reporting a zero. The results of the logistic regression model show that the change in the percentage of the population that is LGB significantly reduces the likelihood of the county reporting a true zero. Specifically, the odds of reporting a zero decrease by 64% as the change in the LGB population increases. Likewise, as the number of hate crime cases increases, the odds of reporting a true zero decrease by 67%. In addition, counties in the West and Midwest are less likely to report true zeroes than counties in the South. Because the results of the logistic regression model do not change across the subsequent models, the remainder of the analysis will focus on the negative binomial portion of the models.
Regression of Anti-LGB Bias Crimes on Predictors, 2005-2012 (Robust Standard Errors).

Note. Standard errors clustered by state. LGB = lesbian, gay, bisexual; SE = standard error.
p < .05.
Model 2 in Table 2 presents the traditional minority group threat model. This model assesses whether the original formulation of minority group threat can be used to explain reported anti-LGB bias crimes. The results do not support the hypotheses proposed by the traditional minority group threat. In fact, the change in the minority group population is not significantly related to anti-LGB bias crimes, nor is the political power of the minority group. However, although change in percent unemployed and change in political power are significant, they are both negative, suggesting that where there is a growing portion of the population who are unemployed and where there has been a change in the political power of the minority group, there are fewer anti-LGB bias crimes reported. Indeed, a change in the political power of the minority group results in a 45% decrease in the number of anti-LGB bias crimes. It is possible that instead of a change in the political atmosphere resulting in the majority viewing this population as a threat, the changing political power of the minority results in greater acceptance and tolerance. Or perhaps, a greater level of acceptance and tolerance could lead to a growth in the political power of the minority. Along these lines, a possible explanation could be drawn from the contact hypothesis (Binder et al., 2009; Gaertner, Dovidio, & Bachman, 1996), which proposes that the more positive contact or exposure a prejudiced person has to someone in the minority group, the less animosity they will feel. Changes to laws and rights are typically preceded by an increase in media attention of these issues. Perhaps this increased exposure to these issues leads to less animosity toward the minority among the majority.
The final model (Model 3) in Table 2 presents the complete minority group threat model proposed previously. There are three interesting things to note in this model. The first is that like Model 2, change in the size of the minority population is not significantly related to the number of reported anti-LGB bias crimes. However, the overall political power of the minority becomes significant in this model although the magnitude of the effect is small. Counties where there is a higher level of political power for LGB individuals report approximately 6% more anti-LGB bias crimes. This is consistent with the minority group threat hypothesis. Finally, although change in evangelical adherence is not significantly related to reported anti-LGB bias crime, change in percentage of family households is significant and negative. Indeed, a decrease in the change in percentage of married couple households with kids increases the number of reported anti-LGB bias crimes by a factor of 0.122 (or 88%). This is consistent with the hypothesis that there will be more animosity toward the LGB population where there is a perceived threat to the “traditional” family.
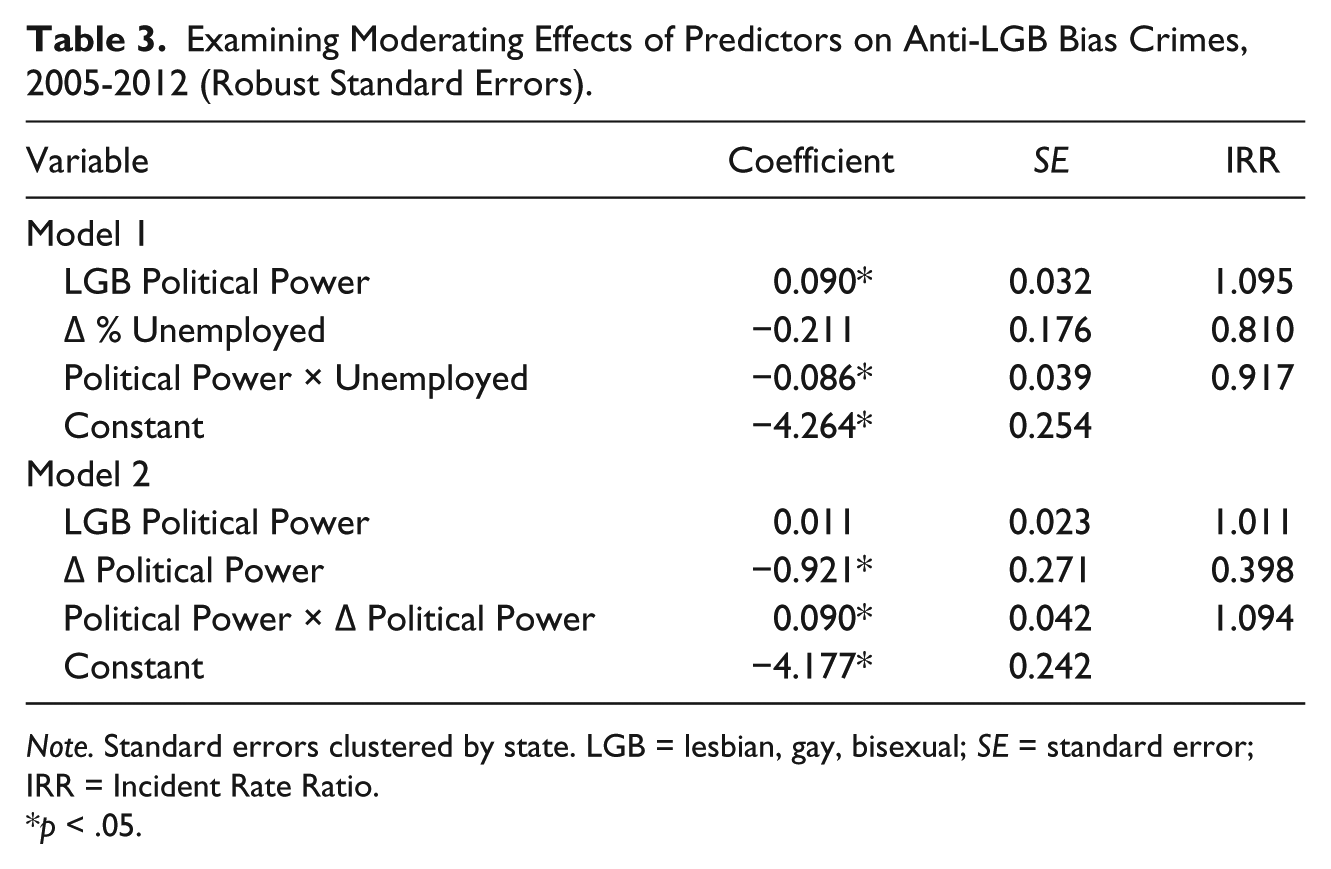
In examining whether minority group threat explains animosity toward the LGB population, it is also necessary to consider whether the different types of threat work together. Among others, Blalock clearly suggests that there will be a moderating effect of economic threat where there is a small minority group population. Likewise, he suggests that political threat will have a differential impact depending on the size of the minority population. Although Blalock does not propose that the sources of threat will have an effect on each other, given that research on politics has found a relationship between political climate and economics (Alesina & Rodrik, 1994; Campello, 2014), it is certainly possible that these sources of threat, beyond just population size, could moderate each other. To assess whether these moderating effects exist in relation to LGB prejudice, a series of interaction terms 12 were examined. Two of these interactions were significant (results presented in Table 3). The first examined whether the effect of economic threat is moderated by the political strength of the minority group. The interaction term is significant and negative, suggesting that the negative effect of the economy on anti-LGB bias crimes decreases by 9% where the minority group has more political power.
Examining Moderating Effects of Predictors on Anti-LGB Bias Crimes, 2005-2012 (Robust Standard Errors).
Note. Standard errors clustered by state. LGB = lesbian, gay, bisexual; SE = standard error; IRR = Incident Rate Ratio.
p < .05.
The second of the two significant interaction terms examines whether the effect of the overall political power in the county is moderated by whether there was a change in that political power over time. The interaction term is significant and positive, suggesting that where political power is strong, a change in that power will have an even stronger negative effect on reported hate crime. This suggests that a change to the political power of the minority where the minority is relatively weak will have less of an effect on animosity toward the minority than will a change where the minority group is strong. This is contrary to the political threat hypothesis.
Conclusion
Although there has been substantial research on minority group threat with regard to racial and ethnic minority groups, it was the aim of this study to further explore the relationship between threat and social control, by proposing an expansion of the minority group threat framework to sexual orientation minority–majority relationships. The results of the analysis are mixed, with the findings generally showing little support for the original formulation of the minority group threat theory and only one of the proposed expanded hypotheses showing a significant relationship.
Specifically, the economic threat hypothesis does not seem to be supported, with growth in unemployment leading to a decrease in hate crimes reported against sexual orientation minorities. It is possible, however, that LGB individuals do not pose an economic threat to the heterosexual majority. This is consistent with other research, which shows little relationship between economic threat and hate crime in other populations (Green et al., 2001). The political threat hypothesis, however, does show some support. Where the minority group has more power, there are more reported hate crimes. However, the change in political power is inversely related to reported hate crime. In fact, the analysis suggests that a strong and growing minority will result in fewer hate crimes than a strong but stagnant minority. It is possible that the growth in the minority’s political power here is the result of a growth in the approval of homosexual relationships and is thus not a signifier of threat, but rather of greater acceptance on the part of the majority. Indeed, recent research shows a change in the culture of prejudice toward gay and lesbian relationships (Breen & Karpinski, 2013; Morrison & Morrison, 2002). Future research should examine more closely the growth in gay and lesbian political power to determine whether it is indicative of less animosity toward this group.
Of the two proposed expansions to the minority group threat framework, only the threat to “traditional marriage” was supported. This finding should be interpreted with caution, however, given that a proxy measure, the change in the percentage of households that are married couples with kids, was used. This suggests that where there are decreasing numbers of traditional families, there are more anti-LGB bias crimes reported. It is possible that, as suggested here, this threat to a traditional marriage is motivating the social control of this minority group. An alternative interpretation, however, is that where traditional families are lessening, there is a greater level of frustration, which could lead to more minority group bias. Future research should endeavor to find a direct measure of threat to traditional marriage. In particular, future research should examine whether the rhetoric surrounding the gay marriage and gay rights debate in general with regard to this so-called threat to traditional marriage/family increases animosity toward the LGB population.
Although the findings presented here with regard to the relationship between minority group threat and sexual orientation bias are mixed, the results should be interpreted with caution. As with any study of crime, there are a few limitations to the data utilized here. The reliance on UCR limits the generalizability of the study to only those counties that report to the Hate Crime Statistics Program. Likewise, the use of official crime data limits the analysis to those crimes that come to the attention of the police. In addition, the reliance on proxy measures for some of the minority group threat indicators may have affected the results. Future research should attempt to locate more direct measures of minority group threat and the expansions proposed here. Finally, although hate crime has been defined in prior research as a form of informal social control, there are many additional areas in the study of social control of sexual orientation minorities that may be of interest in future research, such as the evolution of laws governing the treatment of sexual orientation.
Although Blalock (1967) asserted that minority group threat can be applied to any minority–majority group relationship, few expansions of the theory beyond race and ethnicity have been attempted. The results presented here suggest a need for further examinations of the way that threat may affect other minority–majority relationships, and the mechanisms through which that threat may be controlled. Threat may manifest in particular ways when dealing with sexual orientation bias that are distinct from race, ethnicity, or even religion.
Footnotes
Declaration of Conflicting Interests
The author(s) declared no potential conflicts of interest with respect to the research, authorship, and/or publication of this article.
Funding
The author(s) received no financial support for the research, authorship, and/or publication of this article.