




Abstract
Retrospective studies using adult self-report data have demonstrated that adverse childhood experiences (ACEs) increase risk of violence perpetration and victimization. However, research examining the associations between adolescent reports of ACE and school violence involvement is sparse. The present study examines the relationship between adolescent reported ACE and multiple types of on-campus violence (bringing a weapon to campus, being threatened with a weapon, bullying, fighting, vandalism) for boys and girls as well as the risk of membership in victim, perpetrator, and victim–perpetrator groups. The analytic sample was comprised of ninth graders who participated in the 2013 Minnesota Student Survey (n ~ 37,000). Multinomial logistic regression models calculated the risk of membership for victim only, perpetrator only, and victim–perpetrator subgroups, relative to no violence involvement, for students with ACE as compared with those with no ACE. Separate logistic regression models assessed the association between cumulative ACE and school-based violence, adjusting for age, ethnicity, family structure, poverty status, internalizing symptoms, and school district size. Nearly 30% of students were exposed to at least one ACE. Students with ACE represent 19% of no violence, 38% of victim only, 40% of perpetrator only, and 63% of victim–perpetrator groups. There was a strong, graded relationship between ACE and the probability of school-based victimization: physical bullying for boys but not girls, being threatened with a weapon, and theft or property destruction (ps < .001) and perpetration: bullying and bringing a weapon to campus (ps < .001), with boys especially vulnerable to the negative effects of cumulative ACE. We recommend that schools systematically screen for ACE, particularly among younger adolescents involved in victimization and perpetration, and develop the infrastructure to increase access to trauma-informed intervention services. Future research priorities and implications are discussed.
Youth violence continues to be a public health concern in the United States. Although youth (10-18 years old) comprise less than 12% of the population, they are offenders in approximately 25% of all violent victimizations and are twice as likely as adults to be victims of violent crimes (Baum, Archer, Forbey, & Handel, 2009, Finkelhor, Turner, Ormrod, Hamby, & Kracke, 2009; Office of Juvenile Justice and Delinquency Prevention, U.S. Department of Justice, Office of Justice Programs, 2000). The highest rates of youth violence are school based, with nearly 1.5 million nonfatal, on-campus injuries reported in 2013 (Finkelhor, Turner, Shattuck, & Hamby, 2015; Perlus, Brooks-Russell, Wang, & Iannotti, 2014; Robers, Kemp, Rathbun, Morgan, & Snyder, 2014; Youth Risk Behavior Survey [YRBS], 2013). Since then, there has been a decrease in the prevalence of weapon carrying and students’ skipping school due to safety reasons, but no decline in bullying, being threatened by a weapon at school, or fighting on school property (YRBS, 2015). Research has begun to examine the relationship between adverse childhood experiences (ACEs) and adolescent violence (Duke, Pettingell, Mcmorris, & Borowsky, 2010; Finkelhor, Ormrod, & Turner, 2007; Ford et al., 2011; Hong & Espelage, 2012), yet much of this work has focused on a specific ACE, one dimension of violence (victimization or perpetration), or a single type of behavior (e.g., intimate partner violence, bullying, fighting), despite evidence that ACE co-occur and may be associated with multiple dimensions and types of on-campus violence. Therefore, the present study investigates the associations between child-reported, cumulative ACE and several forms of school-based violence and violence-involved subgroups (victims only, perpetrators only, victims–perpetrators) among a population-based sample of students.
Surveillance data indicate that approximately 8% of students have been threatened with a weapon, more than 5% have brought a weapon to school, and between 16% and 28% are involved in bullying (Robers et al., 2014; YRBS, 2013). Although boys are more likely to be both victims and perpetrators (Esbensen, Peterson, & Taylor, 2011; Spriggs, Iannotti Nansel, & Haynie, 2007), recent meta-analyses suggest considerable variability in violence victimization and perpetration across different forms of violence, especially bullying (Archer, 2004; Card, Stucky, Sawalani, & Little, 2008). A few studies suggest no differences in risk of bullying by gender (Barboza et al., 2009); others report greater risk of relational bullying for girls (Crick, Casas, & Nelson, 2002), no gender differences (Goldstein, Young, & Boyd, 2008), and that boys are at greater risk of physical bullying than girls (Carbone-Lopez, Esbensen, & Brick, 2010). Thus, investigating whether gender moderates the association between one domain of risk (e.g., family) and school-based violence involvement, including bullying, will help disentangle these relationships and yield useful information for prevention efforts.
ACEs were identified as the set of traumatic stressors that, when experienced prior to age 18, negatively affected numerous behavioral and health outcomes among adults (Brown et al., 2009; Felitti et al., 1998). In studies using retrospective, adult self-report data, ACEs were a key component in the etiology of interpersonal violence (Miller et al., 2011; Roberts, McLaughlin, Conron, & Koenen, 2011), criminality (Reavis, Looman, Franco, & Rojas, 2013; Rossegger et al., 2009), anxiety (Edwards, Holden, Felitti, & Anda, 2003), depression (Brown et al., 2009; Chapman et al., 2004), and substance use (Allem, Lisha, Soto, Baezconde-Garbanati, & Unger, 2013; Dube et al., 2003), outcomes frequently also reported by adolescents and adults involved in bullying or delinquency (Anda et al., 2006; Shonkoff & Garner, 2011). Despite evidence of this shared, root origin of violence-related health issues, research has yet to fully describe the relationship between child-reported ACE and in-school violence perpetration and victimization concurrently (Anda et al., 2006; Finkelhor, Turner, & Hamby, 2012).
The evidence surrounding the relationship between ACE and adolescent violence involvement by gender also needs further clarification. Some studies have found females and males with a history of maltreatment more likely to be violent or delinquent than those without such exposure, whereas others have found that maltreatment increases risk of violence for boys, but not girls (Duke et al., 2010; Teague, Mazerolle, Legosz, & Sanderson, 2008; Widom & Maxfield, 2001). These inconsistencies likely reflect the use of diverse assessment tools, school climates, and samples; however, many studies have focused on a specific form of maltreatment (e.g., sexual abuse or physical abuse) or select aspect of household dysfunction (e.g., parental substance use, parental incarceration), and one type of violence (e.g., intimate partner violence, assault, bullying), masking the complexity of these relationships. In other words, maltreatment and family dysfunction often co-occur, and children exposed to one form of victimization (e.g., physical abuse) experience other types of maltreatment (e.g., verbal abuse) or household dysfunction (e.g., parental substance use) (H. A. Turner, Finkelhor, & Ormrod, 2010) such that one ACE may actually represent multiple ACE experienced simultaneously, but not measured. In fact, the evidence overwhelming suggests that the likelihood of poor outcomes increases as the number of ACE experienced increases (Allem et al., 2013; Anda et al., 2006; Shonkoff & Garner, 2011).
The present study has three primary objectives. First, it describes the prevalence and ACE-based risk of membership for subgroups of violence involvement: victim only, perpetrator only, and victim–perpetrator groups (Juvonen, Graham, & Schuster, 2003; Kaltiala-Heino, Rimpelä, Rantanan, & Rimpelä, 2000). Second, by operationalizing cumulative ACE—representing the degree of risk exposure in the family including maltreatment (sexual, physical, and verbal abuse) and family dysfunction (parental alcohol and drug use/misuse, parental intimate partner violence, parental incarceration)—we examine whether increases in family risk are associated with increased probability of several types of on-campus violence involvement. Third, we assess whether ACE-based risk profiles are differentially associated with each form of school-based violence victimization and perpetration that are typically assessed in the United States (e.g., relational and physical bullying, theft or vandalism, weapons-related events, and fighting) for boys and girls. Because violence involvement prior to age 15 is a marker for higher risk of adult psychopathology, depression, and substance use than involvement at age 17 or older (DeWit, Adlaf, Offord, & Ogborne, 2000; McGue & Iacono, 2005), we focus on ninth graders. We hypothesized that increases in ACE would be associated with an increase in the probability of (H1a) perpetrating physical and relational bullying, (H1b) carrying a weapon to school, (H1c) initiating physical fights, (H2a) being a victim of physical and relational bullying, (H2b) being a victim of theft (or vandalism), and (H2c) being threatened with a weapon at school. Due to inconsistent findings in the literature, we did not test a priori hypotheses regarding the associations between ACE and school violence by gender or ACE and risk for victim, perpetrator, or victim–perpetrator groups.
Method
Data were from the 2013 Minnesota Student Survey (MSS), a comprehensive, anonymous, in-school survey administered every 3 years to students throughout Minnesota. The MSS assesses school and family characteristics, peer relationships, bullying, interpersonal violence, and other health-related behaviors. Of the 334 operating public school districts that were invited to participate in the survey, 280 (84%) agreed. Administration was coordinated by schools/districts in formats that were most appropriate at each school. Paper-and-pencil and electronic administration modalities were offered, with 65% of schools electing to use paper-and-pencil surveys and 35% of schools administering online versions; survey items were identical in each modality. Student participation was voluntary, with approximately 69% of ninth graders providing assent, parental consent, and participating (Oehrlein & Kinney, 2013). The Institutional Review Board at the University of Minnesota deemed this secondary analysis of MSS data exempt from review.
Measures
ACEs
Six items were used to assess family-based ACE. Household substance use was comprised of two questions: “Do you live with anyone who drinks too much alcohol?” and “Do you live with anyone who uses illegal drugs or abuses prescription drugs?” Affirmative responses were classified as living in a household where someone uses substances. Verbal abuse was measured with one item: “Does a parent or other adult in your home regularly swear at you, insult you, or put you down?” “Has a parent or other adult in your household ever hit, beat, kicked, or physically hurt you in any way?” assessed exposure to physical abuse, and “Have your parents or other adults in your home ever slapped, hit, kicked, or punched or beat each other up?” measured exposure to parental intimate partner violence. Familial sexual abuse was assessed with “Has any older or stronger parent or member of your family ever touched you or had you touch them sexually?” and having an incarcerated parent was measured by one question that asked, “Have any of your parents or guardians ever been in jail or prison?” Response options were no = 0 or yes = 1. Affirmative responses to the six items were summed to calculate a composite score of ACE ranging from 0 to 6.
Relational Bullying Victimization and Perpetration
Relational bullying victimization was assessed with two items assessing how often in the last 30 days other students “spread mean rumors or lies about you” and “excluded you from friends, other students, or activities?” Two parallel items assessed relational bullying perpetration. Response options were “never,” “once or twice,” “about once a week,” “several times a week,” and “every day.” The two categories, relational bullying victimization and bullying perpetration, were coded 1 if respondents selected “once or twice” or more and coded 0 if respondents answered “never.”
Physical Bullying Victimization and Perpetration
Victimization and perpetration of physical bullying were assessed with one item each: “How many times in the last 30 days have other students/YOU at school pushed, shoved, slapped, hit or kicked you when they weren’t kidding?” Response options were “never,” “once or twice,” “about once a week,” “several times a week,” and “every day.” The physical bullying victimization and bullying perpetration variables were coded 1 if respondents selected “once or twice” or more to any of the behaviors and coded 0 if respondents answered “never.”
Victim of Theft or Destruction of Personal Property
This item asked, “During the last 30 days, how many days have other students at school stolen or deliberately damaged your property such as clothing, books, or car?” Response options ranged from 0 to 6 or more days, and were coded 0 for “never” or 1 for “being a victim of theft or vandalism” in the last 30 days.
Being Threatened With a Weapon
This question asked students, “How many times in the last 30 days have other students at school threatened or injured you with a weapon?” Response options ranged from 0 to 6 or more days with a response of zero days coded 0 (not threatened), 1 or more days was coded 1 (threatened).
Bringing a Weapon to School
Students indicated how many days in the last 30 they carried “a weapon such as a gun, knife, or club ON SCHOOL PROPERTY?” Response options ranged from 0 to 6 or more days. The variable was coded 1 if participants reported carrying a weapon to school for any number of days in the past 30 days and coded 0 if they never carried a weapon.
Initiating Physical Fights
This item asked students, “During the last year, how many times did you start a fight two or more times?” Response options were coded as 1 (at least two fights) and 0 (no fights).
Victim Only, Perpetrator Only, Victim–Perpetrator Classification
Responses to the violence measures were further classified into four mutually exclusive groups: no victimization or perpetration (0); any victimization, but no perpetration (1); any perpetration, but no victimization (2); and both victimization and perpetration (3).
Demographic Covariates
Age was measured in years, and race/ethnicity was defined as Latino/Hispanic, non-Hispanic Black/African American/African, non-Hispanic Asian/Pacific Islander, non-Hispanic American Indian/Native American, and multiple race/ethnicities, with non-Hispanic White as the reference group. Family structure was classified as living with two biological parents (1) versus any other adults (0). Poverty status was operationalized as having two or more indicators of poverty (homelessness, qualifying for free/reduced price lunch, skipped meals due to lack of money) versus less than two. To avoid confounding, we adjust for internalizing symptoms in our models. Internalizing symptoms were measured with cut-points coded as prescribed by authors of the Global Appraisal of Individual Needs (GAIN) short form (Dennis, Chan, & Funk, 2006).
Analyses
Means, frequencies, and standard deviations were calculated for all variables. Multinomial regression models were used to assess the risk (e.g., relative risk ratios) of being a victim only, perpetrator only, or victim–perpetrator relative to no violence involvement for youth reporting ACE as compared with youth with no ACE.
Associations between the cumulative number of ACE and each outcome were plotted using locally weighted scatterplot smoothing (lowess), as described by Cleveland (1979). Lowess is a desirable smoothing method because it tends to follow the data. Each outcome was then regressed on the total number of ACE in logistic regression models that included quadratic terms to account for nonlinear relationships and covariates. To illustrate the relationship between cumulative ACE and on-campus violence, we present the change in the probability of each form of violence involvement when ACE = 0 and when ACE = 6. These changes in probability were calculated using the estimates from each multivariate analysis by simulation using 1,000 randomly drawn sets of estimates from a sampling distribution with mean equal to the maximum likelihood point estimates and variance equal to the variance–covariance matrix of the estimates, with covariates held at their mean values (King, Tomz, & Wittenberg, 2000). This analytical strategy is a five-step process: (a) draw one value of the vector
Results
Descriptive statistics for study variables are presented in Table 1. The student sample was approximately 75% non-Hispanic White and 51% female, with an average age of 14.62 years (SD = 0.53). More than 50% of students attended schools in the twin cities metro area, 60% reported living with two biological parents, and 5% reported two or more poverty indicators. Nearly 30% of the sample reported at least one ACE. The most commonly reported ACE was verbal abuse (15%), followed by physical abuse (13%), parental substance use (11%), witnessing parental intimate partner violence (7%), having an incarcerated parent (6%), and childhood sexual abuse (3%). The average number of ACE in the full sample was .54 (SD = 1.02), although among students reporting any ACE, the mean was 1.85 (1.09).
Descriptive Statistics for Ninth Graders Participating in 2013 Minnesota Student Survey.

Note. SES = socioeconomic status; SD = standard deviation.
A substantial proportion of school-based violence involves students with ACE. Among subgroups, 39% of victim only, 40% of perpetrator only, and 62% of perpetrator–victim reported family-based ACE. Among females reporting any ACE, compared with females with no ACE, the risk of being a victim only, perpetrator only, and victim–perpetrator relative to no violence involvement was 1.58 (99% confidence interval [CI] = [1.47, 1.71]), 1.87 (99% CI = [1.65, 2.12]), and 3.40 (99% CI = [2.90, 3.99]), respectively (Figure 1). Among males with ACE, compared with males with no ACE, the risk of being a victim only, perpetrator only, and victim–perpetrator relative to no violence involvement was 2.01 (99% CI = [1.86, 2.20]), 2.23 (99% CI = [2.10, 2.47]), and 4.13 (99% CI = [3.61, 4.75]), respectively (Figure 1).
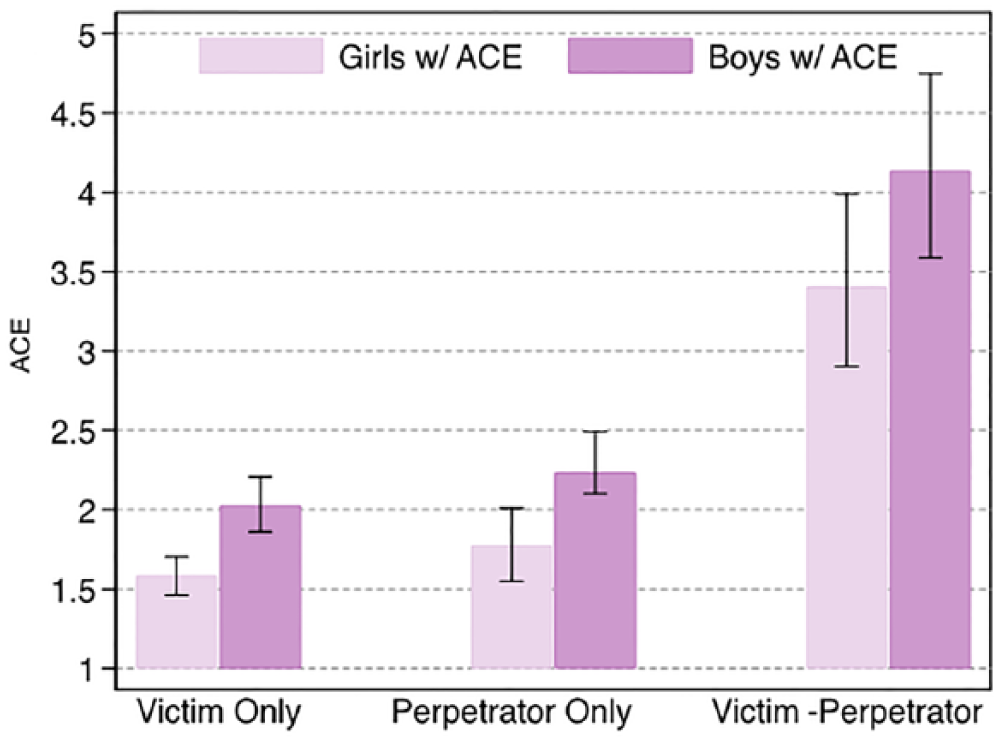
Relative risk for students with ACE, as compared with those without ACE, for subgroups of violence involvement.
We used lowess smoothing diagnostic analyses to guide assumptions about linear or curvilinear associations between independent and dependent variables. The relationship between cumulative ACE and physical bullying behavior and threat or injury with a weapon was linear for females and curvilinear among males. The association between cumulative ACE and relational bullying, weapons carrying, and being a victim of theft or vandalism was linear for both males and females.
Relational Bully Victimization and Perpetration
Increases in ACE were not associated with relational bullying perpetration for boys or girls (Figure 2b). An increase from 0 to 6 ACE, however, was associated with a 13% (95% CI = [9%, 18%]) increase in the probability of victimization for boys and a 14% (95% CI = [10%, 18%]) increase in the probability for victimization among girls (Figure 2f).

In school violence perpetration and victimization.
Physical Bullying Victimization and Perpetration
Increases in ACE were significantly associated with increased probability of physical bullying victimization for boys but not girls. Among boys, an increase from 0 to 6 ACEs was associated with a 64% (95% CI = [47%, 77%]) higher probability of bullying perpetration (Figure 2c) and a 42% (95% CI = [27%, 56%]) higher probability of being a victim of bullying (Figure 2g). Among girls, an increase from 0 to 6 ACEs was associated with a 34% (95% CI = [29%, 38%]) and a 27% (95% CI = [23%, 32%]) increase in the probability of bullying perpetration and victimization, respectively.
Victim of Theft or Vandalism
Cumulatively, an increase from 0 to 6 ACEs was associated with significant increases in the probability of being a victim of theft or vandalism for boys and girls. Among boys, an increase from 0 to 6 ACEs was associated with a 31% (95% CI = [26%, 37%]) higher probability of being a victim of theft and a 21% (95% CI = [16%, 25%]) increase among girls (Figure 2h).
Weapon Carrying at School
ACE was unrelated to weapon carrying for girls; however, an increase in ACE from 0 to 6 was associated with a 46% (95% CI = [27%, 64%]) increase in the probability of bringing a weapon to school among boys (Figure 2a).
Being Threatened With a Weapon at School
An increase from 0 to 6 ACE was associated with a 41% (95% CI = [25%, 59%]) and a 34% (95% CI = []19%, 53%]) increase in being threatened with a weapon at school for boys and girls, respectively (Figure 2e).
Discussion
The present study tested and found support for the hypothesized associations between increasing family-based ACE and violence involvement among a population-based sample of early adolescents. Consistent with national estimates, nearly 30% of students in this sample reported at least one ACE and approximately 40% experienced some form of school-based violence (Adams, 2010; Robers et al., 2014; Wallace, Goodkind, Wallace, & Bachman, 2008; YRBS, 2013). There was also considerable co-occurrence of ACE, with almost half of the students who reported any ACE experiencing more than one and 11% acknowledging over three. A notable percentage of respondents also experienced more than one form of victimization or were engaged in more than one type of perpetration. Among students reporting any victimization at school, approximately 25% reported experiencing multiple forms and 15% of perpetrators acknowledged engaging in several different types of violence. Because we assessed past 30-day behaviors (with the exception of fighting), this finding suggests that a subset of students experience several distinct types of victimization or are engaged in multiple externalizing behaviors within a relatively narrow time frame.
Compared with youth with no ACE, youth with ACE were at greater risk of membership in all three categories of violence involvement. Across groups, 39% of victim only, 40% of perpetrator only, and 63% of victim–perpetrators—an especially vulnerable group for future emotional and behavioral problems (Schwartz, 2000)—were exposed to family ACE. This is particularly compelling in that children from high risk homes who are also victimized by their peers (in contrast to only experiencing one form of victimization repeatedly) or who exhibit violent or aggressive behaviors in another context represent a subgroup of youth whose high degree of traumatic stress perpetuates a cycle of continued violence involvement and risky behavior (Shonkoff & Garner, 2011; Finkelhor et al., 2009).
We also found notable gender differences in the relationship between cumulative ACE and violence involvement. Compared with girls, with the exception of relational bullying perpetration, cumulative ACE was especially harmful for boys. Although the emotional and tangible support that girls tend to seek out in response to stress (Gomez, Holmberg, Bounds, Fullarton, & Gomez, 1999; Hunter, Boyle, & Warden, 2004) could conceivably explain the lack of association between ACE and physical bullying or relational bulling perpetration, prevention research should continue to identify potential individual-, peer-, and school-level protective factors that could be leveraged in prevention programs.
Overall, our findings illustrate that there is a graded relationship between cumulative ACE and the probability of multiple forms of on-campus victimization and perpetration that often goes undetected when researchers focus on a single factor in relation to one behavior or single class of behaviors (Finkelhor et al., 2009). The high percentage of on-campus violence that involved students with family-based ACE further substantiates arguments that maltreatment and family dysfunction undermine resilience, the capacity to ward off victimization, and enhance risk of engaging in perpetration (Finkelhor, Ormrod, & Turner, 2007; H. A. Turner et al., 2010; H. A. Turner, Shattuck, Finkelhor, & Hamby, 2015; J. B. Turner & Turner, 2013; Widom, Czaja, & Dutton, 2008). Taken together, such evidence underscores the advantage and benefits of schools taking a key role in identifying and referring youth to appropriate support services. First, schools are uniquely poised to reach, intervene, and provide referrals to large segments of the youth population. Second, if programs can effectively address the trauma associated with ACE and serve a large proportion of students involved in campus violence, these programs stand to significantly reduce the prevalence of on-campus violence. Currently, however, most schools do not screen for ACE, are not prepared to address issues of child maltreatment or family dysfunction, and implement standardized, universal programs that do not address ACE in the curriculum (Chafouleas, Riley-Tillman, Jaffery, Miller, & Harrison, 2015; Substance Abuse and Mental Health Services Administration, 2014).
Limitations
The present findings should be considered in light of several important limitations. First, we used a school-based sample of students attending public schools in Minnesota that may not include the highest risk youth. Second, we used a cross-sectional data set that does not support causal claims; however, it is unlikely that involvement in school-based violence is a primary cause of maltreatment or family dysfunction. Third, we were not able to anchor the timing of ACE to any specific time frame in childhood. Fourth, the MSS only includes six of the originally developed ACE measures; however, these items are consistent with studies that have conceptualized maltreatment and family dysfunction based on ACE. Fifth, violence involvement is limited to events that occur on school campuses. Sixth, although our models adjust for socioeconomic status and race–ethnicity, future research should consider the variability in the relationship between ACE and adolescent externalizing behaviors across these groups. Seventh, data were gathered from self-report surveys, which may be biased by socially desirable responding. Despite the under- or overreporting that may occur using self-reports, studies using self-reports have yielded reliable results (Bradburn, 1983; Rutherford, Cacciola, Alterman, McKay, & Cook, 2000). Finally, due to the large sample size, there is a risk of Type 1 errors; applying more conservative alpha levels limited Type I errors and the number of findings classified as significant.
Conclusion
In response to evidence that stressful familial environments and peer-based victimization or perpetration jeopardize adult mental, physical, and behavioral health (Arata, 2006; Briere & Elliott, 2003; Gilbert et al., 2009; Stuewig & McCloskey, 2005), frameworks for the development and implementation of school-based, trauma-informed practices are gaining attention (Chafouleas et al., 2015). In light of the mounting evidence regarding ACE and adolescent risk behaviors and the benefits of well-designed timely interventions, future public health initiatives should consider prioritizing screening and access to trauma-informed intervention services (Ko et al., 2008; Listenbee et al., 2012; Na & Gottfredson, 2013; Taylor & Siegfried, 2005).
Footnotes
Declaration of Conflicting Interests
The author(s) declared no potential conflicts of interest with respect to the research, authorship, and/or publication of this article.
Funding
The author(s) disclosed receipt of the following financial support for the research, authorship, and/or publication of this article: This study was supported by the Health Resources and Services Administration (HRSA) of the U.S. Department of Health and Human Services (HHS) under National Research Service Award in Primary Medical Care Grant T32HP22239 (principal investigator [PI]: Borowsky), Bureau of Health Workforce.