



Abstract
Lesbian, gay, and bisexual (LGB) youth are at risk for many negative behaviors associated with teen dating violence victimization (TDVV). This study describes the prevalence of physical and sexual TDVV by sexual identity and quantifies the increased risk for TDVV among LGB youth compared with heterosexual youth. The participants for this study were students in Grades 9 to 12 participating in the 2015 national Youth Risk Behavior Survey (YRBS) who responded to questions ascertaining sexual identity and both physical and sexual TDVV. Data were analyzed by sexual identity, stratified by sex, and controlled for race/ethnicity and grade in school. Frequencies of physical and sexual TDVV and prevalence of TDVV from a combined TDVV measure were calculated. Associations between these behaviors and sexual identity were identified. Generally, LGB youth had greater prevalence and frequency of TDVV compared with heterosexual youth. Prevalence of TDVV within sexual identity subgroups further differed by sex. Students who were not sure of their sexual identity had the highest risk of most categories of TDVV when adjusting for sex, race/ethnicity, and grade in school. These results are the first to use a nationally representative sample to describe frequency of TDVV and to determine prevalence of a combined physical and sexual TDVV measure by sexual identity among youth. Schools, communities, and families can help prevent teen dating violence and ameliorate the potential impacts of these victimizations.
Introduction
Sexual minority youth (SMY; for example, lesbian, gay, or bisexual youth, and youth who are unsure of their sexual identity) have an increased likelihood of many risk behaviors including depression and suicide (Marshal et al., 2011; Robinson & Espelage, 2011), alcohol abuse (Marshal et al., 2011; Talley, Hughes, Aranda, Birkett, & Marshal, 2014), and illicit drug use (Corliss et al., 2010; Newcomb, Birkett, Corliss, & Mustanksi, 2014), as well as sexual risk behaviors (Herrick, Marshal, Smith, Sucato, & Stall, 2011). These behaviors also are associated with an increased risk of teen dating violence victimization (TDVV; Exner-Cortens, Eckenrode, & Rothman, 2013). The Centers for Disease Control and Prevention (CDC; 2014) defines teen dating violence as the physical, sexual, or psychological/emotional violence within a dating relationship; the definition also includes stalking. Teens who experience TDVV are also at risk for long-term negative health and behavioral outcomes, including suicide, poor academic performance, and intimate partner violence (Foshee, McNaughton Reyes, Gottfredson, Chang, & Ennett, 2013; Roberts, Klein, & Fisher, 2003).
In 2015, 11.7% of female and 7.4% of male high school students experienced physical TDVV and 15.6% of female and 5.4% of male high school students experienced sexual TDVV (Kann, McManus, et al., 2016). The literature on TDVV among U.S. SMY is limited yet developing. Of this emerging literature, six studies have sought to understand the prevalence of TDVV among SMY. However, these studies are limited by sample size, the generalizability of the sample, and/or the components of TDVV measured. For example, three studies used data from convenience samples or small samples and did not compare heterosexual adolescents with sexual minority adolescents. Specifically, Freedner and colleagues analyzed data from a convenience sample of 521 youths aged 13 to 22 years attending a lesbian, gay, bisexual, and transgender rights rally during spring 2000 and concluded that SMY have rates of TDVV similar to their heterosexual counterparts based on prevalence estimates from other studies (Freedner, Freed, Yang, & Austin, 2002). Halpern and colleagues used data from the 1996 Wave II of the National Longitudinal Study of Adolescent Health to assess the prevalence of partner violence among 117 adolescents aged 12 to 22 years who reported same-sex intimate relationships (Halpern, Young, Waller, Martin, & Kupper, 2004). This study indicated the prevalence of any partner violence victimization among SMY was 24% but did not compare it with the prevalence among heterosexual youth from the same sample. Hipwell and colleagues (2013) used data from a longitudinal sample of 1,647 urban females aged 17 years to compare sexual risk-taking and TDVV by sexual minority status. Their findings demonstrated increased prevalence of TDVV among SMY females compared with heterosexual females; however, the findings are limited in their generalizability.
Three recent studies used large, school-based samples to examine TDVV among SMY. Dank, Lachman, Zweig, and Yahner (2014) analyzed data from 5,647 seventh- to 12th-grade students in the Northeast and found that SMY had a higher prevalence of multiple forms of TDVV compared with heterosexual students. Luo and colleagues analyzed Youth Risk Behavior Survey (YRBS) data from nine urban school districts that conducted surveys during 2001-2011 (Luo, Stone, & Tharp, 2014). This study assessed physical TDVV and sexual minority status and concluded that SMY had higher rates of physical TDVV than non-SMY. Martin-Storey (2015) used data pooled from Massachusetts YRBSs in 2003, 2005, 2007, and 2009, and had about 10,500 total respondents. The study assessed physical TDVV and sexual minority status, stratified by sex, and, like the previous studies, found higher prevalence of TDVV among sexual minority students compared with non-SMY students (Martin-Storey, 2015).
The main purpose of the current study is to use data from the 2015 national YRBS, which is the first national YRBS to include a question ascertaining sexual identity, to describe rates and frequencies of physical and sexual TDVV among U.S. lesbian, gay, and bisexual (LGB) students. Because male and female youth have been shown to experience TDVV at significantly unequal rates (Kann, McManus, et al., 2016; Vagi, Olsen, Basile, & Vivolo-Kantor, 2015), this analysis was stratified by sex. A second purpose is to quantify the prevalence of physical and sexual TDVV among LGB students compared with their heterosexual counterparts. The 2015 YRBS data used in this study are based on a single physical TDVV question and a single question on sexual TDVV. These TDVV questions were new to the YRBS in 2013 and were not used in the previous studies of TDVV among SMY described above. Given the few existing studies on TDVV by sexual identity, we expected LGB students to have a higher prevalence of all types of TDVV compared with heterosexual students. We hypothesized that this might extend beyond prevalence and therefore expected that, among students who experienced at least one instance of TDVV, LGB students would have a higher mean frequency of victimizations than heterosexual students.
Method
The 2015 national YRBS was conducted during spring 2015 and used an independent, cross-sectional, three-stage cluster sample designed to generate data representative of public and private school students in Grades 9 to 12 in all 50 states and the District of Columbia. Students completed a self-administered questionnaire. Participation in the survey was anonymous and voluntary and local parental consent procedures were followed. An Institutional Review Board at CDC approved the survey. A weight was applied to each student record to adjust for school and student nonresponse and the distribution of students by grade, sex, and race/ethnicity. Detailed information about the methodology of the national YRBS can be found elsewhere (Brener et al., 2013).
Measures
Sexual identity
Sexual identity was assessed with the question “Which of the following best describes you?” with the response options “heterosexual (straight),” “gay or lesbian,” “bisexual,” and “not sure.” To obtain a sufficient sample size for analysis by sexual identity, students who responded “gay or lesbian” or “bisexual” were combined into “lesbian, gay, or bisexual” and are referred to as LGB students.
TDVV
Two questions assessed TDVV. Physical TDVV was assessed with the question “During the past 12 months, how many times did someone you were dating or going out with physically hurt you on purpose? (Count such things as being hit, slammed into something, or injured with an object or weapon).” Sexual TDVV was assessed with the question “During the past 12 months, how many times did someone you were dating or going out with force you to do sexual things that you did not want to do? (Count such things as kissing, touching, or being physically forced to have sexual intercourse).” Both questions included the response options “I did not date or go out with anyone during the past 12 months,” “0 times,” “1 time,” “2 or 3 times,” “4 or 5 times,” and “6 or more times.” Continuous frequency variables were created for each TDVV measure based on the response options such that the values were 0, 1, 2.5, 4.5, or 6.5. Next, to better understand the individual and combined components of TDVV, we created a four-category combined TDVV measure: “physical TDVV only,” “sexual TDVV only,” “both physical and sexual TDVV,” and “none,” such that reporting ≥1 time for physical TDVV and 0 times for sexual TDVV was classified as “physical TDVV only,” reporting 0 times for physical TDVV and ≥1 time for sexual TDVV was classified as “sexual TDVV only,” reporting ≥1 time for physical TDVV and ≥1 time for sexual TDVV was classified as “both physical and sexual TDVV,” and reporting 0 times for physical TDVV and 0 times for sexual TDVV was classified as “none.” A dichotomous variable also was created to indicate any TDVV (i.e., reporting ≥1 time for either physical and/or sexual TDVV) and none (referred to as “any” TDV). Students who did not date during the past 12 months were excluded from the analyses.
Race/ethnicity
Race/ethnicity was computed from two questions: “Are you Hispanic or Latino?” and “What is your race?” For this analysis, respondents were classified as White, non-Hispanic (referred to as “White”); Black or African American, non-Hispanic (referred to as “Black”); and Hispanic or Latino (referred to as “Hispanic”). The numbers of students from other racial/ethnic groups were too small for meaningful analysis; these students are included in all analyses, but their results are not reported separately.
Statistical Analysis
We conducted all analyses in SUDAAN version 11.0.1 (Research Triangle Institute, NC, USA) to account for the complex sample design. All point estimates reported herein reflect weighted estimates, although we report unweighted Ns. The significance level for all analyses was 5%. We present stratified results by sex. Bivariate associations were tested using overall chi-square tests, followed by pairwise t tests; mean frequencies were also compared using pairwise t tests. Logistic regression models assessed the association between TDVV and sexual identity, controlling for sex, race/ethnicity, and grade. These associations are reported as adjusted prevalence ratios (APRs) with 95% confidence intervals (CI; Bieler, Brown, Williams, & Brogan, 2010); the reference levels were varied to show adjusted pairwise comparisons across each type of sexual identity.
Participants
For the 2015 national YRBS, 15,713 questionnaires were completed in 125 public and private schools. The national data set was cleaned and edited for inconsistencies, and missing data were not statistically imputed. Among the 15,713 completed questionnaires, 89 failed quality control and were excluded from analysis, resulting in 15,624 usable questionnaires. The school response rate was 69%, the student response rate was 86%, and the overall response rate was 60%.
Among participating students, 14,703 (94% of full sample) responded to the sexual identity question and 14,160 (90% of full sample) responded to the sexual identity question and both TDVV questions. Of those, 70% had dated or gone out with someone during the 12 months before the survey (i.e., had dated). The analytic N was 9,917 students, 63% of the full sample. The analytic sample was 55% White, 14% Black, and 22% Hispanic; 51% male; and 24% were in ninth grade, 25% were in 10th grade, 25% were in 11th grade, and 26% were in 12th grade.
Results
Table 1 summarizes the distribution of sexual identity by sex among the 70% of students who had dated or gone out with someone during the 12 months before the survey. Among these male students, 94.5% identified as heterosexual, 3.6% as gay or bisexual, and 1.9% as not sure. Among these female students, 84.1% identified as heterosexual; 13.2% as lesbian, gay, or bisexual; and 2.7% as not sure.
Demographic Distributions Among Students Who Dated or Went Out With Someone During the 12 Months Before the Survey, by Sex—United States, 2015.
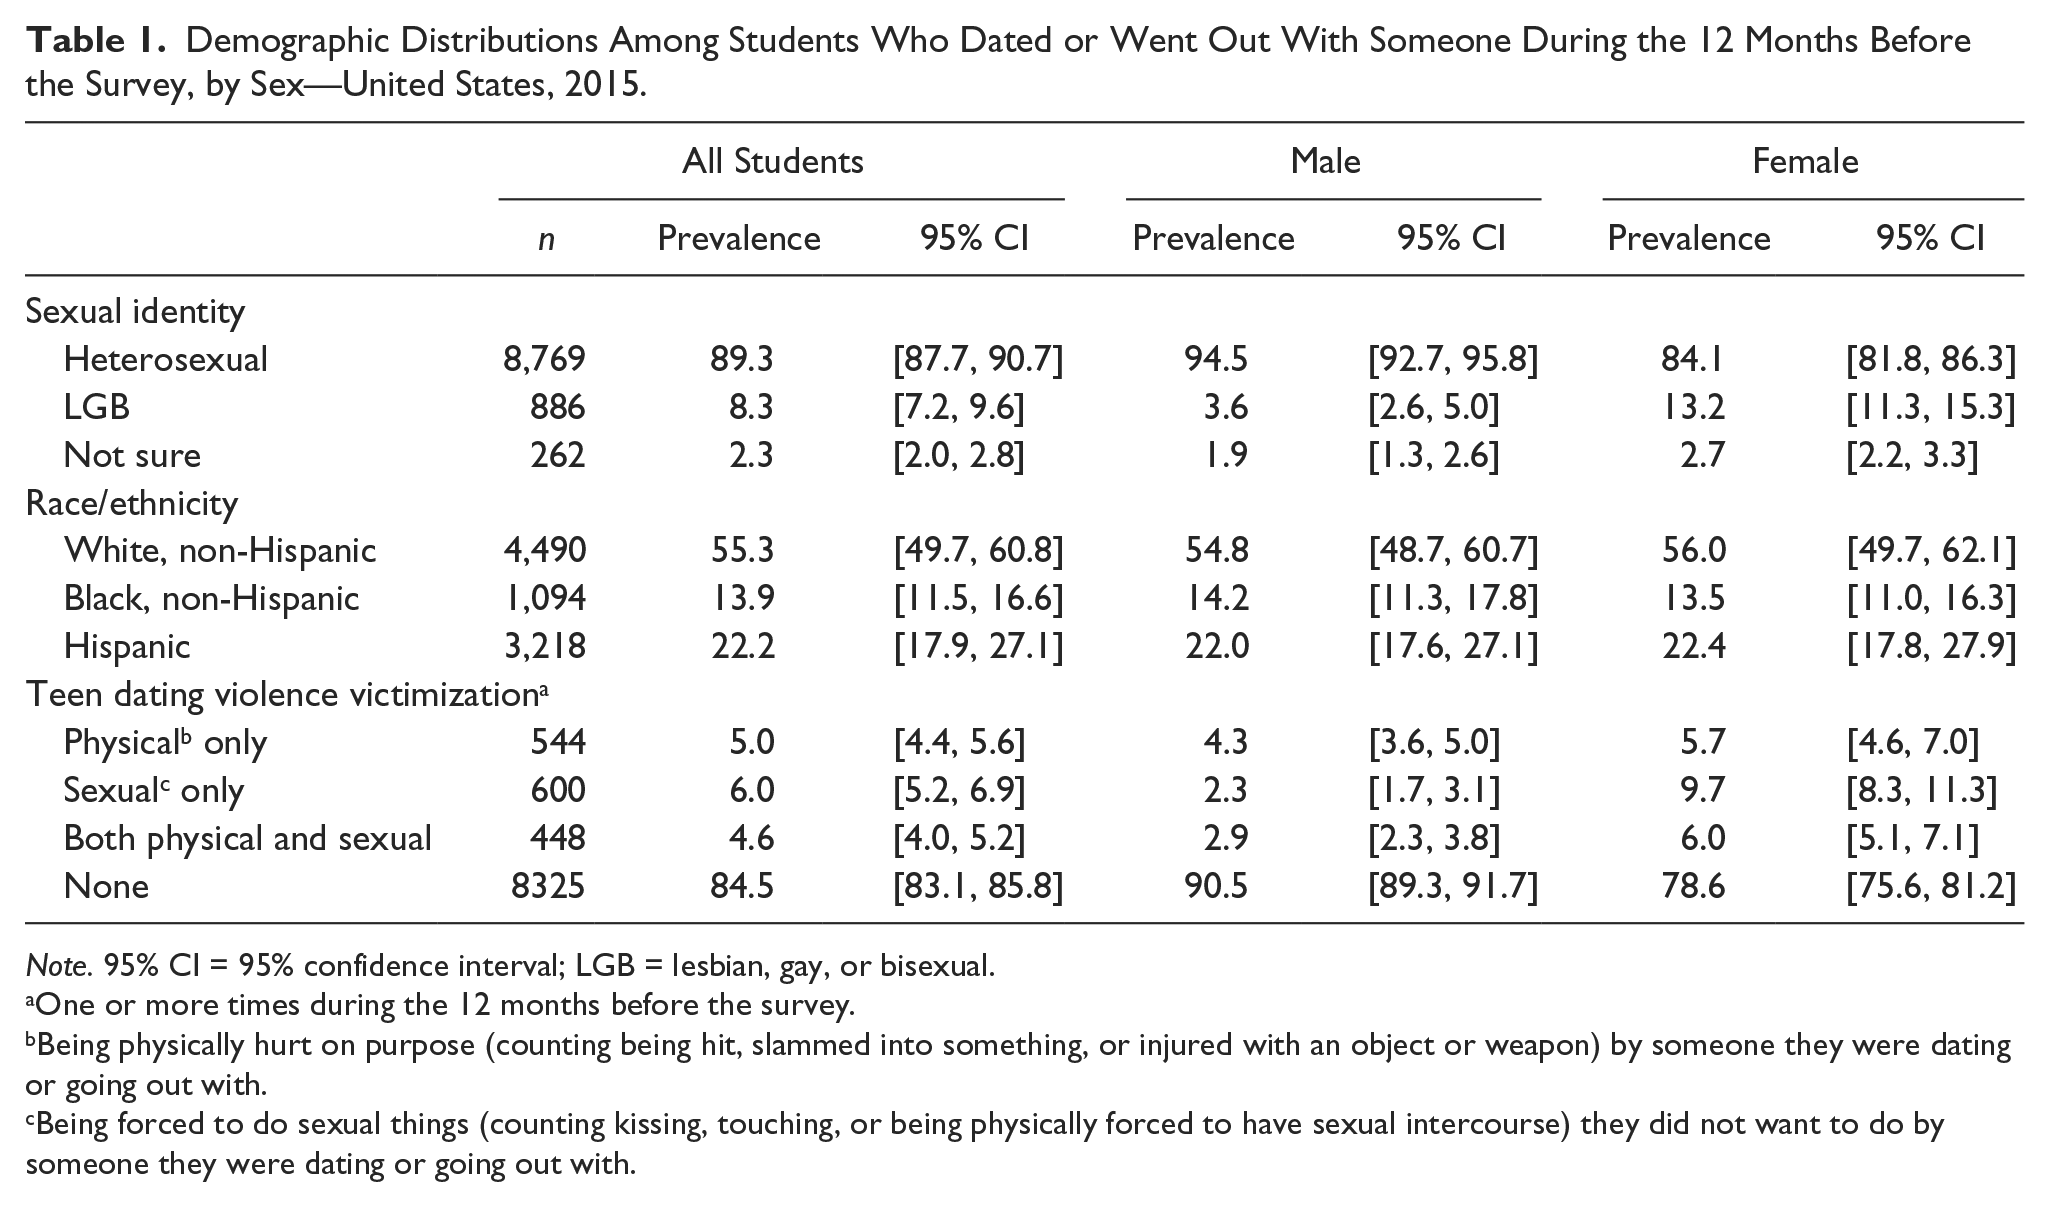
Note. 95% CI = 95% confidence interval; LGB = lesbian, gay, or bisexual.
One or more times during the 12 months before the survey.
Being physically hurt on purpose (counting being hit, slammed into something, or injured with an object or weapon) by someone they were dating or going out with.
Being forced to do sexual things (counting kissing, touching, or being physically forced to have sexual intercourse) they did not want to do by someone they were dating or going out with.
Frequencies of Physical and Sexual TDVVs
Table 2 displays the frequencies of physical TDVV and sexual TDVV by sex and sexual identity. Heterosexual male students had a significantly lower prevalence and lower mean frequencies of sexual TDVV (prevalence: 4.3%, M = 0.14 times) and physical TDVV (6.2%, 0.18 times) compared with LGB (sexual TDVV: 20.9%, 0.46 times; physical TDVV: 19.9%, 0.59 times) and not sure male students (sexual TDVV: 21.7%, 1.07 times; physical TDVV: 30.5%, 1.41 times) and compared with heterosexual female students (sexual TDVV: 14.5%, 0.36 times; physical TDVV: 10.7%, 0.27 times). Among male students, not sure students were more likely to have experienced sexual and physical TDVV 6 or more times compared with heterosexual and LGB male students and physical TDVV 6 or more times compared with not sure female students. Among female students, heterosexual students experienced a lower prevalence and frequency of sexual TDVV and physical TDVV than LGB students and a lower frequency of physical TDVV than not sure students; we did not detect any significant differences in the mean frequency or prevalence between not sure and LGB female students.
Prevalence (SE) and Mean (SE) of Frequencies of Teen Dating Violence Victimization, by Sex and Sexual Identity—United States, 2015.

Note. Among students who dated or went out with someone during the 12 months before the survey. TDVV = teen dating violence victimization; LGB = lesbian, gay, or bisexual.
Being physically hurt on purpose (counting being hit, slammed into something, or injured with an object or weapon) by someone they were dating or going out with.
Being forced to do sexual things (counting kissing, touching, or being physically forced to do have sexual intercourse) they did not want to do by someone they were dating or going out with.
Significantly different from heterosexual students (t test, p < .05).
Significantly different from LGB students (t test, p < .05).
Significantly different from not sure students (t test, p < .05).
Significantly different from female students with the same sexual identity (t test, p < .05).
Significantly different from male students with the same sexual identity (t test, p < .05).
Among those who experienced sexual TDVV ≥1 time, heterosexual male students had higher mean frequencies of sexual TDVV (M = 3.38 times) compared with heterosexual female students (M = 2.51 times; p < .0001). Heterosexual male students had a lower prevalence of sexual TDVV 1 time (34.3%) compared with heterosexual female students (45.9%; p = .04) and a higher prevalence of TDVV ≥6 times (27.5%) compared with heterosexual female students (12.0%; p = .001). No differences between LGB male and LGB female students were detected for sexual TDVV mean frequencies or prevalence. Not sure male students had a higher mean frequency (M = 4.92 times) compared with not sure female students (M = 3.16 times; p = .04) and a higher prevalence of sexual TDVV ≥6 times (64.9%) compared with not sure female students (26.2%; p = .03). Among male students, we detected significant differences between all sexual identity subgroups for mean frequencies and prevalence of sexual TDVV ≥6 times; we also detected differences between LGB male students compared with heterosexual and not sure male students for experiencing sexual TDVV 1 time. Conversely, among female students, we did not detect any differences in sexual TDVV between sexual identity subgroups.
Among students who experienced physical TDVV ≥1 time, no differences were detected in mean frequencies or prevalence between heterosexual male and heterosexual female students or between LGB male and LGB female students. Not sure male students experienced slightly higher mean frequencies (M = 4.62) compared with not sure female students (M = 3.39; p = .03). Among male students, not sure students experienced the highest mean frequencies, and were the most likely to experience TDVV ≥6 times. Among female students who experienced physical TDVV ≥1 time, the only significant differences detected were between heterosexual and not sure students, in that heterosexual students were more likely to experience physical TDVV 1 time (45.7%) when compared with not sure students (27.6%; p = .04).
Combined TDVV Measures
Table 3 contains descriptive statistics for the four-level combined TDVV measure and the “any TDVV” measure. More than a quarter of LGB male and nearly 30% of LGB female students experienced “any TDVV,” compared with 8.3% of heterosexual male and 20.0% of heterosexual female students. Among male LGB students, 15.4% experienced both physical and sexual TDVV. Among female LGB students, 12.0% experienced sexual TDVV only and 10.6% experienced both physical and sexual TDVV. For three types of TDVV—sexual TDVV only, both physical and sexual TDVV, and “any TDVV”—heterosexual female students had a higher prevalence than heterosexual male students. However, sex differences were not detected among LGB students or students who were not sure of their sexual identity for physical TDVV only, both physical and sexual TDVV, or for “any TDVV.” A difference was detected between female LGB students (12.0%) and male LGB students (5.6%; p = .048) for sexual TDVV only.
Prevalence of Combined Physical and Sexual Teen Dating Violence Victimization Among U.S. High School Students, by Sex and Sexual Identity—United States, 2015.
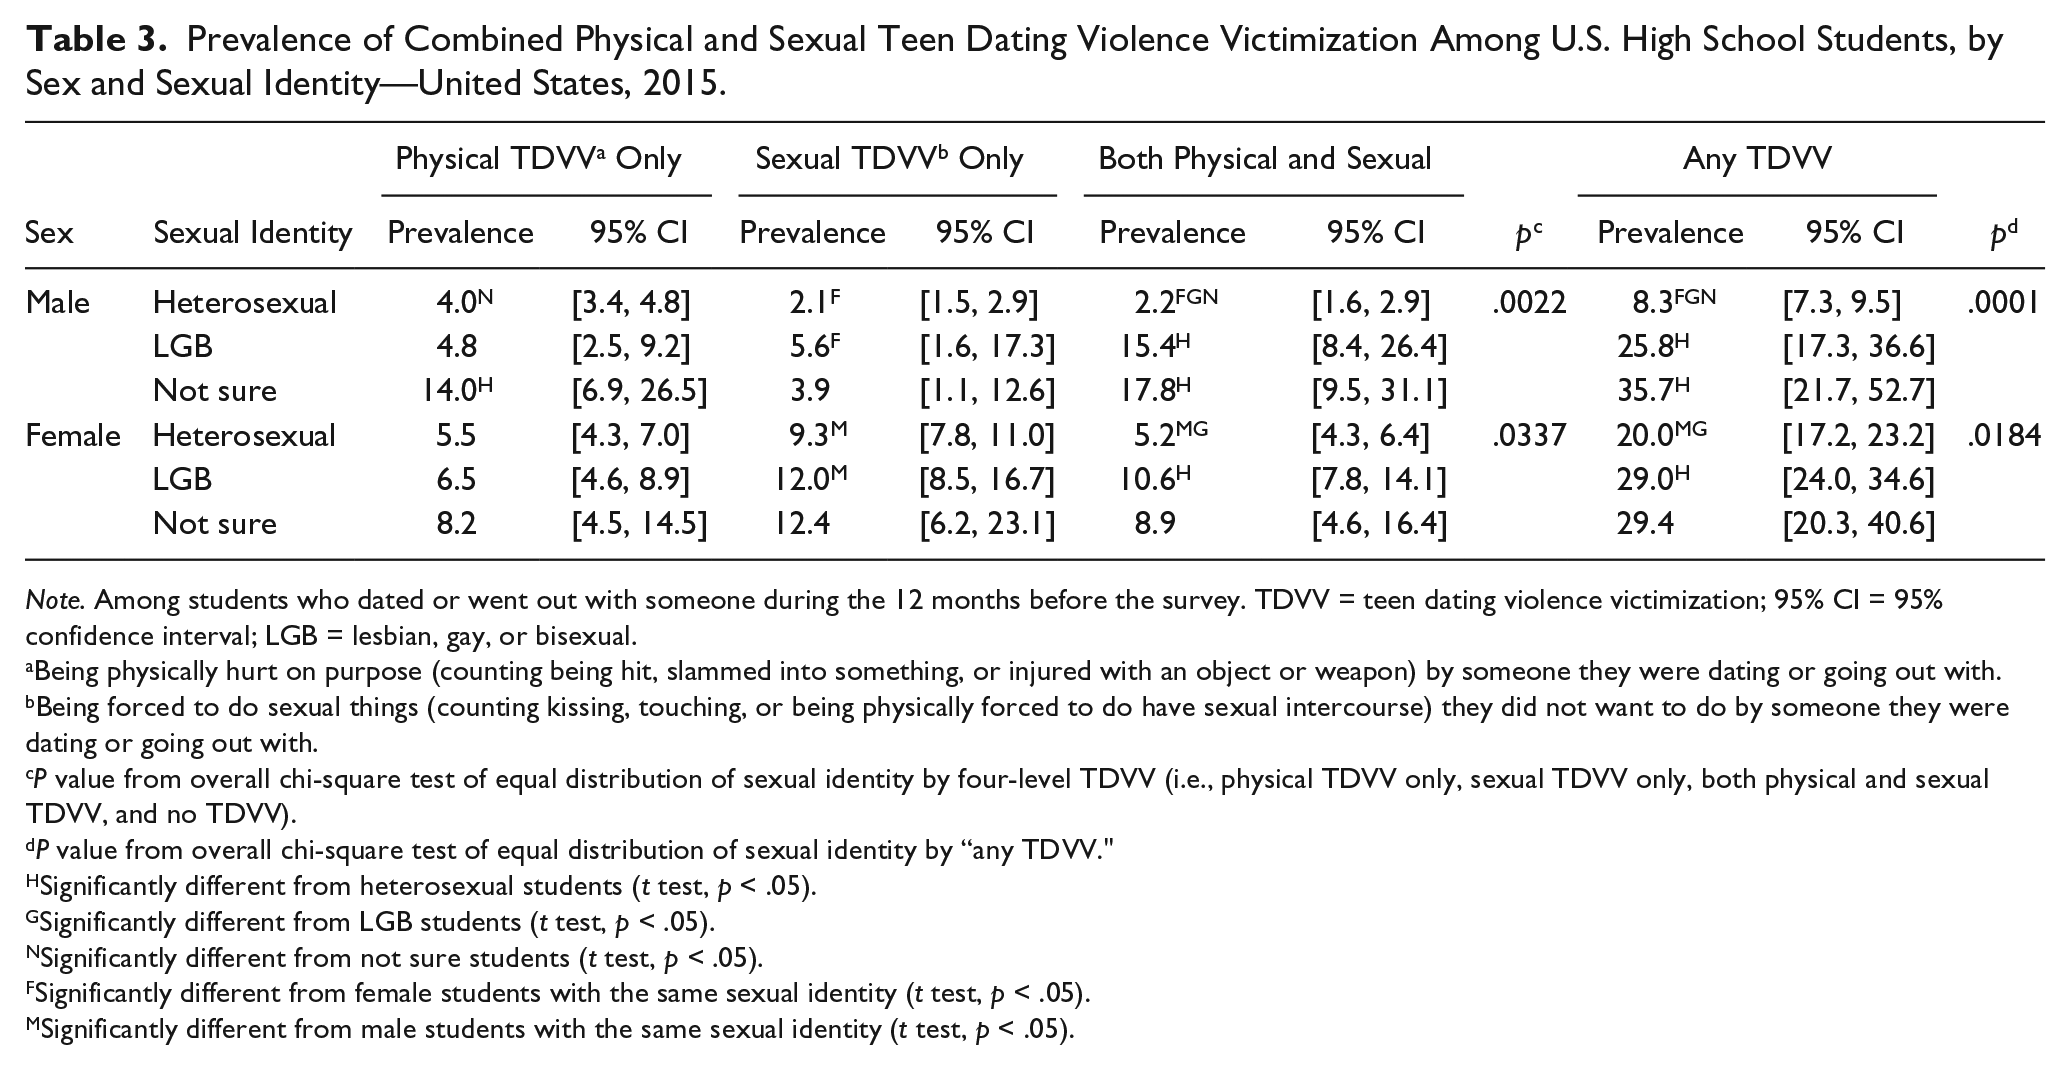
Note. Among students who dated or went out with someone during the 12 months before the survey. TDVV = teen dating violence victimization; 95% CI = 95% confidence interval; LGB = lesbian, gay, or bisexual.
Being physically hurt on purpose (counting being hit, slammed into something, or injured with an object or weapon) by someone they were dating or going out with.
Being forced to do sexual things (counting kissing, touching, or being physically forced to do have sexual intercourse) they did not want to do by someone they were dating or going out with.
P value from overall chi-square test of equal distribution of sexual identity by four-level TDVV (i.e., physical TDVV only, sexual TDVV only, both physical and sexual TDVV, and no TDVV).
P value from overall chi-square test of equal distribution of sexual identity by “any TDVV."
Significantly different from heterosexual students (t test, p < .05).
Significantly different from LGB students (t test, p < .05).
Significantly different from not sure students (t test, p < .05).
Significantly different from female students with the same sexual identity (t test, p < .05).
Significantly different from male students with the same sexual identity (t test, p < .05).
Among female students, the prevalence of physical TDVV only and sexual TDVV only did not differ significantly by sexual identity; however, the prevalence of both physical and sexual TDVV was higher among LGB female (10.6%) compared with heterosexual female (5.2%) students (p = .03) and the prevalence of “any TDVV” was higher among LGB female (29.0%) than heterosexual female (20.0%) students (p = .02).
Among male students, those who were not sure of their sexual identity had higher prevalence of physical TDVV only (14.0%), both physical and sexual TDVV (17.8%), and “any TDVV” (35.7%) than heterosexual male students (4.0%, 2.2%, and 8.3%, respectively). LGB students also had a higher prevalence of both physical and sexual TDVV (15.4%) and “any TDVV” (25.8%) compared with heterosexual students.
Controlling for sex, race/ethnicity, and grade, the APRs (Table 4) indicate that both LGB and not sure students were more likely to experience both physical and sexual TDVV and “any TDVV” compared with heterosexual students (see Table 4). Not sure students were also more likely to experience physical TDVV only compared with heterosexual students. No differences were detected between the sexual identity subgroups for sexual TDVV only, and no differences were detected between not sure and LGB students for any of the combined TDVV categories.
Adjusted Prevalence Ratios of Combined Teen Dating Violence Victimization Among U.S. High School Students, by Sexual Identity.

Note. Among students who dated or went out with someone during the 12 months before the survey and adjusted for sex, grade, and race/ethnicity. APRs that were significant at the 5% level are shown with bold font. TDVV = teen dating violence victimization; APR = adjusted prevalence ratio; 95% CI = 95% confidence interval; LGB = lesbian, gay, or bisexual.
Written in the format: exposure subgroup versus referent subgroup.
Being physically hurt on purpose (counting being hit, slammed into something, or injured with an object or weapon) by someone they were dating or going out with.
Being forced to do sexual things (counting kissing, touching, or being physically forced to do have sexual intercourse) they did not want to do by someone they were dating or going out with.
Discussion
The results of this study suggest that generally, LGB students experience physical TDVV and sexual TDVV at higher rates than their heterosexual counterparts, especially male students. This corroborates previous studies (Dank et al., 2014; Luo et al., 2014) of adolescents and also follows patterns of intimate partner violence by sexual orientation in adults (Walters, Chen, & Breiding, 2013). Our results also indicate that male students who are not sure of their sexual identity have a higher frequency of TDVV than their heterosexual or even LGB counterparts, which is a new finding and may counter previous findings (Luo et al., 2014). An additional new finding is the lack of disparity in TDVV prevalence among LGB male and female students. A national study among U.S. high school students indicated that TDVV was twice as prevalent among female than male students, without considering sexual identity (Vagi et al., 2015). The current study suggests that this disparity exists among heterosexual students, consistent with the existing literature, but is not detected among subgroups of sexual minority students; in one case, male LGB students had higher prevalence of TDVV than female LGB students. Our results also suggest that sexual minority female students are not immune to TDVV and in fact are at greater risk for some of these victimizations than heterosexual female students.
The prevalence of “any TDVV” among sexual minority students was 25.8% among male LGB students and 29.0% among female LGB students. These estimates corroborate some previous estimates of violence among SMY within dating relationships. Halpern reported approximately 25% of SMY had experienced some victimization (Halpern et al., 2004), while Freedner estimated 43% to 45% of gay and lesbian adolescents had experienced victimization (Freedner et al., 2002). The four more recent studies estimated rates of physical TDVV among SMY to be between 19% and 30% in one study (Luo et al., 2014), 31% in another study (Hipwell et al., 2013), 43% in the third study (Dank et al., 2014), and between 19% and 44% in the fourth study (Martin-Storey, 2015). Our study extends the literature by using a combined measure of TDVV including both physical and sexual victimization, and by measuring frequency of victimizations for all students as well as among those who experienced TDVV at least once.
Our results suggest that, after controlling for sex, race/ethnicity, and grade, LGB students and not sure students are at highest risk of TDVV compared with heterosexual students. The adjusted results also indicate that LGB and not sure students are more likely than heterosexual students to experience both physical and sexual TDVV. This is concerning because a previous national study showed that youth who experienced both physical and sexual TDVV were at an increased risk for many other risky behaviors, including suicide ideation and fighting, compared with youth who experienced only physical or only sexual TDVV (Vagi et al., 2015).
Several potential explanations exist for why LGB students are at greater risk for TDVV. One explanation is that LGB youth become involved in a violent relationship because of low self-worth or feelings of helplessness for finding a romantic relationship. This is in line with the minority stress theory (Lewis, Milletich, Kelley, & Woody, 2012; Williams & Chapman, 2011), which posits that psychosocial stress comes from being a member of a minority group that is stigmatized and experiences discrimination and marginalization (DiPlacido, 1998; Meyer, 2003). The minority stress theory includes both internalized and externalized stressors that are not only said to both increase TDV victimization and perpetration risk (Lewis et al., 2012) but also associated with the negative risk behaviors that co-occur with TDV (e.g., anxiety, depression, and substance abuse; Edwards, Sylaska, & Neal, 2015; Hatzenbuehler, 2009).
Along with this psychological stress, it is possible that specific aspects of dating relationships for LGB youth play a role in increasing risk for TDV. To date, no research has been conducted to determine if specific relationship characteristics (e.g., engaging in sexual intercourse with a partner, relationship duration/brevity, monogamy, or the age difference of youth and partner) increase risk for LGB youth. Research does exist suggesting that dating violence occurs in teen relationships of longer duration (Gaertner & Foshee, 1999; Giordano, Soto, Manning, & Longmore, 2010), where sexual intercourse is occurring (Giordano et al., 2010; Kaestle & Halpern, 2005), where partners use manipulation tactics (Vivolo-Kantor, Massetti, Niolon, Foshee, & McNaughton Reyes, 2016), and where partners are older (Vivolo-Kantor et al., 2016). Of note, none of these analyses explicitly excluded same-sex or bisexual relationships. Thus, it is possible that some of these relationship characteristics are more salient for LGB youth and are significant drivers of the relationship between sexual minority status and TDVV. Future research should consider if these factors increase risk of TDVV for LGB students as compared with heterosexual students.
The results of these analyses also suggest that the prevalence and frequency of TDVV among students who selected “not sure” to the sexual identity question are more similar to the LGB students than the heterosexual students. These results are consistent with previous studies by Luo et al. and Martin-Storey, who used state YRBS data to assess TDVV prevalence by sexual orientation, and Kann et al., who examined the prevalence of other health-risk behaviors by sexual identity, including “not sure” students (Kann, Olsen, et al., 2016). In the current study, the “not sure” response option, although a credible choice for youth who might truly be unsure of their sexual identity at this point in their lives, might also have been selected by students who did not understand the question, may have understood the question but did not feel that the other response options were appropriate, or may not have felt comfortable identifying themselves on the questionnaire. Regardless, the results indicate that students who do not identify as heterosexual, lesbian, gay, or bisexual have a unique victimization pattern and additional research could provide more information about why these students are particularly vulnerable.
Important implications exist for intervention and prevention programming for schools and families. Social and institutional support is important for SMY health and well-being. SMY who reported receiving support from schools had fewer negative health outcomes such as depression, suicidality, and substance use (Espelage, Aragon, Birkett, & Koenig, 2008). Therefore, increasing support systems for SMY, including school support groups and Gay-Straight Alliances, may help to decrease victimization (Goodenow, Szalacha, & Westheimer, 2006; Saewyc, Konishi, Rose, & Homma, 2014). Furthermore, another study found that youth perception of staff support had a buffering effect on SMY suicide risk, making it even more important that school staff, including school counselors and mental health professionals, be supportive of the unique needs of SMY (Goodenow et al., 2006). SMY experiencing high rates of family rejection are also more likely to experience negative health outcomes (Ryan, Huebner, Diaz, & Sanchez, 2009); however, SMY with positive support from family report less violence victimization (D’Augelli, Grossman, & Starks, 2008; Espelage et al., 2008). Accordingly, intervention and counseling with parents to promote positive family reactions may decrease these negative experiences (Bouris et al., 2010). Although not specific to SMY youth, recently developed teen dating violence prevention programming has sought to use more gender-neutral language when teaching youth about dating violence. For example, programs such as CDC’s Dating Matters® comprehensive prevention model (Tharp, 2012) and Shifting Boundaries (Taylor, Stein, Mumford, & Woods, 2013) focus on raising awareness of dating violence and teaching about healthy dating relationships without sex-specific language (i.e., boys should not hit girls). Interventions such as these may also decrease dating violence in SMY youth; however, they have yet to be evaluated with this subsample of youth.
The disparate prevalence of TDVV by sexual minority status is an area ripe for future research. This study was limited to direct associations between TDVV prevalence and sexual identity, controlling only for available demographic measures in the YRBS: race/ethnicity, sex, and grade. Future studies could explore the impact or moderating effects of teen mental health issues, alcohol and other drug use, and perceived discrimination. In addition, the YRBS TDVV survey questions do not include information on partner gender, particularly transgender. Understanding these relationships could better inform the types of relationships and further elucidate TDVV among SMY, for example, the prevalence of TDVV among SMY in same-sex relationships versus SMY in opposite-sex relationships. It also may help us to understand which SMY are most at risk for specific types of TDVV—physical only, sexual only, both, or “any.” With a basic prevalence and etiology of these behaviors among SMY, researchers are better able to develop the most appropriate preventive intervention for this population.
Our study has some limitations in addition to those described above for the “not sure” response option in the sexual identity question. Some students may not know their sexual identity, may have been unwilling to disclose it on the YRBS questionnaire or label themselves as sexual minority, or may not have understood the question (although we do not have any evidence that the words used to describe sexual identity are unclear to young people today). The measurement of sexual minority status is complex and includes three constructs: sexual identity, sexual attraction, and actual sexual behaviors. These analyses only considered sexual identity for determining sexual minority status; further analysis using sex of sexual contacts or sexual attraction may have yielded different results (Luo et al., 2014; Martin-Storey, 2015). In addition, this study combined LGB students. At least one study suggests that gay and lesbian adolescents may have different TDVV risk patterns from bisexual adolescents (Freedner et al., 2002); therefore, future studies could explore differences in TDVV between gay or lesbian and bisexual youth. Next, the data are self-reported, and the extent of underreporting or overreporting of health-risk behaviors cannot be determined, although many YRBS health-risk behavior questions have shown good test–retest reliability (Brener et al., 2002). The data also only describe youth who attend school and therefore are not representative of all people in this age group. Nationwide, in 2012, of persons aged 16 to 17 years, approximately 3% were not enrolled in a high school program and had not completed high school (Stark & Noel, 2015). Finally, cross-sectional YRBS data can describe the magnitude and frequency of risk behaviors and provide an indication of associations between sexual identity and TDVV, but not an explanation of why or how this relationship exists.
This study is the first to quantify prevalence and frequency of physical and sexual TDVV among LGB students and to compare LGB to heterosexual students using nationally representative data. LGB teens and youth who are not sure of their sexual identity in the United States are at increased risk for TDVV compared with their heterosexual peers. The results highlight the continuing need for more research on TDVV within LGB youth populations in ways that are attentive to group differences and various types of violence exposure. Nonetheless, evidence-based programs and policies do exist that may combat this disparity and improve quality of life for all youth.
Footnotes
Acknowledgements
The authors acknowledge Tim McManus.
Authors’ Note
Preliminary analyses of related research were presented at the 142nd American Public Health Association conference, November 2014, New Orleans, LA. The findings and conclusions in this article of those of the authors and do not necessarily represent the official position of the Centers for Disease Control and Prevention.
Declaration of Conflicting Interests
The author(s) declared no potential conflicts of interest with respect to the research, authorship, and/or publication of this article.
Funding
The author(s) received no financial support for the research, authorship, and/or publication of this article.