
Abstract
Social research has long argued that collective resources and major events like disasters have an important impact on violent crime, but it has been difficult to show their effects because data are scarce. We conducted a large survey in New Orleans after Hurricane Katrina that included questions about collective resources. We aggregated our sample to the census tract level and merged it with data on concentrated disadvantage and violent crime. Our analyses show that bridging social networks are associated with lower levels of violent crime, while bonding social networks are associated with higher levels. Social trust is associated with lower levels of violent crime, but civic engagement has no impact. Concentrated disadvantage is associated with higher levels of violent crime. Finally, our results suggest that disaster recovery increased the importance of collective resources but not concentrated disadvantage on violent crime.
Social research has long shown that concentrated disadvantage is a strong and consistent predictor of violent crime (Kubrin, 2003; Pyrooz, 2012; Valasik, Barton, Reid, & Tita, 2017). For just as long, researchers have argued that social processes and organizations play an important role, but it has been more difficult to measure and show their effects. Historically, researchers spoke of social control (Janowitz, 1978), and more recently of social capital (Coleman, 1988), collective efficacy (Sampson, 2012), civic engagement (Prewitt, Mackie, & Habermann, 2014), and community organizations and institutions (Wo, Hipp, & Boessen, 2016). These collective resources 1 often showed beneficial effects, but while some theorists (Bursik 1988; Bursik & Grasmick, 1993; Sampson, 2012) argued that they would mediate the effects of structural factors on violent crime, they have not always done so (Kubrin & Wo, 2016). Researchers also examined whether major events like disasters influenced these patterns, and debated whether a disaster increases or reduces crime (Curtis & Mills, 2011; Doucet & Lee, 2015; Frailing & Harper, 2016a, 2016b; Prelog, 2016; Spencer, 2017; Zahran, Shelley, Peek, & Brody, 2009). This research also sometimes produced conflicting results.
One of the biggest challenges in researching the effect of collective resources or disasters on violent crime is obtaining adequate data. Indicators of structural factors and violent crime are regularly measured by public or government sources, but indicators of collective resources are often difficult to collect or find. Furthermore, disasters may or may not occur within the time period under examination. Because indicators of collective resources are so scarce, and disasters are so unpredictable, it is worth reconsidering their effects when they can be measured.
The present study examines whether collective resources were associated with lower levels of violent crime in New Orleans before and after Hurricane Katrina. We examine the relationship of social trust, social networks, and civic engagement with levels of neighborhood violent crime in New Orleans. We take into account concentrated disadvantage and factor in the influence of the disaster. We conducted a large (N = 5,060) survey of Hurricane Katrina survivors in New Orleans which included a range of questions about collective resources that could be aggregated to the tract level and merged with census and crime data (Weil, Rackin, & Maddox, 2018).
Our analyses examine (a) the association of different types of collective resources with violent crime, (b) the extent to which these collective resources mediate the influence of concentrated disadvantage, and (c) the effect of a major disaster on these associations. Previous research found mixed results regarding how collective resources affect crime levels (Bellair & Browning, 2010; Kubrin & Wo, 2016; Sampson, 2012), which Bellair and Browning (2010) attribute to data limitations that make it hard to evaluate the importance of different measures of community cohesion. Our data allow for a reconsideration of this question by distinguishing among several measures of collective resources. We evaluate the effect of social trust, which is a major component of several theories of community cohesion. We also make a distinction between bonding and bridging social networks and find new patterns that have often been proposed and tested with proxy variables (Beyerlein & Hipp, 2006), but almost never examined with direct measurements. We also examine the effects of civic engagement, which we measure as citizen participation, rather than the more common proxy of organizational density (Doucet & Lee, 2015; Wo et al., 2016). Next, we test the well-established finding that concentrated disadvantage increases violent crime, and evaluate the balance between structural and collective resource influences on violent crime. Finally, we examine the effect of the disaster and weigh evidence for two competing theories that (a) post-disaster altruism reduces crime or (b) that increased post-disaster inequality increases crime.
Our results reconfirm some established findings, shed new light on propositions previously tested with proxy variables, and provide evidence in support of one, but not both, of the two major propositions about the effect of a major disaster on the etiology of violent crime. We argue that there is still much work to be done in mapping out how different types of collective resources affect crime, as well as other social outcomes. For instance, we suggest that collective resources may have different effects on “adversarial” social outcomes like crime than on “cooperative” social outcomes like disaster recovery. We discuss some of the implications of these different effects and suggest some of the research questions that remain to be addressed in understanding how collective resources operate in society.
Collective Resources, Community Organizations, and Violent Crime
Much current research on collective resources, structural factors, and violent crime can be traced to the Chicago School of Sociology’s concept of social control (Janowitz, 1978) and Shaw and McKay’s (1942) study of juvenile delinquency in Chicago neighborhoods. The concept of social control included sub-institutional forms of self-governance including social networks, civic engagement, and socialization. Yet these forms of informal social control were hard to measure directly. Beginning with Shaw and McKay (1942), researchers assessed the importance of structural factors like low socioeconomic status, racial/ethnic heterogeneity, and residential instability for crime and assumed that these factors inhibited the development of informal social control, which was taken to be an unmeasured intervening factor (Kubrin & Wo, 2016). This inability to differentiate the effects of structural causes from social control causes of delinquency resulted in criticisms that community social control and disorganization were not being assessed (Kornhauser, 1978).
More recent research attempted to measure collective resources directly and further develop the theoretical models. For instance, Sampson’s (2012; Sampson, Raudenbush, & Earls, 1997) model of collective efficacy exhibits some of the strongest and most consistent negative correlations with violent crime. Sampson argued that previous approaches emphasized shared values too much and collective actions too little. Thus, he conceptualizes collective efficacy as composed of two elements, social cohesion/trust or how closely individuals in a community are connected to and support each other, and informal social control or the commitment of neighbors to intercede if they witness wrongdoing.
The theoretical concept of collective efficacy has generally been well received, but its operationalization generated criticism (Hipp, 2016; Hipp & Wo, 2015). Critics noted that social control was measured with survey questions that asked what respondents thought neighbors might do in hypothetical situations rather than what they have done themselves or observed their neighbors doing. This is problematic because this operationalization might measure reputation or attribution rather than actions (Hipp & Wo, 2015; Warner, 2007). In that case, the causality might be the reverse: not that neighbors’ actions affect crime levels, but rather that existing crime levels might predict respondents’ attribution of actions to their neighbors. Hipp (2016; Hipp & Wickes, 2017) shows that a rise of violent crime in a neighborhood was followed by a decline of collective efficacy at a later time, but not the reverse. Others found that crime causes fear and out-migration, both of which may undermine collective efficacy (Hipp, Tita, & Greenbaum, 2009; Skogan, 2012b). Thus, a rise in crime might drive down a neighborhood’s reputation, and respondents might attribute the change to presumed (rather than observed) actions of their neighbors. However, Sampson (2012) presents contrary evidence that collective efficacy, measured at one time, was associated with lower crime at a later time, which supports the causal direction he proposes, namely that collective efficacy reduces crime. Thus, the negative correlation between measured collective efficacy and violent crime seems well established, but the validity of the index and its causal relationship with crime remains under debate.
Research has produced more consistent findings about other types of collective resources like social networks, civic engagement, or community organizations and institutions, as we review in the following sections.
The informal social control perspective suggests that social networks should reduce crime, possibly because higher status people would have stronger social networks. Yet since the 1920s, research found that social networks did not correspond directly with social status or to crime. Thus, Zorbaugh (1929) found that wealthier people may have stronger social networks, but their networks were not necessarily based in their neighborhoods. Furthermore, social networks in disadvantaged neighborhoods may not be as weak as often posited (Simon & Burns, 1997; Whyte, 1943). Indeed, Wilson (1987) argued that the problem faced by poor neighborhoods is not lack of social networks, but rather that the networks do not extend beyond a neighborhoods’ boundaries (Grannis, 2009). In other words, poor communities may have bonding, but not bridging, social networks (Putnam, 2000; Woolcock, 1998)—where bonding networks are connections among people within a neighborhood and bridging networks are connections among people across neighborhood lines. More generally, bonding networks are understood as ties among similar people, and bridging networks are understood as ties among people who differ from each other. Even in middle-income neighborhoods where social networks were often thought to be strong and effective, Carr (2003) argued that a “new parochialism” depends less on social networks and more on formal and limited partnerships between local organizations and the authorities. Typical actions lie not so much in informally dissuading offenders, but rather in removing or disrupting their gathering places (e.g., local bars, street corners; see also Brown, 2016).
Researchers also found that offenders may be as likely to have strong social networks as law-abiding citizens (Browning, Feinberg, & Dietz, 2004; Kirk, 2015). Pattillo (1999) found that even in middle-class neighborhoods surrounded by poor high-crime neighborhoods, networks of offenders can intrude and compromise the hoped-for beneficial effect of neighborhood social networks. While theorists argue that informal social control or collective efficacy intervene and explain the effect of social networks (Bursik 1988; Bursik & Grasmick, 1993; Sampson, 2012), quantitative studies have shown a wide range of effects of social networks on crime, positive, negative, or null (Bellair & Browning, 2010; Kubrin & Wo, 2016; Sampson & Groves, 1989).
Thus, the research leaves open the possibility that only certain types of social networks inhibit crime. Bridging networks may reduce violent crime by bringing people together from across neighborhood, ethnic, and religious lines, while bonding networks may increase violent crime by bringing together, not only law-abiding residents, but also like-minded offenders. We are not aware of quantitative research that tests this proposition directly, but Brown (2016) gives ethnographic evidence for it; Sampson (2012) obtains an analogous finding for elite networks; and several researchers characterize certain religious and neighborhood organizations that reduce crime as “bridging,” as we discuss below (Beyerlein & Hipp, 2006; Wo et al., 2016).
Research on civic engagement likewise shows only weak effects on violent crime, even though it often influences other social outcomes. Verba, Schlozman, and Brady (1995) found that higher status people participated in civic affairs more often than lower status people. Thus, civic engagement was stronger in higher income, lower crime neighborhoods where it is less needed. Second, civic engagement is generally understood as people coming together to achieve commonly held goals, even if they are in opposition to other groups. It can be hard to organize against crime because criminals are uncooperative, elusive, adaptive, and often dangerous (Skogan, 1988). Furthermore, as part of the “new parochialism” (Carr, 2003), civic engagement might involve, not confronting offenders, but cooperating with local authorities to shut down gathering places for offenders (Brown, 2016). Such efforts might help bolster organizations or encourage the authorities to take crime suppression more seriously (T. Bennett, Holloway, & Farrington, 2006).
Accordingly, civic engagement rarely has a direct effect on crime, though it is found to work indirectly through collective efficacy (Sampson, 2012). To be sure, civic engagement is usually measured as citizen participation in a range of civic activities, and the questions do not always specify the activities in sufficient detail to investigate certain approaches like community policing or working with authorities. Still, existing research gives little support for the proposition that civic engagement is a mechanism by which informal social control reduces violent crime.
By contrast, a good deal of empirical research suggests that certain local organizations and institutions might suppress violent crime. For instance, researchers sometimes take organizations and institutions as indirect or proxy measures of civic engagement or social cohesion. Thus, while churches as a whole might or might not reduce crime (Doucet & Lee, 2014; Sampson, 2012), several studies have shown that the presence of “bridging” denominations (e.g., mainstream Protestants, Catholics) reduces crime, while the presence of “bonding” denominations (e.g., Evangelical Protestants) increases crime (Beyerlein & Hipp, 2006; Desmond, Kikuchi, & Morgan, 2010; Lee & Bartkowski, 2004; Wo et al., 2016). Some local institutions like cafes, recreation centers, and community policing are associated with lower crime, while other institutions like bars or payday lenders are associated with higher crime (Kubrin & Hipp, 2016; Papachristos, Smith, Scherer, & Fugiero, 2011; Peterson & Krivo, 2010; Wo, 2016). Results are mixed for the importance of voluntary organizations, neighborhood associations, and nonprofits (Sampson, 2012; Wo et al., 2016). Yet Skogan (1988, 2012a) cautions that these correlations could be spurious. That is, organizations can have a strong class character, where upper status neighborhoods have stronger voluntary organizations and less crime, and lower status neighborhoods have weaker voluntary organizations and more crime. Also, the question remains whether organizations and institutions should be considered proxy indicators of informal social control, when the latter cannot be directly measured, or whether they should be understood as more formal, external agents. Thus, some analysts argue that a top-down approach of implanting helpful organizations or institutions may be more productive in reducing crime than relying upon bottom-up membership associations (Sampson, 2012; Skogan 2012a).
Disasters and Violent Crime
Major events like a disaster can affect a neighborhood’s social structure and social cohesion and thereby can influence levels of violent crime (Curtis & Mills, 2011; Doucet & Lee, 2015; Frailing & Harper, 2016a, 2016b; Prelog, 2016; Spencer, 2017; Zahran et al., 2009). Yet the two most influential disaster theories suggest divergent, possibly contradictory outcomes. The first framework argues that altruism and social solidarity tend to emerge after disasters as residents help each other respond and recover. This solidarity may fade as recovery gives way to a new normal (Quarantelli & Dynes, 1977; Rodriguez, Trainor, & Quarantelli, 2006; Solnit, 2009). This framework has been updated in recent years with an emphasis on social capital, though researchers caution that negative or unsolidaristic elements can also develop during recoveries, such as when a particular social group absorbs resources while excluding other groups, or when some communities organize to avoid shared burdens (Aldrich, 2012; Meyer, 2018; Nakagawa & Shaw, 2004). Several studies (Seidman, 2013; Weil, 2011; Wooten, 2012) suggest that civic engagement, organizational activity, and feelings of social solidarity rose in New Orleans following Hurricane Katrina, at least for a period of time. A second theoretical framework suggests that recovery efforts disproportionately favor advantaged communities, thus magnifying historical inequalities (Bolin, 2007; Elliott & Pais, 2010; Schultz & Elliott, 2013). Thus, the first disaster theory shares many features with the criminological literature discussed above, primarily stressing the importance of social cohesion and informal social control. Conversely, the second disaster theory suggests that concentrated disadvantage may rise after a disaster, producing more violent crime, and that any increase in social solidarity is not likely to counteract a disaster’s impact.
Most recent quantitative research on disaster and crime uses these theoretical frameworks to predict developments following a disaster (Curtis & Mills, 2011; Frailing & Harper, 2016a, 2016b; Prelog, 2016; Spencer, 2017; Zahran et al., 2009). Research on post-Katrina New Orleans in particular focused on reforms (or lack thereof) in the police department (Burns & Thomas, 2015), changes in illicit drug markets (A. S. Bennett, Golub, & Dunlap, 2011), and changes in enforcement strategies (Corsaro & Engel, 2015; Wellford, Bond, & Goodison, 2011). Although useful, these studies generally focus on changes in crime rates and do not directly address the central question of our present study, namely the social etiology of violent crime.
Doucet and Lee (2015) used a civic communities approach to examine the structural causes of violent crime in New Orleans following Hurricane Katrina, but did not attempt to examine changes from before to after the storm, nor changes after the storm. They find that violent crime is lower in higher status neighborhoods; it is spatially clustered; and civic institutions (as measured by nonprofit civic and religious organizations) reduce the prevalence of violent crime, but only in disadvantaged neighborhoods. Residential stability and age composition have no statistically significant effects. Doucet and Lee (2015) note their inability to directly measure civic engagement, collective efficacy, including trust, or social networks, but their findings provide a rare look at the influences on violent crime after a disaster, and are consistent with several of the theories discussed above.
Hypotheses
In the light of the literature we have reviewed, we propose a set of hypotheses for investigating the etiology of violent crime in New Orleans neighborhoods before and after Hurricane Katrina, which we test at the census tract level with data from a large survey we conducted and combined with data on social structure and violent crime.
Data
We conducted a large (N = 7,000) survey of Hurricane Katrina survivors in Greater New Orleans, beginning in June 2006, with most data collected from June 2007 to April 2011, which measured collective resources and other factors in depth. 2 Our analyses in this article are based on respondents located in Orleans parish (i.e., the City of New Orleans; N = 5,060), where we have violent crime data. Our sample is well representative of the post-Katrina population demographically. Weighting by the joint age–gender–race/ethnic distributions for each parish (county), according to Census population estimates for the year of the interview, did not change percentages of population subgroups substantially. We conducted the survey by paper and on the Internet; and to correct for underrepresentation of lower status respondents, we conducted much of it by face-to-face interviews. 3 As a small research team with limited resources, our door-to-door sampling accounts for the long time period of data collection. Our study design and sampling procedure allowed us to aggregate respondents by census tract. There was a mean of 21 interviews per tract, for 180 tracts in Orleans parish, which is within a range commonly reported in aggregate neighborhood studies (Auspos, 2012; Sampson, Morenoff, & Gannon-Rowley, 2002). We then merged our aggregated survey data with tract level data from government sources so that we could use collective resources as a predictor of violent crime and assess its relationship as compared with concentrated disadvantage.
Tract-level census data for Census 2000 was downloaded from the Neighborhood Change Database in Census 2010 boundaries so that it could be matched with later data points (GeoLytics, 2013). Additional tract-level census data were collected from the 2006-2010 American Community Survey (ACS) 5-year estimates and the 2009-2014 ACS 5-year estimates (U.S. Census Bureau, 2016).
Confirmatory factor analyses were conducted with tract level census data to create an index of concentrated disadvantage. Factor scores are conventionally used to measure concentrated disadvantage and other concepts when the individual indicators are highly intercorrelated and their separate use might produce distorted models due to multicollinearity (e.g., Sampson et al., 1997). Results indicated that the percent below poverty, percent unemployed, percent of female-headed households, and percent receiving public assistance all loaded highly on the same factor for each period. The final measure of concentrated disadvantage for each cross-section was created by taking the average of the standardized values of the component variables. We do not include race in our analyses for two reasons. First, the percent African American in census tracts is highly collinear with concentrated disadvantage. Second, while some analysts include race in their scales of concentrated disadvantage, many African Americans in New Orleans live in middle-class neighborhoods. We chose to focus here on the effects of structural or behavioral factors like concentrated disadvantage, rather than ascriptive factors like race.
Our measures of collective resources were computed from our survey and aggregated to the tract level. Some of the items were replicated from Putnam’s 2000 Social Capital Benchmark Survey (Saguaro Seminar, 2000), but items were combined differently in some cases to produce different scales than Putnam used.
Our social trust scale is a mean score of: “Generally speaking, would you say that most people can be trusted or that you can’t be too careful in dealing with people? Most people can be trusted, Can’t be too careful” and “How much do you trust the following groups of people? trust them a lot, trust them some, trust them only a little, trust them not at all, does not apply: ‘People in your neighborhood,’ ‘People you work with,’ ‘People at your church or place of worship,’ ‘People who work in the stores where you shop.’” This is a replication of Putnam’s social trust scale, and all items load on a single principal components factor.
Our bonding and bridging social network scales are principal components factors from: “About how many family and close friends do you have in each of these groups? (People you’re close enough to, that you’d visit each other at home.) About 0-5, About 5-15, About 15-50, About 50-100, About 100 or more.” Bonding social networks: “Family and friends who live in your New Orleans neighborhood,” “Family and friends of your faith who live in Greater New Orleans,” and “Family and friends of your race who live in Greater New Orleans.” Bridging social networks: “Family and friends who live in a different neighborhood in Greater New Orleans,” “Family and friends of a different faith who live in Greater New Orleans,” and “Family and friends of a different race who live in Greater New Orleans.”
Our civic engagement scale is a principal components factor from: “Have you taken part in activities with the following groups and organizations in the past 12 months (Yes, No)? ‘A neighborhood association, like a block association, a homeowner or tenant association, or a crime watch group’; ‘A charity or social welfare organization that provides services in such fields as health or service to the needy’; ‘A professional, trade, farm, or business association’”; “About how often have you done the following? (Every week or more often, Almost every week, Once or twice a month, A few times per year, Less often than that, Never)? ‘Attended a club meeting,’ ‘Attended any public meeting in which there was discussion of town or school affairs’”; and “In the past twelve months, have you served as an officer or served on a committee of any local club or organization? (Yes, No).” This scale uses items from Putnam’s questionnaire, but combines them into a new scale.
Our violent crime data were collected from the New Orleans Police Department. The raw data included geographic information on incidents of aggravated assault, homicide, and robbery that occurred between January 1, 2000, and December 31, 2014. 4 Incidents were geocoded to Census 2010 tract boundaries and aggregated to determine the number of violent crimes that occurred in each tract annually. To account for annual fluctuations in crime, we computed 3-year violent crime counts around 2002, 2009, and 2013 for our dependent variables. For instance, the violent crime value at 2002 was the sum of the number of violent crimes for 2001, 2002, and 2003. We chose 3-year windows because of their timing in relation to the Hurricane Katrina.
Finally, most of our data points—the ACS data, our survey, and the violent crime data—were collected over several years to build up sample and to reduce the instability of a single year’s data. While we utilize three pooled time points for social structure and violent crime, we only have one pooled time period available for collective resources from our survey. Thus, we are not able to build full time-series models. To check effects, we treated the collective resources data as a constant during the study period. This procedure gave us a way to assess plausible changes in the effects of collective resources at different times. As a partial approximation of time series changes, we leverage questions on our survey that ask where the respondent lived before and after the storm. For our pre-storm models, we aggregated respondents to their pre-storm residential locations, and for post-storm models, we aggregated respondents to their post-storm locations. This dual aggregation procedure does not change results greatly. In addition, we controlled for the mean date per tract of the survey interviews, and this control was not significant, nor did it change other coefficients in the model greatly (for further analysis and discussion of potential change over the sampling period, see Weil et al., 2018).
Our analyses also controlled for the spatial autocorrelation of violent crime. The assessment of spatial autocorrelation required the selection of a spatial weights matrix, which was a somewhat arbitrary decision influenced by our data and relevant theory (Anselin, 2002). Given the distribution of census tracts in New Orleans, we decided upon a queen’s continuity weights matrix. Results of Moran’s I analyses indicated significant spatial clustering of violent crime for all three cross-sections, so we incorporated spatial lags of violent crime for each cross-section into our multivariate analyses.
Method
We use negative binomial regression to predict the total number of violent crimes that took place in each tract in New Orleans for 3 years over three time periods: pre-Katrina (2001-2003), soon after Katrina (2008-2010), and long after Katrina (2013-2015). Results are not sensitive to moving the time window up or down a year or using 4-year windows. We also used ordinary least squares (OLS) regressions to check for multicollinearity among the independent variables, but found no indication of issues with the analysis. Most variance inflation factors (VIFs) were in the 1-2 range, and none exceeded 3.9.
We predict the number of violent crimes in each time period separately and test whether the effect of covariates differ at different time periods by using a model that includes all time periods and interactions with time while clustering standard errors to account for multiple observations per tract. We show significant differences from the first time period at the .05 level using bolded coefficients.
Results
Descriptive statistics are shown in Table 1 for the 165 census tracts in our analyses. A few features are notable. First, the level of violent crime per tract declined significantly from before to after Hurricane Katrina, but then it rose significantly above pre-Katrina levels. None of the remaining variables show a statistically significant change across time periods. A number of our variables are based on factor scores and thus have means near zero. (Factor scores by definition have a mean of 0 and a standard deviation of 1.0.) However, while the scale for concentrated disadvantage is computed at the tract level and thus has a standard deviation near 1, the survey-based factor scales were computed at the individual level and aggregated to the tract level, and thus, while the means are still near zero, the standard deviations for tracts may vary from 1.0. The social trust scale is a mean over items. Also included in Table 1 are descriptive statistics for percent African American and average family income in constant 2014 U.S. dollars. These variables are not included in our multivariate analyses, but they give a sense of New Orleans’ demographic makeup. Although the percent African American declined and income rose at the tract level, neither change is statistically significant, mainly because of the large standard deviations. 5 Thus, while our dependent variable shows significant fluctuation over time, our independent variables are much more stable. Still, our focus in this article is not change in aggregate levels of violent crime, but rather the etiology or correlates of violent crime.
Descriptive Statistics.
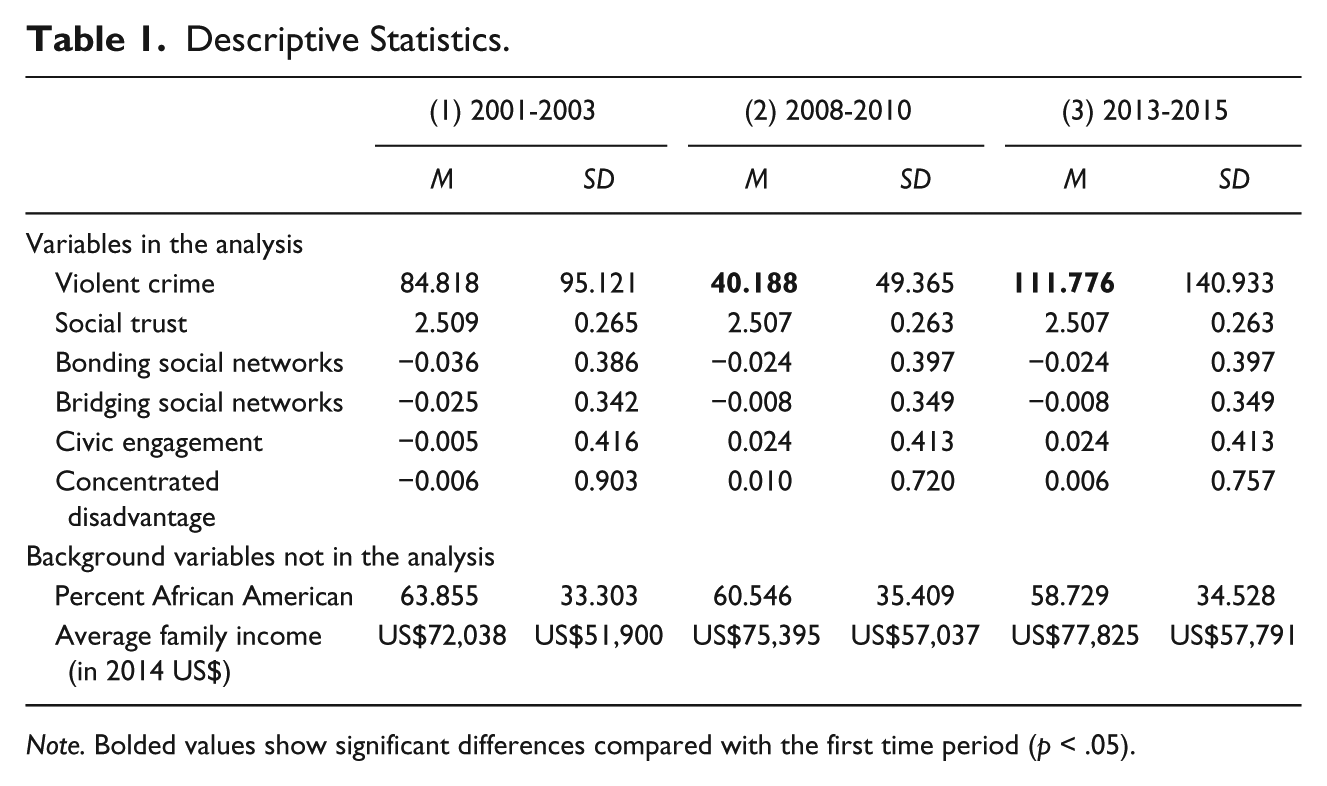
Note. Bolded values show significant differences compared with the first time period (p < .05).
Table 2 shows multivariate models that test our hypotheses, and for reference, the table in the appendix gives zero-order bivariate associations (negative binomial regressions with only one predictor) that correspond to the coefficients in Table 2. Hypothesis 1 asserts that concentrated disadvantage will predict violent crimes. As expected, we find that violent crimes are more common in areas of concentrated disadvantage at all time periods.
Predictors of Violent Crime in New Orleans Before and After Hurricane Katrina: Negative Binomial Regressions.
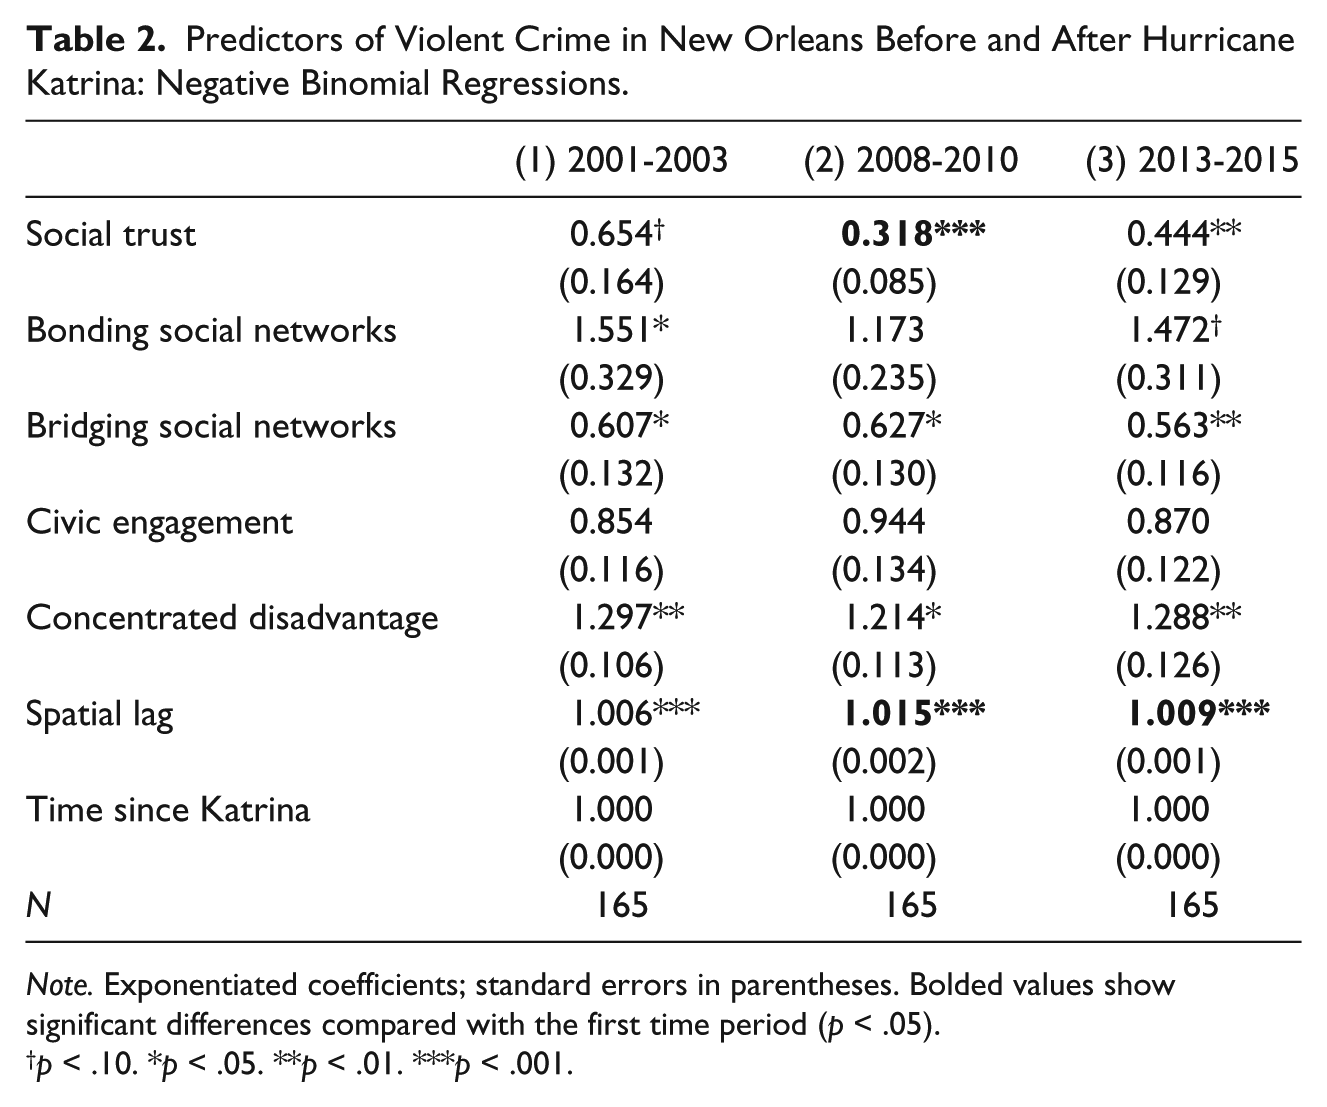
Note. Exponentiated coefficients; standard errors in parentheses. Bolded values show significant differences compared with the first time period (p < .05).
p < .10. *p < .05. **p < .01. ***p < .001.
Hypothesis 2 focuses on the role of social trust in predicting violent crime. Table 2 shows that social trust was significantly associated with less violent crime in all three periods. This association was significantly stronger in the first post-Katrina period than the pre-Katrina period, but the later post-Katrina period was not significantly different from the pre-Katrina period. Thus, there is some evidence that the post-disaster change may have been temporary.
Hypothesis 3 posits that neighborhoods with high levels of bridging social network ties will have fewer violent crimes, while those with high levels of bonding ties will have more violent crimes. We find evidence for both propositions, but support is stronger that bridging social ties are associated with fewer violent crimes. Table 2 shows significant associations with bridging social ties for all three time periods. We find less evidence that bonding social ties increase violent crime. Table 2 indicates that bonding social ties are significantly associated with more violent crimes in the pre-Katrina period, and marginally associated in the last period, though the nonsignificant associations in all time periods are in the predicted direction. Thus, both bonding and bridging social ties produce the hypothesized associations with violent crimes, but bridging ties have a stronger association.
Hypothesis 4 predicts there will be fewer violent crimes in neighborhoods with stronger civic engagement. Consistent with previous research, we find that civic engagement shows no association with violent crimes after controlling for other factors. To be sure, bivariate analysis suggests that neighborhoods with higher civic engagement have fewer violent crimes, but this association is explained mainly by concentrated disadvantage. Thus, disadvantaged neighborhoods evidently have lower civic engagement and more violent crimes.
Our final hypotheses ask whether the relationships of collective resources or concentrated disadvantage with crime were altered by the disaster. Social trust is the only collective resource that was significantly different after Katrina than before the storm. Table 2 shows that neighborhoods with greater social trust had fewer violent crimes, and this association grew significantly stronger after the storm, and then evidently weakened somewhat. None of the other collective resources had significantly different associations before and after Katrina. Bridging social network ties were significantly related to less violent crimes both before and after the storm; and bonding social network ties were significantly associated with more violent crime in the first and third periods. However, these differences across periods are not themselves statistically significant. And civic engagement has no significant association with violent crime at any period. These findings provide some support for the altruism theory of disaster, which posits that social solidarity will emerge after a disaster and reduce violent crime, but that its influence will fade as recovery gives way to a new normal.
We also find evidence that contradicts the second disaster theory which states that disasters increase the impact of concentrated disadvantage on crime. On the contrary, the association with disadvantage appears to have weakened shortly after the storm and then strengthened long after the storm, but the changes between models are not statistically significant. Thus, our findings give little support to the second disaster theory and possibly contradict it.
Finally, we note that there was a significant spatial lag in our models at all three time periods, and that this effect was significantly stronger after Hurricane Katrina than before the storm. We interpret this effect as showing that there remain further unmeasured factors that may influence violent crime, even after taking into account the factors we measured.
Summary and Discussion
Our study assesses the importance of collective resources for violent crime before and after a major disaster, also taking into account the influence of concentrated disadvantage. Researchers have proposed a range of factors that might intervene between concentrated disadvantage and crime, including social control, social capital, social networks, collective efficacy, civic engagement, and organizations and institutions, as well as the effects of a major disaster. However, research results have been mixed. Collective efficacy shows consistent negative correlations with crime (Sampson, 2012), though critics have questioned the operationalization of the concept and its causal position (Hipp, 2016; Hipp & Wo, 2015). Research has been mixed as to the effect of social networks on crime (Bellair & Browning, 2010; Kubrin & Wo, 2016). Citizen participation or civic engagement are generally not found to have an effect on crime (Sampson, 2012), though civic organizations may have the potential of reducing crime (Wo et al., 2016). And research has produced a range of results as to whether a major disaster tends to raise or lower crime (Curtis & Mills, 2011; Doucet & Lee, 2015; Frailing & Harper, 2016a, 2016b; Prelog, 2016; Spencer, 2017; Zahran et al., 2009).
We reconsider these questions, using a large (N = 5,060) survey we conducted of Hurricane Katrina survivors in New Orleans that included measures of several types of collective resources. Our results shed new light on how particular forms of collective resources may affect violent crime. Some of our results reconfirm standard findings in the literature; other findings show patterns that have been suggested in the literature but not directly demonstrated; and other findings show clear support for one, but not the other, of the two major propositions about the effects of a disaster on the etiology of crime.
First, we find that social trust is significantly associated with lower levels of violent crime over all periods examined. This result replicates a fairly standard finding in the literature, especially inasmuch as trust is a common element in both the social capital and collective efficacy approaches, as Kubrin and Wo (2016) point out. Although this finding is not new, the changes in trust’s association with crime provide new evidence about disaster theories, as we discuss below.
Second, social networks affect the incidence of violent crime, but bonding and bridging network ties work in opposite directions. Thus, we find that neighborhoods with strong bridging (out-group) networks have less violent crime, while neighborhoods with strong bonding (in-group) networks have more violent crime, and the bridging associations are stronger than the bonding associations. These findings parallel Brown’s (2016) ethnographic research and suggest that the distinction between bonding and bridging networks may help tie together disparate and often inconsistent findings in the literature as to whether social ties have positive, negative, or nonexistent effects on crime (Bellair & Browning, 2010; Kubrin & Wo, 2016). Previous research has shown the bridging/bonding distinction with proxy measures like religious denominations or community organizations (Beyerlein & Hipp, 2006; Wo et al., 2016), but generally not for social networks among neighborhood residents. More broadly, our findings are consistent with Wilson’s (1987) social isolation thesis, that neighborhoods without bridging contacts have more social dislocations like violent crime.
Third, like most other research (Kubrin & Wo, 2016), we find no effect of civic engagement on reducing violent crime when concentrated disadvantage is taken into account. Civic engagement is significantly linked with lower violent crime rates in zero-order associations, but its influence is accounted for by the effects of concentrated disadvantage. We measured civic engagement as citizen participation, rather than as the number of organizations in a neighborhood, and our results are similar to others in the literature (Sampson, 2012). Research on the number of nonprofits in an area does often find a negative correlation with crime (Wo et al., 2016), but we would argue that this is a somewhat different phenomenon than citizen participation. First, the number of organizations may be a proxy, rather than a direct, measure of citizen engagement. Second, organizations may reflect elite actions, placing them in a neighborhood, rather than grassroots efforts. And third, while participatory civic engagement may not affect crime, it does affect other social outcomes, as we discuss further below.
Fourth, our findings reconfirm the central importance of concentrated disadvantage for violent crime. Violent crime rates were significantly higher in disadvantaged neighborhoods throughout all three time periods we examine. This finding, while not new (Kubrin, 2003; Pyrooz, 2012; Valasik et al., 2017), is also important as a control to our new findings about social cohesion.
Fifth, our findings shed new light on the effects of a major disaster on violent crime. We find support for the altruism disaster theory, which predicted that social solidarity would emerge after a disaster and then return to latency as recovery proceeds, and that this emergence would reduce crime early in the post-disaster period before wearing off (Meyer, 2018; Quarantelli & Dynes, 1977; Rodriguez et al., 2006; Solnit, 2009). As anticipated, neighborhoods with greater trust had lower levels of violent crime in the aftermath of Katrina, but the association may have moderated somewhat in the longer term. Following the altruism theory, one could argue that people pulled together as they worked to recover from the disaster, and that their heightened solidarity helped reduce violent crime after the disaster. Yet as this emergent solidarity returned to its usual latent state as recovery proceeded, its influence on violent crime also faded.
Our findings do not support the second disaster theory we reviewed, which predicts that rising social inequality after a disaster produces more violent crime (Bolin, 2007; Elliott & Pais, 2010; Schultz & Elliott, 2013). Rather, our findings show that the relationship of concentrated disadvantage either shows no significant change after the disaster or perhaps even declines somewhat. A possible reason for the difference is the inclusion of our measures of collective resources, which previous post-disaster studies were unable to incorporate.
Thus, our research provides new and rare evidence of the importance of collective resources on reducing violent crime, while also supporting established findings about the importance of concentrated disadvantage in increasing violent crime. Because neighborhood data on collective resources are still scarce, and because research findings are still in flux, we provide important new evidence in a city with high levels of violence. Moreover, because data are seldom available in the context of a major disaster, we provide an important look at the importance of collective resources in the context of a disaster event. Taken together, our findings support several long-standing hypotheses about the impact of collective resources that researchers have not often been able to examine; they provide new evidence about the impact of major events like disasters; and they provide an additional benchmark should further data become available in other times and places. Thus, our findings do not so much differ from previous research, as add new evidence for several central conjectures in the literature that could not yet be evaluated due to data limitations. While our findings about the influence of concentrated disadvantage, social trust, and civic engagement broadly replicate previous findings, our findings about the influence of bridging and bonding networks and changes after a disaster are new. Data had not been available to test these conjectures before, except with less direct proxy measures, and we have been able to shed new light on these influences with more adequate data.
It is important to note a few limitations of our analyses. First, several of our data points are pooled data measured over a period of time, including the crime data, the ACS data, and our survey. We sought to mitigate the effect of pooling multiyear survey data by controlling for the mean date of interviewing per tract. This control had no statistically significant association, and changes in the other coefficients were very small.
Second, even though our survey data were collected over a period of time, our collective resource indicators are not longitudinal and represent only one effective time period. To our knowledge, such longitudinal data do not exist, and our survey provides some of the only measures of certain forms of collective resources at all. We seek to mitigate this limitation by aggregating respondents into their pre- and post-storm residential locations, corresponding to pre- and post-storm crime observations. Thus, our results represent plausible baseline models that could be reexamined by future research should longitudinal measurements of collective resources become available (see Weil et al., 2018).
Finally, as Prewitt and colleagues (2014) note, research has not yet fully settled on scales and indicators of collective resources. We adapted many of our questions from Putnam’s 2000 Social Capital Benchmark Survey (Saguaro Seminar, 2000) but combined items differently in some cases to produce different scales than Putnam used. In the interest of concision, our measures of bonding and bridging social networks do not attempt to use name or position generators or measure full networks. We also did not attempt to replicate Sampson et al.’s (1997) collective efficacy scale because our research was focused on disaster recovery, while many of the collective efficacy items focus on responses to delinquency.
Our findings indicate that certain forms of collective resources affect violent crime, while others do not. More broadly, our findings suggest that we probably stand closer to the beginning of research on collective resources than to its consolidation, largely because so little data have been available. Indeed, collective resources might produce different effects on different social outcomes, besides violent crime. Take civic engagement. Our analyses showed that civic engagement did not affect violent crime in New Orleans once concentrated disadvantage was taken into account. Yet other studies in post-Katrina New Orleans have shown that civic engagement helped residents achieve shared goals like repopulation or blight reduction (Weil, 2012; Weil et al., 2018). Perhaps it matters whether the goals or social outcomes are cooperative or adversarial. Thus, neighborhood residents cannot easily organize against violent crime because perpetrators are uncooperative, dangerous, and adaptive. At the same time, neighborhood residents may be able to cooperate to take collective measures to achieve goals that are held in common, like recovery from a disaster. We cannot pursue such interpretations further here, but clearly, there is much room for further research.
Thus, we may still be at an early stage of mapping out the effects of different types of collective resources on social outcomes like violent crime or disaster recovery. Our analysis sheds new light on these processes and provides a new benchmark in an important city. Just as importantly, our study demonstrates the importance of collecting data on collective resources, which has remained too rare. The recent initiative by the American Housing Survey to measure collective efficacy in many cities over time (Prewitt et al., 2014) is an important step in that direction. These data, and data on other forms of collective resources, can permit comparative and historical analysis, which can help us develop a fuller understanding of how collective resources operate.
Footnotes
Appendix
Zero-Order or Bivariate Associations of Violent Crime With Predictors in Table 2 in New Orleans Before and After Hurricane Katrina.

| (1) 2001-2003 | (2) 2008-2010 | (3) 2013-2015 | |
|---|---|---|---|
| Social trust | 0.210*** |
|
|
| (0.052) | (0.029) | (0.030) | |
| Bonding social networks | 1.156 | 0.863 | 0.951 |
| (0.229) | (0.181) | (0.207) | |
| Bridging social networks | 0.590** | 0.464*** | 0.458*** |
| (0.118) | (0.099) | (0.096) | |
| Civic engagement | 0.485*** | 0.579** | 0.523*** |
| (0.071) | (0.098) | (0.085) | |
| Concentrated disadvantage | 1.427*** | 1.180 † | 1.350** |
| (0.107) | (0.117) | (0.124) | |
| Spatial lag | 1.009*** |
|
|
| (0.001) | (0.002) | (0.002) | |
| Time since Katrina | 1.000 | 1.000 | 1.000 |
| (0.000) | (0.000) | (0.000) | |
| N | 165 | 165 | 165 |
Note. Exponentiated coefficients; standard errors in parentheses. Each table cell is the coefficient and standard error from a negative binomial regression with only one predictor. Bolded values show significant differences compared with the first time period (p < .05).
p < .10. *p < .05. **p < .01. ***p < .001.
Declaration of Conflicting Interests
The author(s) declared no potential conflicts of interest with respect to the research, authorship, and/or publication of this article.
Funding
The author(s) disclosed receipt of the following financial support for the research, authorship, and/or publication of this article: This research was supported by National Science Foundation Grants SES-0554572 and SES-0753742, by research grants from the Jewish Federation of Greater New Orleans and Greater Baton Rouge, and by an LSU (Louisiana State University) Faculty Research Grant.