



Abstract
The objective of this study was to analyze whether the experience of violence by teachers in the school environment increases the risk of teachers suffering violence again within a 2-year period. This longitudinal study included 430 primary and secondary public school teachers from a city in the south of Brazil, with data collected at two time points: T1 (2012-2013) and T2 (2014-2015). The data were obtained via face-to-face interviews and the completion of a questionnaire. The forms of violence investigated included reports of insults from students, humiliation or embarrassment by colleagues or superiors, and threats and physical violence from any member of the school occurring in the 12 months prior to the study. McNemar’s test and the Poisson regression with robust error variance were used in the analyses, and the relative risk (RR) and 95% confidence interval (95% CI) were calculated. After 2 years, there was a reduction in violence reported by the teachers from 65.4% (T1) to 56.9% (T2) (p = .003). Teachers who suffered a certain form of violence had three times the risk of suffering that type of violence again. Those who reported three or four forms of violence at T1 had an RR of 2.23 of suffering any form of violence at T2 (95% CI [1.70, 2.93]) compared with those who did not report violence at T1. Psychological violence at T1 was not associated with physical violence at T2, nor was physical violence at T1 associated with psychological violence at T2. Despite the reduction in violence against teachers reported at T2, some forms of violence remained stable after 2 years. Suffering more forms of violence increases the risk of suffering any future violence.
Introduction
Teachers from around the world often experience violence in the workplace (Bauer et al., 2007; Melanda et al., 2020; Moon & McCluskey, 2016; Wei et al., 2013; Wilson, Douglas, & Lyon, 2011). A study performed in South Korea with a representative national sample of 996 teachers found that in the 2 years prior to the survey, almost 30% of the respondents reported at least one experience of verbal threat or abuse, and approximately 20% experienced aggressive behavior by students (Moon & McCluskey, 2016). In Germany, more than 40% of teachers reported insults, and approximately 4% reported threats of violence by students (Bauer et al., 2007). In another study conducted in Minnesota in the United States involving 6,469 teachers, 32.9% reported verbal abuse, 20.6% reported threats, 11.6% reported bullying, 8.3% reported physical violence, and 4.5% reported sexual harassment (Gerberich et al., 2011). In Brazil, a systematic review showed that more than 70% of teachers reported aggressions such as verbal insults by students (Nesello et al., 2014).
Some aspects related to teachers’ work and to the school environment, such as school climate and the relationship between teachers and students, can increase the risk of violence. In the United States, Wei et al. (2013) found that substitute or part-time teachers were at a greater risk of nonphysical violence. In that same study, teachers working in public schools were at a greater risk of both physical and nonphysical violence compared with those working in private schools. A study with Israeli students showed that negative characteristics of the school climate, such as a lack of school policies on aggressive behavior and teacher support for students, were associated with higher levels of aggression against students and teachers (Khoury-Kassabri, 2012). Another study conducted in Brazil showed that poor relationships with superiors or students were associated with at least one episode of psychological violence from any member of the school in the 12 months prior to the survey (Melanda et al., 2020).
Although there is no consensus in the literature, studies indicate that female teachers (Bauer et al., 2007; Moon & McCluskey, 2016; Moon, Morash, Jang, & Jeong, 2015; Wei et al., 2013) and younger teachers (Bauer et al., 2007; Melanda et al., 2020; Russo, Milić, Knežević, Mulić, & Mustajbegović, 2008; Wei et al., 2013) are at a greater risk of suffering violence in the school environment. Moreover, in Brazil, similar to many other countries, violence is closely related to ethnicity and race/color and primarily affects black, mixed, and indigenous populations (Mascarenhas et al., 2009; Soares Filho, 2011). Epidemiological studies that have addressed these issues among teachers are rare and have yielded inconsistent results. In the United States, for example, Dworkin, Haney, and Telschow (1988) assessed a sample of 291 urban public school teachers and found that “black” or “brown” teachers were less likely to report being victimized; this result was similar to the findings of McMahon et al. (2014), who reported that African American teachers were also less likely to report victimization in a national study with almost 3,000 teachers. Other studies conducted in the North American state of Minnesota and in Brazil did not identify differences in experiences of violence according to the teachers’ ethnicity or race/color (Gerberich et al., 2011; Melanda et al., 2020; Wei et al., 2013).
The effects of violence in the workplace are numerous and include mental health problems in several occupational categories. Systematic reviews of longitudinal studies with employees showed that in general, bullying from colleagues is associated with anxiety and depression (Nielsen & Einarsen, 2012; Nielsen, Magerøy, Gjerstad, & Einarsen, 2014; Verkuil, Atasayi, & Molendijk, 2015) and with complaints related to mental health and stress (Verkuil et al., 2015). However, these studies also showed an inverse relationship in which mental problems may result in a higher risk of bullying because individuals with high levels of mental suffering may have difficulties performing their work activities, low self-esteem, and greater difficulty defending themselves from possible aggressive behavior (Finne, Knardahl, & Lau, 2011). These people may also have a lower tolerance to violence and lower thresholds for considering certain behaviors as bullying (Finne et al., 2011; Nielsen & Einarsen, 2012).
In addition, victimization itself is a possible predictor of future violence. Longitudinal studies evaluating the recurrence of workplace violence are rare. One of these studies that was conducted in Denmark with health workers showed that experiencing physical violence and threats was an important predictor of revictimization from these same forms of violence after 2 years of follow-up (Hogh, Sharipova, & Borg, 2008). Another study conducted in the United States with nonfaculty university employees found that victimization by coworkers or supervisors remained stable over time. In addition, in that study, victimization by coworkers was a predictor of victimization by supervisors after 13 months of follow-up, even after controlling for demographics, situational factors (job characteristics and role stressors), and supervisor victimization variables (e.g., “supervisors put me down” and “supervisors argue with me”) in the baseline study (N. A. Bowling, Beehr, Bennett, & Watson, 2010). No similar studies were found with teachers.
The study of the recurrence of violence is important because such recurrence can lead to greater negative effects on health and work compared with isolated and striking events (Bonde et al., 2016; Kivimäki et al., 2003). Despite the scarcity of longitudinal studies on the recurrence of workplace violence, some cross-sectional studies give indicators of teachers who are most vulnerable to these events. Factors related to the school climate (Khoury-Kassabri, 2012), the teachers’ working conditions, and the teachers themselves (sociodemographic and health conditions, particularly stress and mental suffering) (Finne et al., 2011) may play an important role in teachers’ revictimization. Furthermore, physical violence in the workplace may be preceded by aggressions of psychological nature (Dillon, 2012); in addition, workplace violence levels remain stable across time for at least one professional category—nonfaculty members of a university in the United States (N. A. Bowling et al., 2010). Moreover, suffering multiple forms of psychological violence is cross-sectionally associated with the experience of physical violence among Brazilian school teachers (Melanda et al., 2020); this result may indicate that teachers who suffer more forms of school violence may present a higher risk of suffering violence again in the future. Thus, the present study aims to analyze whether the experience of violence by teachers in the school environment increases the risk of teachers suffering violence again after 2 years of follow-up; the analyses were adjusted for potential confounders related to teachers’ sociodemographic variables, working conditions, and mental health status (anxiety and depression). The following hypotheses were formulated:
Method
This prospective cohort study assessed primary and secondary school teachers from the state education network of Londrina, Paraná state, Brazil, with an estimated population in 2012 of 515,707 inhabitants (IBGE, 2013). In 2013, the state education network of Londrina was composed of 73 schools with 51,093 students enrolled (Paraná, 2013).
Participants
The baseline study (T1) was conducted between August 2012 and June 2013. At this stage, all teachers responsible for primary and secondary school activities in the 20 public schools with the largest number of teachers (i.e., those schools with more than 70 teachers) were selected for the study. This target sample was defined in a convenience manner because of the logistics of data collection and representativeness. According to the official education statistics of the city, approximately 70% of all teachers working in the state education network of the city were working in these 20 schools. In addition, these schools were located in all regions of the city (north, south, east, west, and center); therefore, all the urban regions were covered. In addition, many of the teachers who worked in these 20 schools also worked in the smaller schools; thus, they were approached more than once for the interview. These characteristics indicated that the sample was representative of the reference population—teachers working in the state education network of the city. Teachers who were on leave and did not resume their work activities after 30 days of completing data collection at each school, those who did not agree to participate in the survey, and those whom we were unable to contact after five attempts were considered losses.
The follow-up study (T2) was conducted approximately 24 months later, between August 2014 and April 2015. The teachers who participated in the previous study were contacted again. Teachers who were no longer teaching were excluded from the study. Those who had transferred to another school were interviewed at the new workplace. Because of a teachers’ strike, data collection was interrupted in April 2015. At this stage of the study, teachers who were not contacted due to the strike, those who could not be located, and those who refused to participate in the study were considered losses.
The data collection in each school took 3 weeks. The information was obtained via face-to-face interviews, except for the race/color variable, which was self-reported by the interviewees in a questionnaire. The questionnaire was used to obtain data on more sensitive issues, such as self-reported race/color, other variables not used in the present study (monthly income, religion), and to apply validated scales whose results were used only in the larger study. All interviewers were previously trained. The interviews and questionnaires lasted approximately 45 min and were performed in a private place, such as classrooms or other school rooms without the presence of other people, with the aim of avoiding someone overhearing the content of the interview. All the participants signed an informed consent form at both collection stages. The project was approved by the Research Ethics Committee of the State University of Londrina.
Measures
Violence in the workplace
Data on violence against teachers were collected at T1 and T2. All variables described below were determined considering the violence suffered in the school environment and in the 12 months prior to the survey using the following questions:
Insults from students: Have you received insults from or were you made fun of by your students?
Humiliation or embarrassment by colleagues or superiors: Have you felt humiliated or embarrassed by your superiors or colleagues?
Threats received: Have you been threatened (threats to physical integrity, family members, etc.) by any member of the school?
Physical violence: Have you suffered physical aggression (or attempted aggression) or armed violence (firearms or cold weapons, for example, a knife or other sharp objects) by any member of the school?
The answer choices were “yes” and “no.” Insults from students, humiliation or embarrassment by colleagues or superiors, and threats received were considered individually or in the group “psychological violence,” which was defined as at least one report of one of the aforementioned forms of violence. For H5, the forms of violence at T1 were added, generating the variable “number of forms of violence,” with categories that ranged from zero (report of no forms of violence) to four (reports of insults from students, humiliation or embarrassment by colleagues or superiors, threats, and physical violence).
Adjustment variables
The following variables were adjusted for in the analysis: sex, age (continuous), race/color (white, Asian, black/mixed/indigenous), employment contract (temporary, permanent), weekly workload –, that is, the number of working hours in a week (continuous), self-reported medical diagnosis of anxiety (yes, no), and self-reported medical diagnosis of depression (yes, no).
Data analysis
The data were double-entered into a database created in the Epi Info software, Version 3.5.4, and tabulated using the Statistical Package for Social Sciences (SPSS) software, Version 19.0 (IBM Corp., Armonk, NY, USA; released 2013). To compare the occurrence of violence at T1 and T2, McNemar’s test was used, with a significance level of 5%. For the risk analysis, the Poisson regression with robust error variance was used, using relative risk (RR) as a measure of association, with a significance level of 5%, and with the p-value and 95% confidence interval (CI) presented. For all variables, a reference category (RR equal to 1) was established; the reference category represented the lowest risk for occurrence of the outcome. The use of Poisson models with robust error variance has been shown to be reliable for estimating RRs in studies where the incidence of the outcome of interest is common in the study population (>10%) (Barros & Hirakata, 2003).
Results
Of the 1,126 teachers eligible for the baseline study (T1), 65 were on leave and did not resume their work activities within 30 days after the completion of data collection at their school, 63 refused to participate, and 20 did not attend the scheduled interviews or could not be found, even after five attempts, resulting in 978 teachers interviewed (response rate = 86.9%). When contacted for the follow-up study, 101 were no longer teaching in the public state education system, leaving 877 teachers eligible for interviews. Of these, 385 (43.9%) were not contacted due to the teachers’ strike, 40 (4.6%) could not be located, and 22 (2.5%) refused to participate, resulting in a final sample of 430 teachers (response rate = 49.0%).
The losses were analyzed to evaluate possible differences between the respondents and nonrespondents. There was no statistically significant difference for most of the variables analyzed in this study (sex, age, weekly workload, anxiety, depression, and forms of violence). The proportion of nonresponders at T2 was significantly higher (p < .05) among black/mixed/indigenous teachers and those with a temporary contract.
The studied population consisted predominantly of female (65.8%) and white teachers (75.8%). At T1, the mean age was 41.7 years (standard deviation of 9.6 years), with a minimum of 19 and a maximum of 67 years. Approximately three-fourths of the teachers had a permanent contract with the state (75.8%) and worked in two or more places (73.5%). The mean weekly workload was 38.5 hr (standard deviation 11.1 hr). The frequencies of self-reported medical diagnosis of anxiety and depression were 20.7% and 13.7%, respectively.
At T1, 65.4% (n = 276) reported at least one of the forms of violence analyzed. At follow-up, this percentage was significantly lower (56.9%, n = 240, p = .003).
Bivariate analyses were performed between the forms of psychological and physical violence reported at T1 and the adjustment variables. Statistically significant associations were observed only between having a temporary contract and suffering physical violence and between a higher weekly workload and reports of humiliation or embarrassment by colleagues or superiors. However, the other variables were maintained as adjustment for epidemiological criteria.
There was a reduction of psychological violence after 2 years (p = .01). When its components were analyzed, this reduction was significant only for humiliation or embarrassment by colleagues or superiors (p < .001). No differences were observed for the other forms of violence investigated (Figure 1).
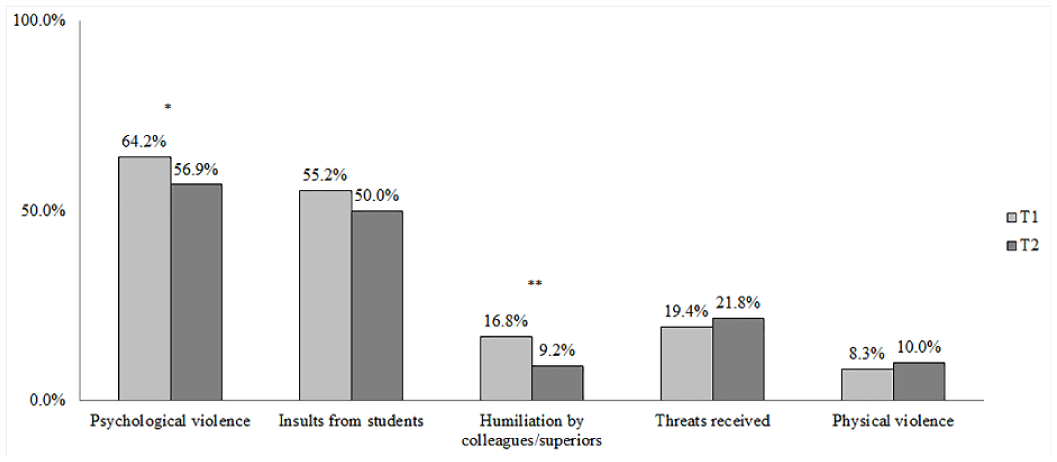
Frequency of reports of school violence against teachers, Londrina/PR, T1 (2012-2013) and T2 (2014-2015).
The analyses of the risk of suffering the same form of violence reported at T1 (H2) and again at T2 are shown in Table 1. For all forms of violence investigated, this risk was higher among teachers victimized in the baseline study, regardless of the sociodemographic, work-related, anxiety, and depression characteristics. Therefore, H2 was fully confirmed.
Prospective Analysis of the Relationship Between Forms of Violence Against Teachers at T1 and the Same Forms of Violence at T2.

Note. Not suffering any form of violence at T1 is the reference category. RR = relative risk; 95% CI = 95% confidence interval.
p-value for the Poisson regression with robust error variance.
Adjusted for sex, age, race/color, employment contract, weekly workload, anxiety, and depression.
Hypotheses H3 and H4 that having suffered psychological violence at T1 increased the risk of suffering physical violence at T2 or vice versa (physical violence leading to an increased risk of psychological violence) were not confirmed in our study. Suffering at least one form of psychological violence and threat at T1 was associated with physical violence at T2 but lost statistical significance after adjustments (Table 2). Physical violence at T1 was predictive of at least one form of psychological violence and of threat at T2 but also lost statistical significance after adjustments (Table 3).
Prospective Analysis of the Relationship Between Having Suffered Psychological Violence (Insults From Students, Humiliation by Colleagues/Superiors, and Threats Received) Against Teachers at T1 and Reports of Physical Violence at T2.
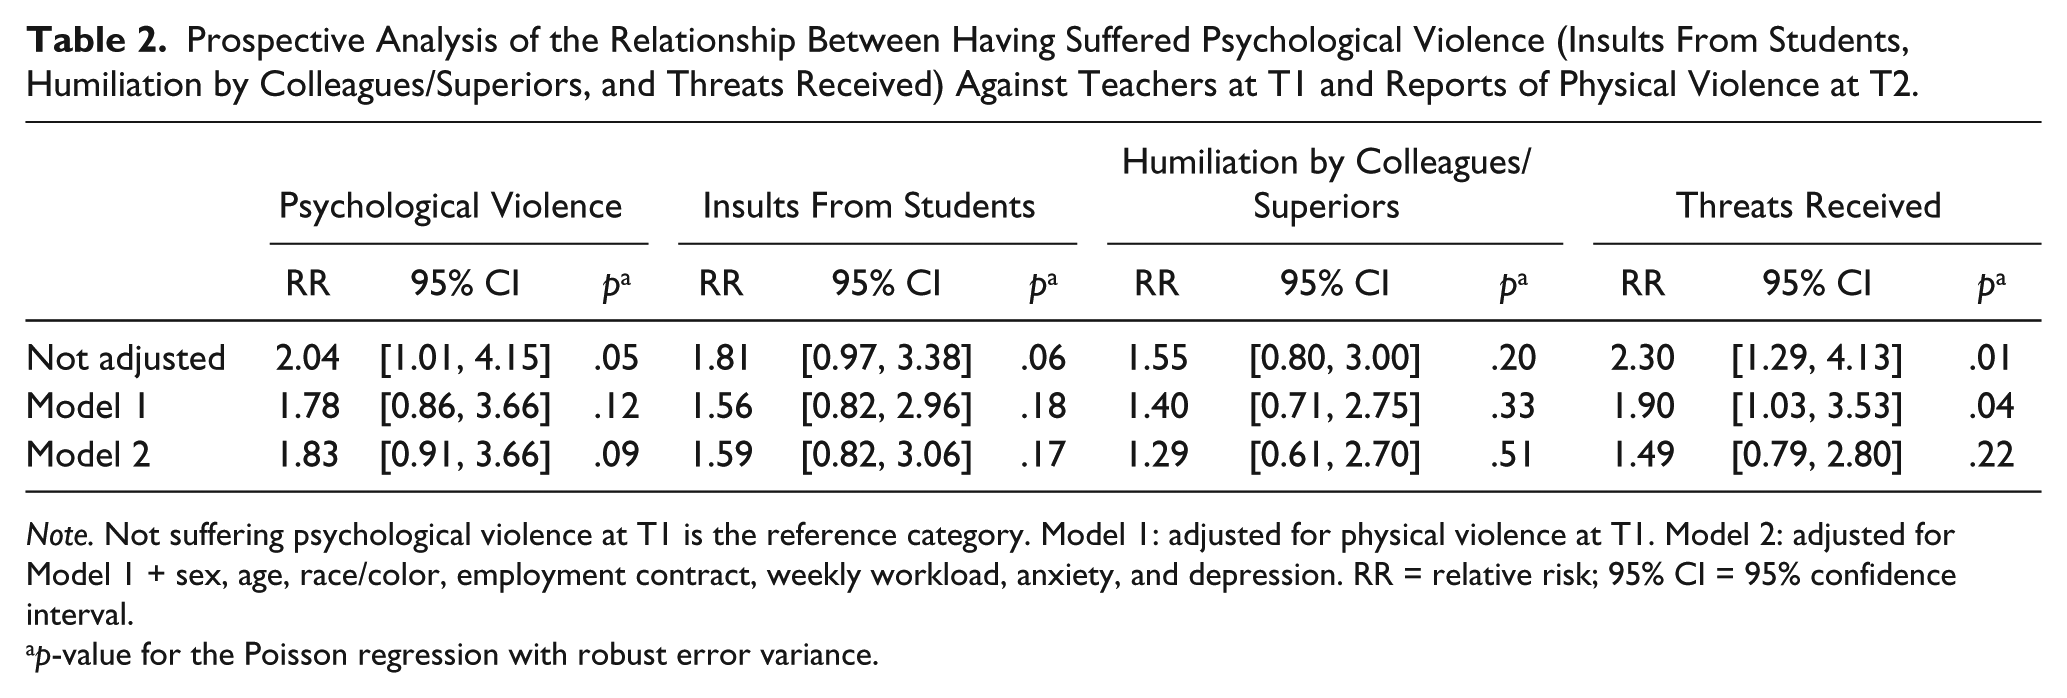
Note. Not suffering psychological violence at T1 is the reference category. Model 1: adjusted for physical violence at T1. Model 2: adjusted for Model 1 + sex, age, race/color, employment contract, weekly workload, anxiety, and depression. RR = relative risk; 95% CI = 95% confidence interval.
p-value for the Poisson regression with robust error variance.
Prospective Analysis of the Relationship Between Physical Violence Against Teachers at T1 and Reports of Psychological Violence (Insults From Students, Humiliation by Colleagues/Superiors, and Threats Received) at T2.
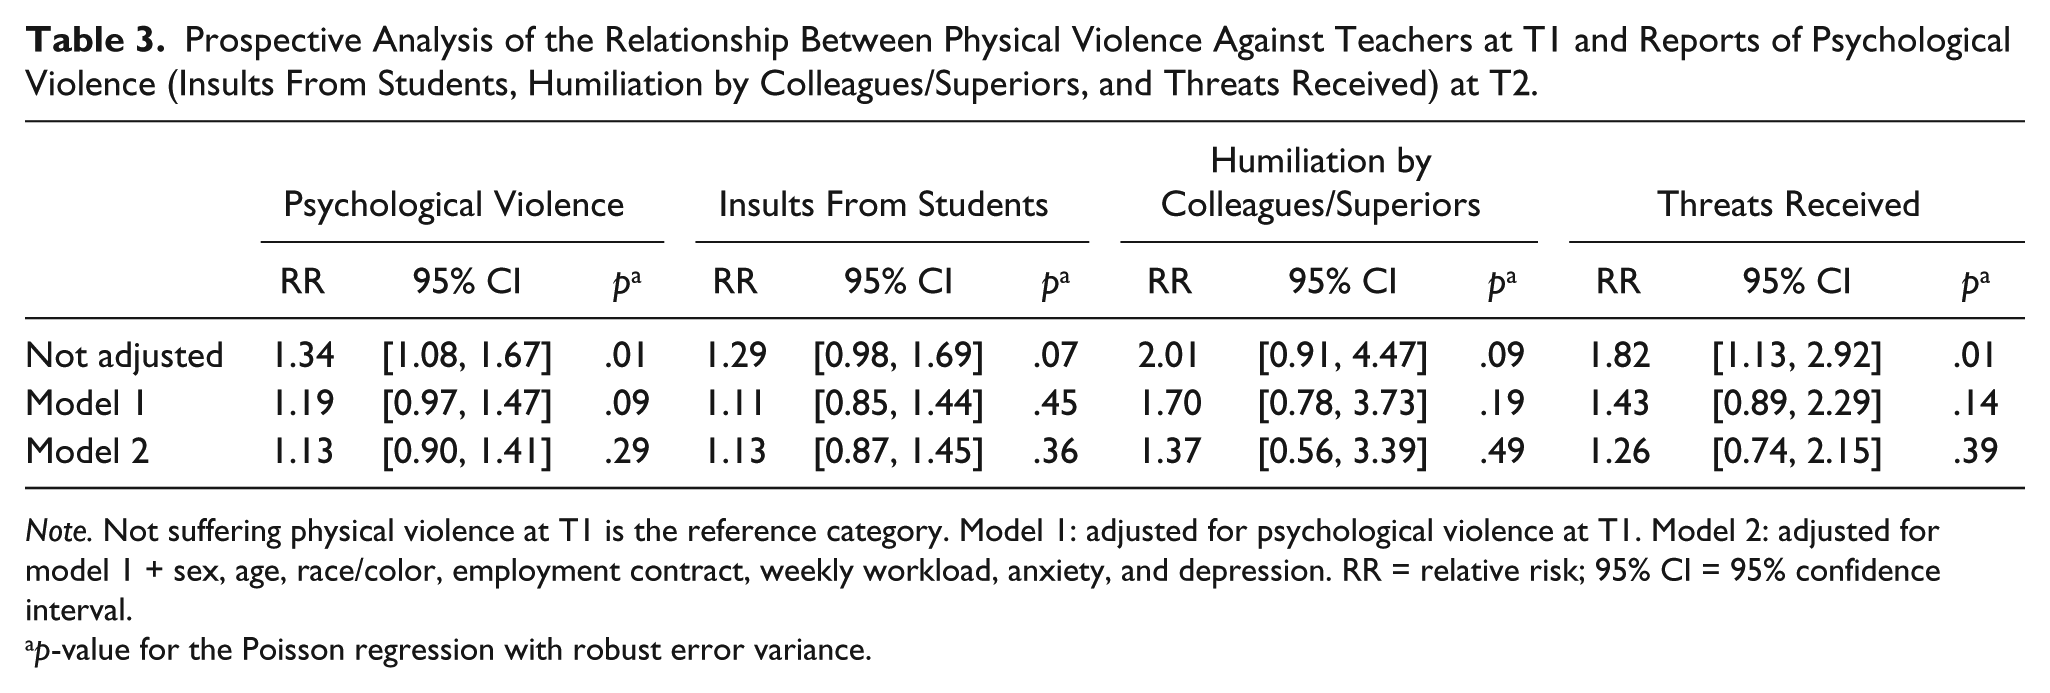
Note. Not suffering physical violence at T1 is the reference category. Model 1: adjusted for psychological violence at T1. Model 2: adjusted for model 1 + sex, age, race/color, employment contract, weekly workload, anxiety, and depression. RR = relative risk; 95% CI = 95% confidence interval.
p-value for the Poisson regression with robust error variance.
Suffering more forms of violence at T1 increased the risk of at least one form of violence at T2 (linear trend p < .001), even after adjustments, with an increase in the RR value according to the number of forms of violence, confirming H5 (Table 4).
Prospective Analysis of the Relationship Between the Number of Forms of Violence at T1 and Reports of at Least One Form of Violence at T2.

Note. No form of violence at T1 is the reference category. RR = relative risk; 95% CI = 95% confidence interval.
p-value for the Poisson regression with robust error variance.
Adjusted by sex, age, race/color, employment contract, weekly workload, anxiety, and depression.
Discussion
In general, there was a decrease in the frequency of violence experienced by teachers, although the frequency of insults from students, threats, and physical violence did not change significantly during the study period; this maintenance demonstrated that the occurrence of such violence remained at stable levels in the school environment, partially confirming H1. The aggressions in the school environment are a reproduction of the violence observed in its surroundings (Malta et al., 2014) and constitute a problem antagonistic to the purpose and function of educational institutions (Khoury-Kassabri, Astor, & Benbenishty, 2009). Insecurity undermines the provision of education, youth access to that education, and the quality of learning (Lima & Bueno, 2014).
Our results confirmed the hypothesis that teachers who experienced a certain form of violence at T1 were at a greater risk of suffering the same form of violence at T2 (H2). The perception of what constitutes a violent act is subjective and intrinsically related to the context in which these events occur. Thus, prior experience of physical or verbal aggression can lead the individual to perceive other situations as violent. In addition, experience with violence is also related to feelings of vulnerability (Gabrovec & Eržen, 2016), insecurity (Gabrovec & Eržen, 2016; Malta et al., 2014), negative perception of the school climate (Berkowitz & Benbenishty, 2012), and fear (Gabrovec & Eržen, 2016; Wilson et al., 2011), which contribute to a more sensitive perception of what violence is.
The risk of the recurrence of violence in the workplace found in this study is in agreement with results found in other longitudinal studies, such as that by Hogh, Borg, and Mikkelsen (2003). In a study conducted with Danish workers, the authors observed a risk of violence up to 12 times higher among employees previously exposed to violence compared with nonexposed workers after 5 years of follow-up. Accordingly, the H5 that a greater number of forms of violence present at T1 increases the risk of suffering any violence at T2 was also confirmed in a dose–response relationship.
H3 and H4 were not confirmed in our study because there was no statistical association in the prospective relationship between psychological and physical violence or vice versa. However, there was a relationship between reports of psychological violence, particularly threats, and physical violence after 2 years, which lost significance only after adjustments. Insults and threats are examples of psychological violence that repress, embarrass, and humiliate the victims, making them more vulnerable to physical aggression (de Lucena et al., 2016). It is therefore common that physical violence is preceded by psychological violence (Dillon, 2012), with violence occurring in cycles, which often starts slowly and quietly and progresses in both intensity and consequence (de Lucena et al., 2016).
Violence against teachers in Brazil occurs in the midst of a scenario of several other inadequate working conditions, particularly in public schools, with overload and intensification of teaching activity, such as overcrowded classrooms and a heavy workload resulting from the time expended both in classrooms and in extra class activities, such as the correction of students’ exams and homework, preparing classes, and performing bureaucratic tasks (Santos & Marques, 2013; Vedovato & Monteiro, 2008). These conditions, in addition to teachers’ lack of autonomy, low salaries, and inadequate infrastructure of public schools, reveal the chronic devaluation and social disqualification of teachers (Rocha & Fernandes, 2008). In addition, violence in the school environment is intrinsically related to Brazilian structural violence (Minayo, 1994), which is grounded in deep social inequalities, exclusion of part of the population from the most basic rights, urban sprawl unaccompanied by social protection policies, and a political elite largely corrupt and indifferent to the population’s needs (Minayo, Assis, & Souza, 2017), all of which undermine the life, society, health, and work of the Brazilian people.
The routine occurrence of these violent events at work reinforces the need to better understand this phenomenon because such events can be considered a prolonged source of stress with important negative effects, such as an increased risk of cardiovascular diseases (Kivimäki et al., 2003), sleep disorders (Bonde et al., 2016), and depression (Bonde et al., 2016; Kivimäki et al., 2003). A population-based study conducted in London, UK, found that the lifetime experience of two or more forms of violence was associated with an increased risk for all negative mental health outcomes, with possible cumulative effects (Kadra, Dean, Hotopf, & Hatch, 2014). A study conducted in Jordan by Al-Modallal (2016) reached similar findings when examining the cumulative effect of violence in childhood and adult life on depressive symptoms in a sample of women 18 to 25 years old.
One of the strengths of this study is that it is a longitudinal analysis of the population on a topic that is still rarely addressed in the literature. In addition, several hypotheses are explored in the context of the recurrence of violence, with the inclusion of different forms of violence and the analyses of associations adjusted for possible confounding variables, such as individual, work-related, and mental health-related characteristics. However, there was a significant loss of black, mixed, or indigenous teachers and those with a temporary contract during the follow-up. In addition to several other factors, temporary teachers are known to experience worse working conditions (Melanda et al., 2020; Moon & McCluskey, 2016; Wei et al., 2013) and, together with black, mixed, or indigenous teachers (Mascarenhas et al., 2009; Soares Filho, 2011), may be more vulnerable to violence. This loss may have led to an underestimation of the frequency of these events at follow-up. Thus, we believe our results are conservative because the inclusion of this population in the analyses could strengthen the hypotheses investigated. Another limitation is the possible memory bias relative to events that occurred during the 12 months prior to the survey, in both stages, since only the most striking facts could be recalled. In addition, data on violence were collected via face-to-face interviews, which is a method with some limitations over self-administered questionnaires (e.g., social desirability, interviewer bias), notwithstanding some advantages, such as the possibility of clarification of questions by the interviewer if necessary and a higher response rate (A. Bowling, 2005).
In conclusion, this study showed that violence against teachers is recurrent, suffering a certain form of violence increases the risk of suffering it again within 2 years, and suffering a larger number of forms of violence is related to suffering violence in the future in a dose–response relationship, even after adjusting the analyses for teachers’ sociodemographic variables, working conditions, and mental status (anxiety and depression). Therefore, the identification of teachers who are most vulnerable to violence and of the recurrence of violence at school is key for the establishment of more adequate strategies to minimize this phenomenon.
Preventing violence in schools is complex and should involve the entire community with an emphasis on the cultural system for systemic changes (Chan, Hollingsworth, Espelage, & Mitchell, 2016), in addition to specific school safety policies and plans, such as planning, adopting, and evaluating strategies to improve schools’ climate, implementing the collection of data on aggressive incidents and monitoring their occurrence, training the staff on mediating conflicts, and providing proper assistance for those victimized to reduce the harm caused by violence (Glina & Soboll, 2012). Future studies should investigate violence in its multifaceted forms with larger samples that allow subgroup analysis, the possible contextual causes of recurrence of violence against teachers, the effectiveness of intervention strategies to reduce this phenomenon and to explore the cumulative impact of repeated episodes of violence on the teaching-learning process and on occupational and health outcomes.
Footnotes
Declaration of Conflicting Interests
The author(s) declared no potential conflicts of interest with respect to the research, authorship, and/or publication of this article.
Funding
The author(s) disclosed receipt of the following financial support for the research, authorship, and/or publication of this article: This study was financed in part by the Coordenação de Aperfeiçoamento de Pessoal de Nível Superior—Coordination for the Improvement of Higher Education Personnel—Brasil (CAPES)—Finance Code 001; and by the Conselho Nacional de Desenvolvimento Científico e Tecnológico—National Council for Scientific and Technological Development—Brasil (CNPq)—research productivity scholarship—process number 310259/2015-0.
