
Abstract
Social Security, more accurately the Old-Age, Survivors, and Disability Insurance (OASDI) program, is woefully underfunded as measured by the long-term actuarial balance. Its reserves, on deposit with the U.S. Treasury Department, will be depleted in 2033, notwithstanding the fact that there is no money there. The surpluses that created them following the 1983 Amendments ended in 2010. The so-called reserves have long since been spent on other government programs and obligations. Yet the fiction endures. This article examines the origins of the full-funding standard and then analyses the real funding problems of OASDI and how they are measured. If the OASDI is seen as the pay-as-you-go system that it is, its problems would be more easily managed.
The Social Security Act was passed in 1935 and paid its first monthly benefits in 1940. In 1939, the Federal Insurance Contribution Act (FICA) established the payroll tax and trust fund arrangement. Social Security was the greatest achievement of the New Deal, and for millions of Americans it is the most important federal government program. Almost every employed or self-employed person pays into the system. As indicated in Table 1, almost 60 million individuals receive benefits. They include 41 million retired workers and their dependents and 11 million disabled workers and their dependents. Total benefits paid are $68.6 billion a month. It would be hard to overstate the importance of OASDI to the American people or the economy.
Number of Beneficiaries, Total Benefits Paid and Average Monthly Benefit as of December 31, 2013.

Source. Fact sheet on the Old-Age, Survivors, and Disability Insurance Program. Retrieved from www.socialsecurity.gov
Not meaningful.
The Social Security Act, as amended, contains numerous public benefit programs including Medicare, Medicaid and Supplemental Security Income. To most of us, however, “Social Security” means the OASDI program. According to the 2014 Social Security Trustees Annual Report, the system is underfunded by $10.6 trillion in present value over the next 75 years. That is $1 trillion more than a year ago due to changes in methodology, assumptions and valuation date. 1
Most reform proposals are directed at bringing the system into “close long-run actuarial balance” (discussed below) by increasing revenue and/or curtailing expenditures (benefits). If we act now, that would require increasing the FICA payroll tax by 2.83 percentage points (from 12.4% to 15.23%), reducing benefits by 17.4% if applied to all current and future beneficiaries or by 20.8% if applied only to those who become eligible in 2014 or later, or some combination thereof. If we had acted 10 years ago, relatively minor adjustments would have done the job. The longer we wait, the more difficult it will be.
Full Funding
The above is based on the assumption that OASDI should be fully prefunded. According to the International Monetary Fund, almost all countries finance their public pension systems on a pay-as-you-go basis. 2 They operate under a “social contract” that assumes that each generation will provide for the preceding generation in its retirement years. Only Canada and the United States have partially prefunded social insurance systems. The Canadian program is an entitlement program based on years of residence in the country. The United States has an elaborate OASDI program based on payroll taxes and benefits as an earned right, albeit with a benefit formula skewed in favor of lifetime low earners. It is also complimented by Supplemental Security Income benefits for most low earners and other needs-based programs.
In 1972, the Congress stated that OASDI should be financed on a pay-as-you-go basis. 3 That position was soon subsumed by developments in the private sector. The Employee Retirement Income Security Act of 1974 (ERISA) established minimum standards for private sector pension plans, including funding requirements. ERISA also created the Pension Benefit Guaranty Corporation (PBGC) to insure the benefits of defined-benefit (DB) pension plans.
The PBGC is funded by premiums paid by DB plan sponsors. Although there is no statutory requirement that the U.S. government must come to the aid of the PBGC should it become insolvent, the political and moral pressure to do so would be enormous. After all, Congress passed ERISA to protect vested pension benefits and the PBGC is the ultimate protector.
To protect the PBGC from having to acquire the large underfunded vested liabilities of failed employers, it was necessary to require that the plans become fully funded. Initially, the requirement was that existing plans had 40 years and new plans and improvements to existing plans had 30 years. That is, unfunded liabilities could be amortized over 40 and 30 years, respectively. Underfunding due to investment losses and revised actuarial assumptions had shorter periods. Since the Pension Protection Act of 2006, the requirement is 7 years.
The full-funding requirement is necessary to protect the PBGC and, by extension, the U.S. government. Private sector employers go out of business all the time. In a market-based economy, it is important that they do. It frees up human and financial resources that can be more productively employed elsewhere. Governments do not go out of business. They are perpetual. They also have the power to tax and, in the case of a national government, the ability to print money and thus inflate their way out of sovereign debt. PBGC-type of pension benefit insurance in the public sector is not needed. Moreover, OASDI is so huge that such insurance would be infeasible. Who would write it?
Social Security Funding
OASDI is funded by a 6.2% payroll tax paid by employees and employers each (12.4% combined) on earned income up to a maximum wage base (indexed). The self-employed pay the entire 12.4% but are allowed to deduct the employer portion from their income tax. In 2014, the maximum wage base is $117,000. OASDI’s other sources of income are the interest paid on surplus funds loaned to the Treasury Department and the remittance of income taxes paid on 50% of OASDI benefits. The other 35% (of the 85% tax) goes to the Medicare trust fund.
In 1994, when the Disability Insurance (DI) trust fund was on the brink of insolvency, Congress diverted funds from the Old-Age and Survivors Insurance to the DI fund. It is assumed that Congress will do that again when the DI trust fund nears insolvency in 2016. It has become conventional to refer to the “OASDI trust funds.”
The law requires that the Social Security Administration (SSA) loan its surplus funds to the Treasury Department. Treasury gives the SSA special nonmarketable securities in return (IOUs). The Treasury then uses those funds to pay for other federal programs and obligations. The IOUs are assets of the SSA and liabilities of the Treasury. For the U.S. government as a whole, they cancel out.
The 1983 Amendments
In 1977, Congress took steps to improve OASDI financing by increasing the payroll tax rate and the wage base. These measures did not go far enough. In 1983 the Greenspan Commission proposed a number of changes that were quickly enacted into law as the “1983 Amendments.” They included accelerating the 1977 changes and further increasing the FICA tax rate and increasing the taxable wage base. The 1983 Amendments also increased the full retirement age (FRA), from 65 to 66 in 2-month steps for those born between 1938 and 1943. The FRA remained at age 66 for those born from 1943 through 1954. After that, it increased in 2-month steps for those born in 1955 until it reaches age 67 for those born in 1960 or later. The FRA is the age at which the recipient is entitled to unreduced retirement benefits. Another change increases the rate at which benefits grew for working beyond the FRA from 3% to 8% per year.
The 1983 Amendments did what they were supposed to do. The system began to run an annual surplus almost immediately and continued to do so through 2010. In 2007, the surplus peaked at $190.4 billion and then started to decline.
This development is captured in Table 2. It reports OASDI assets at the beginning of the year (end of previous year), income (revenue), outgo (expenditures), net increase or decrease in the OASDI trust funds reserves and the “trust fund ratio” (TFR). The TFR is a measure of how long a trust fund can continue to pay scheduled benefits from available assets. Specifically, it divides the assets available at the beginning of the year by the expected expenditures for that year. The TFR of 384 for 2013 means that there were sufficient assets to pay benefits for 3.84 years.
Financial Status of OASDI Trust Funds, Selected Years 1950-2030 (Billions).

Note. OASDI = Old-Age, Survivors, and Disability Insurance.
Source. The 2014 Annual Report of the Board of Trustees of the Federal Old-Age and Survivors Insurance and Federal Disability Insurance Trust Funds, 1950–2030: Table VI.A1, pp. 149-50; 2015-2030: Table IV.B3, p. 62, based on intermediate assumptions. After about 2025, the OASDI trust funds will be exhausted and the TFR will be zero. Retrieved from www.ssa.gov/oact/tr/2014/tr2014.pdf
The TFR is sometimes referred to as the “fund ratio” in the Trustees Reports and elsewhere. It should not be confused with the “funded ratio,” which is a measure of percentage funded (assets ÷ liabilities) of DB pension plans.
It must be remembered that there is no real money in the OASDI trust funds. It has been spent. The Social Security funding problem is in reality a federal government fiscal problem. Moreover, it is not a problem that will happen in 2033 when the OASDI trust funds are depleted. It is here and now. Beginning in 2010, the OASDI annual surplus ended. The amount of noninterest revenue is now less that program costs. The surplus is no longer available to mask a significant portion of the annual federal deficit.
This matter is complicated by a temporary reduction in the FICA tax rate for 2011 and 2012 to help deal with the Great Recession. The reduced contributions were offset by transfers from the general fund of $103 billion for 2011, $114 billion for 2012 and $5 billion for 2013. For 2014, the OASDI deficit is $80 billion.
Once the OASDI trust funds outgo exceeds income in the mid-2020s, the SSA will start to cash in its IOUs, and it will get worse. Congress will have to raise taxes, cut spending or borrow more from the public. The first two options are politically difficult. The third, to borrow more from the public, is fraught with problems. Consider in Table 3. It reports data on the U.S. national debt for the period 2000 to 2012 and projected debt through 2018. The debt held by the public is the important one. Intragovernmental Debt is money that the federal government owes to itself. A significant portion of Intragovernmental Debt is the accumulated OASDI surpluses.
Growth of National Debt, 2000-2018 (Trillions).
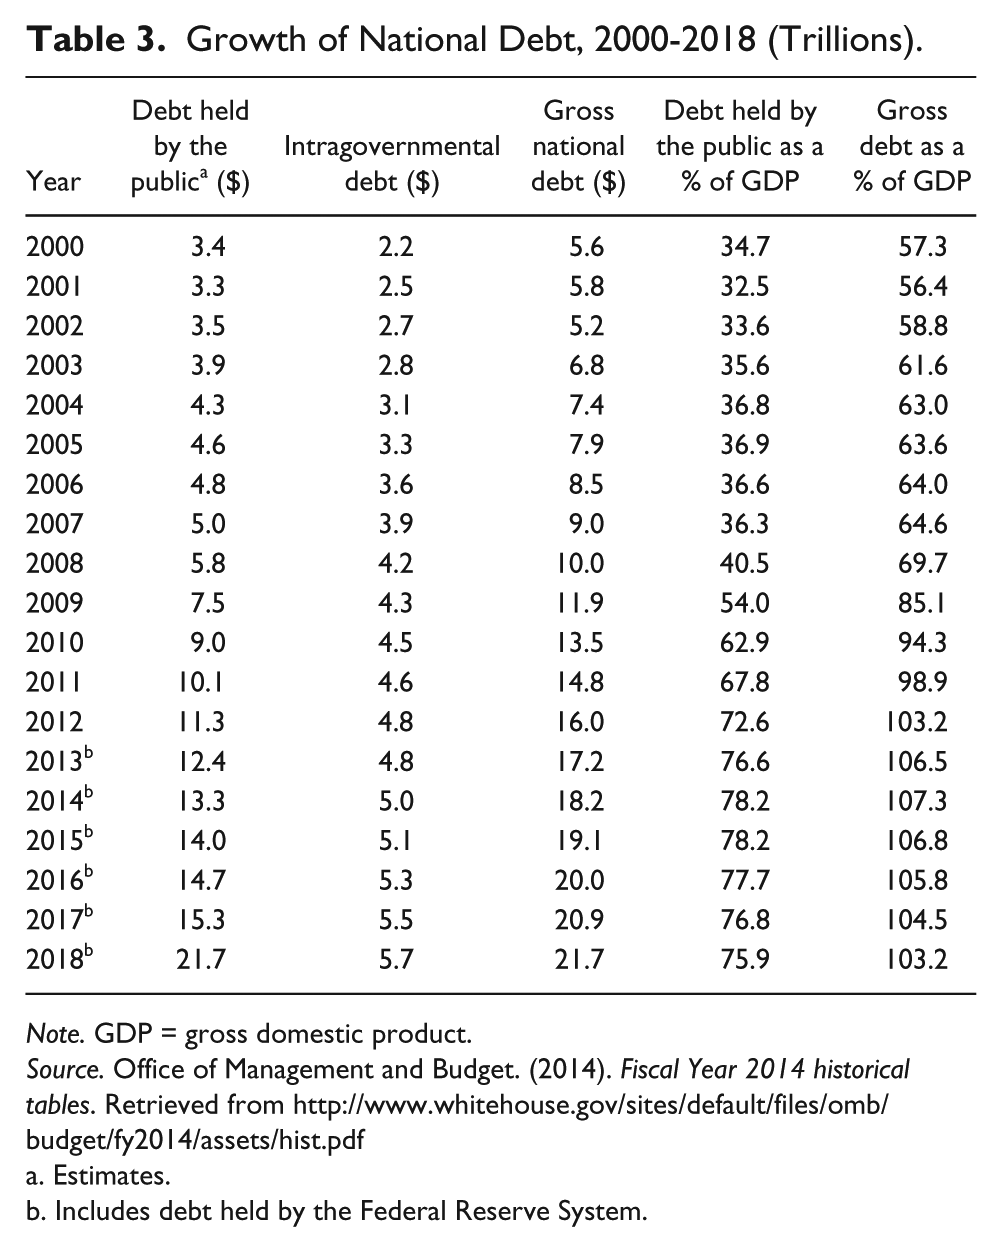
Note. GDP = gross domestic product.
Source. Office of Management and Budget. (2014). Fiscal Year 2014 historical tables. Retrieved from http://www.whitehouse.gov/sites/default/files/omb/budget/fy2014/assets/hist.pdf
Estimates.
Includes debt held by the Federal Reserve System.
Debt held by the public as a percentage of Gross Domestic Product has increased from 36.3% as recently as 2007 to 72.2% in 2012 and is projected to go to 75.9% by 2018.
OASDI Experience
The 1983 Amendments established the OASDI program as we now know it. Fictions aside, it is essentially a pay-as-you-go system. It is also pretty much of a “closed system.” With the exception of the 30% of state and local government employees who are not covered, no significant class of new members is available to join OASDI. Nor can additional state and local governments withdraw, as was allowed, and many did, prior to 1984. That is not to say that the program is static. It is affected by changes in life expectancy, labor force participation rate (LFPR), fertility rates, disability rates and the resulting ratio of workers to beneficiaries.
Life Expectancy
As reported in Table 4, life expectancy at birth has increased from 66.5 for men and 71.1 for women in 1950 to 76.5 and 81.3, respectively, in 2013. That is a 16.6% increase for men and a 20.0% increase for women.
Life Expectancy at Birth and at Age 65 by Gender, 1950-2090.
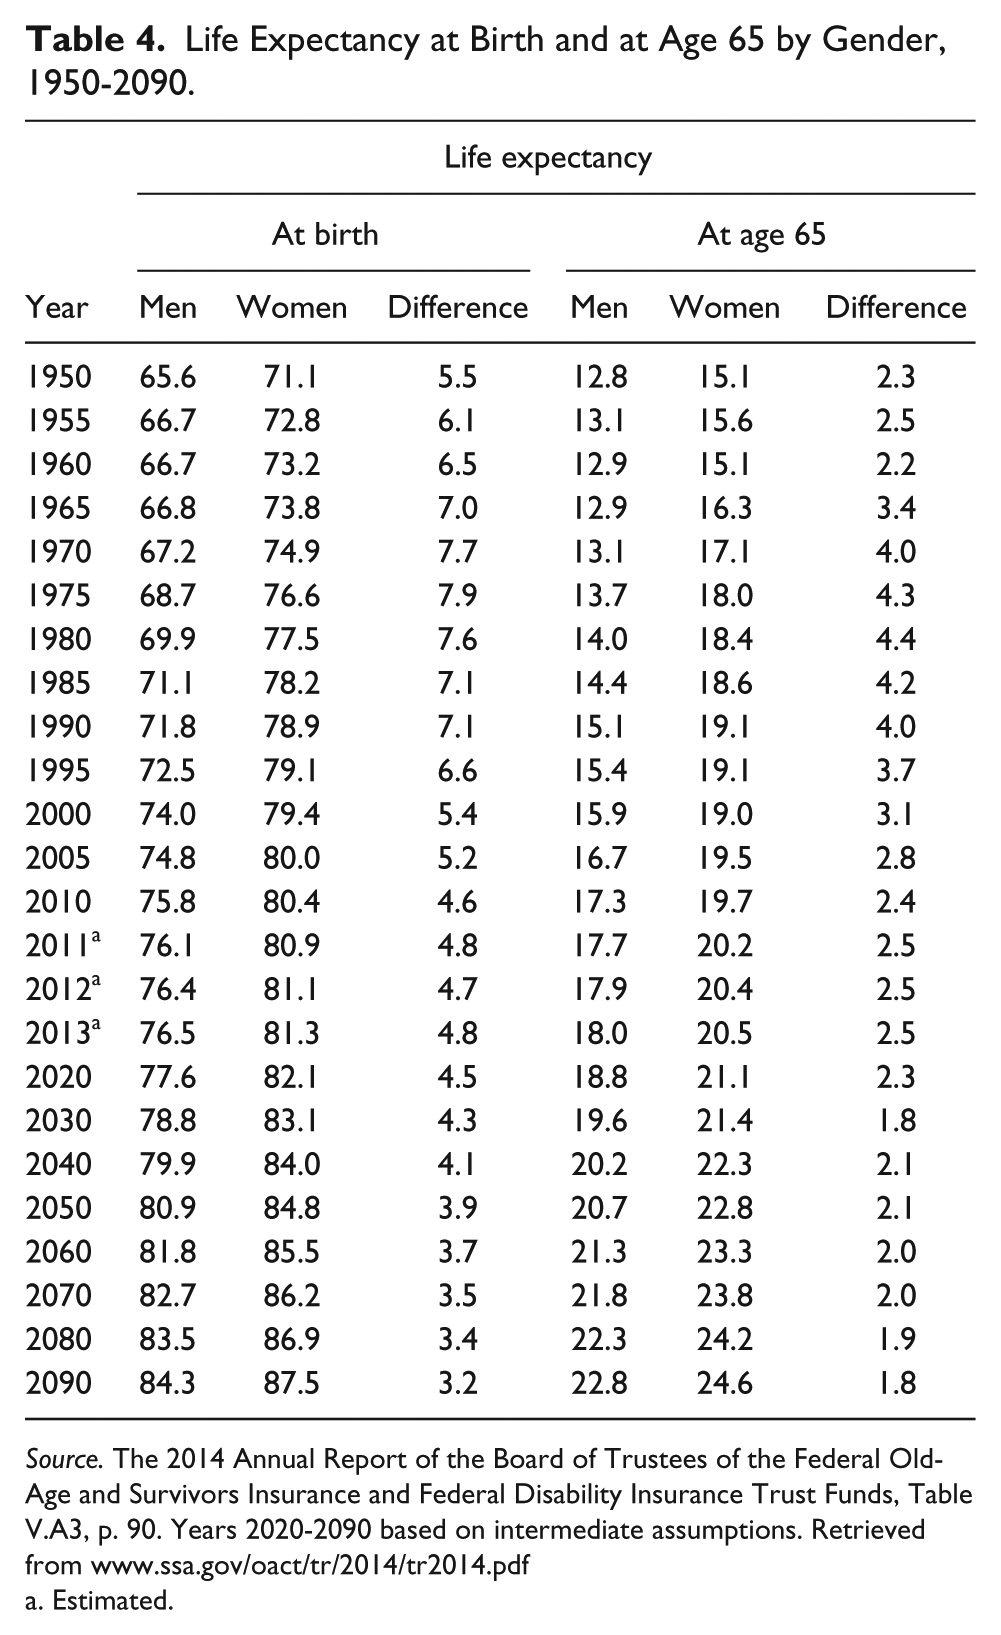
Source. The 2014 Annual Report of the Board of Trustees of the Federal Old-Age and Survivors Insurance and Federal Disability Insurance Trust Funds, Table V.A3, p. 90. Years 2020-2090 based on intermediate assumptions. Retrieved from www.ssa.gov/oact/tr/2014/tr2014.pdf
Estimated.
A more relevant metric for Social Security is life expectancy at age 65. It went from 12.8 years for men and 15.1 years for women to 18.0 for men and 20.5 for women during the same period. That is an astounding 40.8% improvement for men and 35.8% improvement for women.
Observe in Table 4 that both at birth and at age 65 life expectancies are expected to increase substantially in the years ahead. Since we all want to live longer, that’s good. However, for the OASDI trust funds, it means additional years of beneficiaries collecting retirement and disability benefits. That’s not so good.
It is interesting to consider the difference in life expectancies between men and women and how they have changed over the years. Women live longer. In 1980, the difference at age 65 was 4.4 years. By 2013, it was 2.5 years, and it is expected to continue to decline in the years ahead. Life expectancy for both men and women will continue to improve, but men will benefit more.
Labor Force Participation Rates and Composition
The total civilian LFPR refers to the percentage of the noninstitutionalized and nonmilitary population that is working or actively seeking work. The male (female) LFPR is the percentage of men (women) working or seeking work relative to the number of male (female) workers in the labor force.
As indicated in Table 5, total LFPR increased from 59.2% in 1950 to 67.1% in 2000. It had fallen to 63.7% by 2012. The total LFRP is an important factor in the economic performance of a country. Other things being equal, the higher the better. The most interesting thing in Table 5 is what has happened to the LFPR of men and women.
Civilian Labor Force Participations Rates and Labor Force Composition, Selected Years 1950-2012.
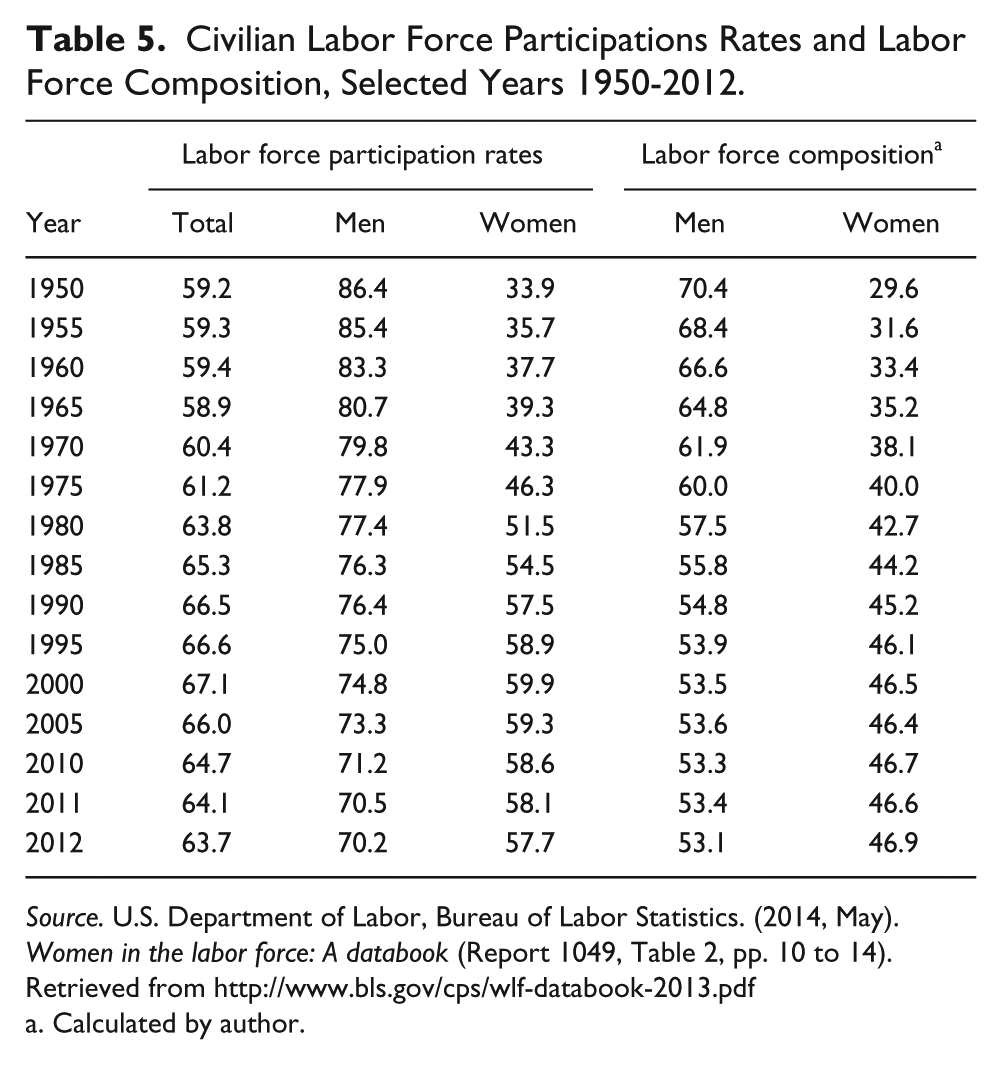
Source. U.S. Department of Labor, Bureau of Labor Statistics. (2014, May). Women in the labor force: A databook (Report 1049, Table 2, pp. 10 to 14). Retrieved from http://www.bls.gov/cps/wlf-databook-2013.pdf
Calculated by author.
By 1950 the United States had returned to what may be thought of as normal. World War II and the transition to a peacetime economy had occurred, and the baby boom was well underway. The norm was for men to go to work and for women to stay at home and raise the kids. In 1950, the LFPR of men was 86.4 % and that of women 33.9 %. The composition of the labor force was 70.4% male and 29.6% female. Then things started to change.
The LFPR of women peaked at 60.0% in 1999. (It had fallen to 57.7% by 2012.) That explains the impressive growth in total LFPR until 2000 and its subsequent decline. Meanwhile, the LFPR of men decreased from 86.4% in 1950 to 70.2% in 2012. As a result, the composition of the labor force went from 70.4% male and 29.6% female to 53.1% male and 46.9% female. That’s revolutionary.
When the higher life expectancy of women is combined with their increased LFPR and the decline of men’s LFPR, it explains a lot of the OASDI funding problem. But not all.
Fertility Rates
The “baby boom” refers to those born from 1946 to 1964. As shown in Table 6, in 1950 women, on average, gave birth to three children. In 1960, it was 3.6. By 1965, the rate had dropped to 2.9 children, and by 2012 it was 1.9. The U.S. fertility rate is expected to remain at about 2.0 for the foreseeable future. At that rate, we are barely replacing ourselves. This is a worldwide phenomenon. Compared to other advanced market economies, we are in good shape.
Total Fertility Rates of the United States: Number of Live Births per Woman, Selected Years 1950-2012.

Source. Social Security Administration, Office of the Chief Actuary. (2013). The long-range demographic assumptions for the 2013 Trustees Report. Retrieved from http://www.socialsecurity.gov/oact/tr/2013/V_A_demo.html#255003
Estimated.
Forecast based on intermediate assumptions.
The baby boom and the “baby bust” that followed it are raising havoc with OASDI. The leading edge of the “boomers” reached age 62 and became eligible for early retirement benefits in 2008 and for full retirement benefits in 2011. They will be joined by about 10,000 retiring boomers per day until about 2030.
The reduced fertility rates appear to be permanent. They are a function of the increased LFPR of women, evolving social attitudes and values, the increased educational attainment of women and “the pill,” which conveniently became available in 1961. None of these developments is likely to be reversed.
Disability Rates
Table 7 reports data for Social Security Disability Insurance for the period 1960 through 2013 and projections through 2090. It is not surprising that the number of disabled workers and total Social Security Disability Insurance beneficiaries has grown. There are more workers. However, the prevalence rates of disability have also increased appreciably. This is due in part to the SSA loosening its standards in this area. However, it is also due to the aging of the baby boom generation. Older workers are more disability-prone (though not more accident-prone) than younger workers. The result is that the DI trust fund has had to pay out more than anticipated and will be depleted in 2016, unless Congress intervenes before then. It is assumed that it will.
SSDI Beneficiaries and Disability Prevalence Rates, Selected Years 1960–2090.
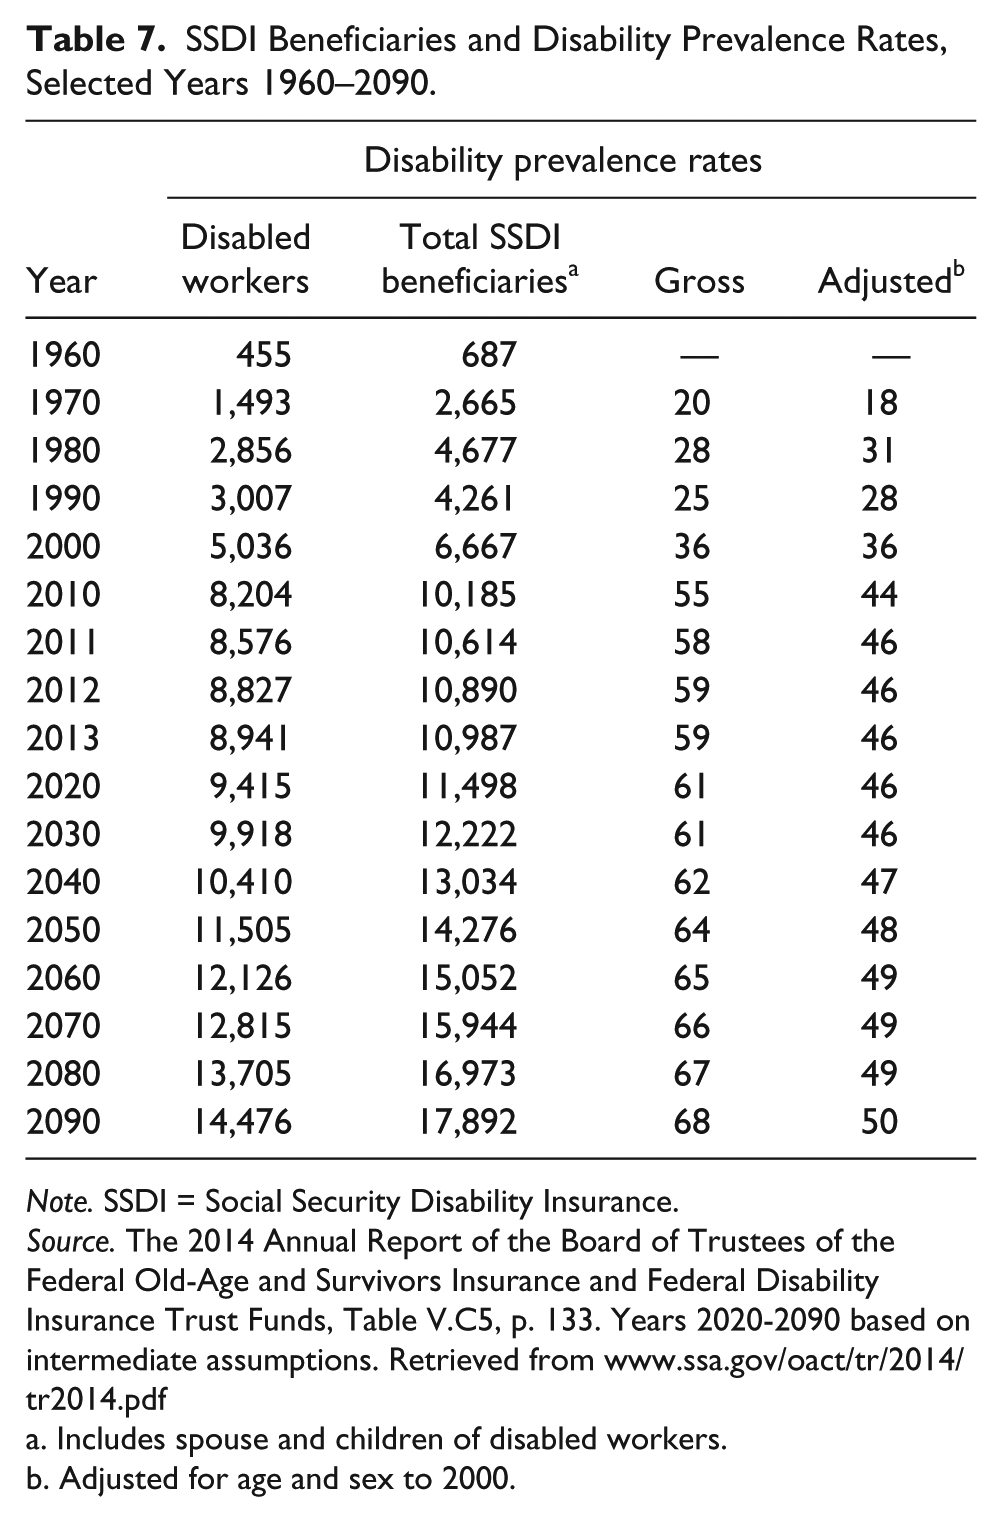
Note. SSDI = Social Security Disability Insurance.
Source. The 2014 Annual Report of the Board of Trustees of the Federal Old-Age and Survivors Insurance and Federal Disability Insurance Trust Funds, Table V.C5, p. 133. Years 2020-2090 based on intermediate assumptions. Retrieved from www.ssa.gov/oact/tr/2014/tr2014.pdf
Includes spouse and children of disabled workers.
Adjusted for age and sex to 2000.
Covered Workers per OASDI Beneficiary
As a result of the above developments, the number of OASDI-covered (contributing) workers per (collecting) beneficiary has declined substantially. In 1950, when the system was young, there were 16.1 workers per beneficiary. By 1980 it was 3.2, and by 2013, 2.8. In the years ahead, as the baby boom generation continues to reach retirement, the ratio will decline to about 2.0 where it will remain through 2090 (Table 8).
Covered Workers and Beneficiaries, Selected Years 1950-2090 (Millions).
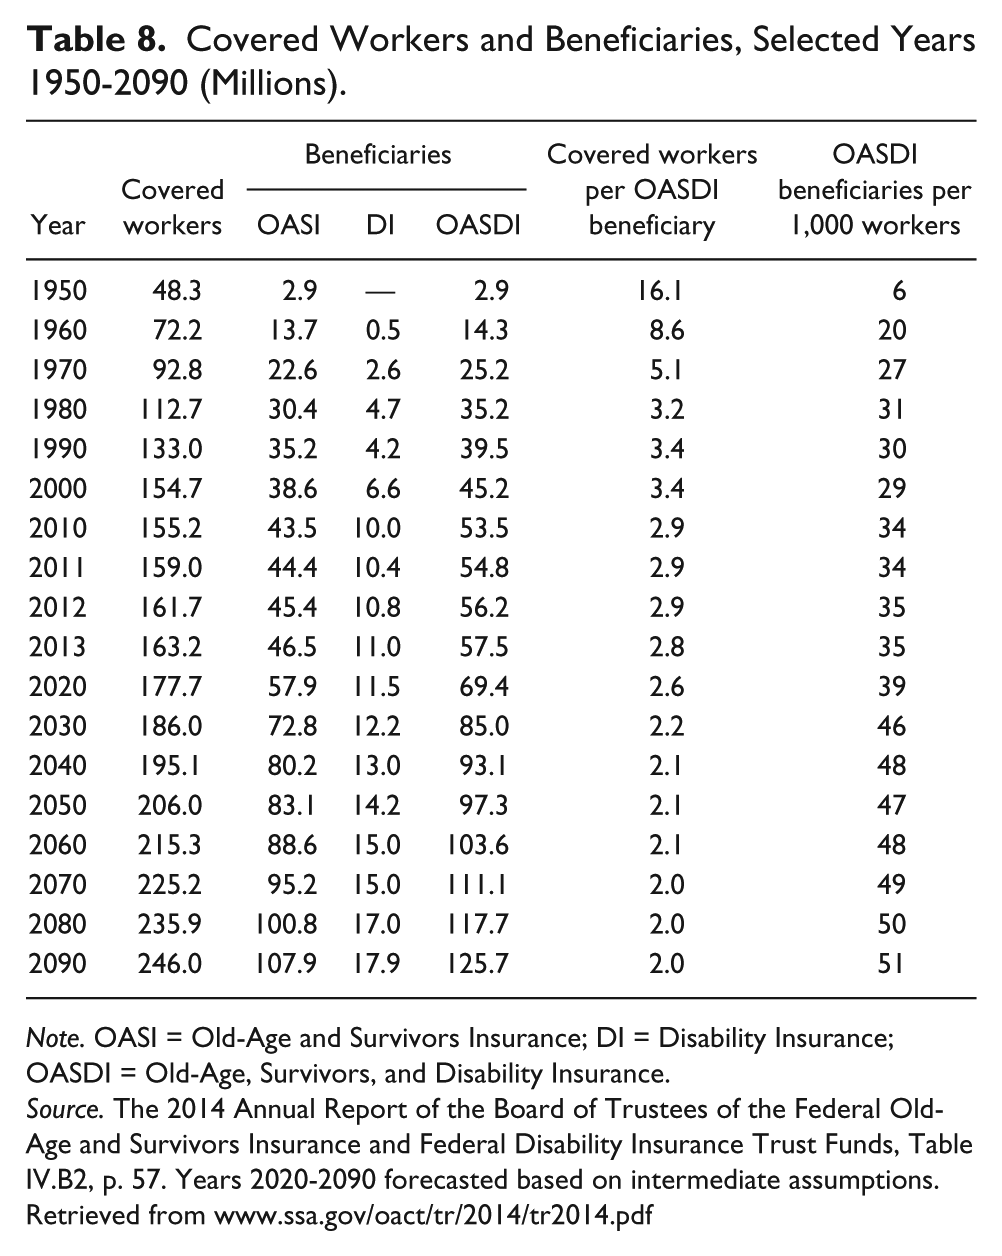
Note. OASI = Old-Age and Survivors Insurance; DI = Disability Insurance; OASDI = Old-Age, Survivors, and Disability Insurance.
Source. The 2014 Annual Report of the Board of Trustees of the Federal Old-Age and Survivors Insurance and Federal Disability Insurance Trust Funds, Table IV.B2, p. 57. Years 2020-2090 forecasted based on intermediate assumptions. Retrieved from www.ssa.gov/oact/tr/2014/tr2014.pdf
The ratio of workers to beneficiaries underlies the OASDI funding problem. The problem will not disappear even when the boomers die off in the 2030s and 2040s. In the absence of catastrophes, life expectancy will continue to improve and fertility rates will remain low.
Financial Status of the OASDI Trust Funds
As was reported in Table 2, the OASDI trust funds appear to be in pretty good shape, for now. That is about to change. In 2013, the TFR was 384. There were enough assets to continue to pay scheduled benefits for 3.84 years. It will decline significantly over the next decade to 84 in 2025. After that it will be zero and the SSA will start drawing down OASDI reserves held by the Treasury until they are depleted in 2033. Of course, this is all a bit fictional. There are no real assets in the trust funds. And the annual OASDI surpluses ended in 2010.
The Office of the Chief Actuary of the SSA began publishing the “long run actuarial balance” of OASDI in the 1983 Trustees Report and has done so each year since. This is complicated. The “summarized cost rate” minus the “summarized income rate” equals the “actuarial balance. The “summarized cost rate” is the ratio of the present value of scheduled noninterest income to the present value of the FICA taxable payroll expressed as a percentage. The “summarized income rate” is the ratio of the present value of program costs to the present value of the FICA taxable payroll expressed as a percentage. An actuarial balance of zero means that cost equals income and that the program is solvent, with enough reserves remaining at the end of the year to pay scheduled benefits for the following year. A negative actuarial balance means that costs (expenditures) exceed income (revenues). 4
As indicated in Table 9, the 1983 Amendments restored OASDI trust funds to solvency almost immediately, and it remained at or near solvency through 1990. It then started to decline and reached −2.88 in 1914. Table 9 also reports the year of OASDI trust funds depletion year for each Trustees Report. The years left before the combined trust funds are exhausted keep getting fewer.
Long-Range Actuarial Balance and Year of OASDI Trust Funds Depletion, Selected Years 1982-2014.
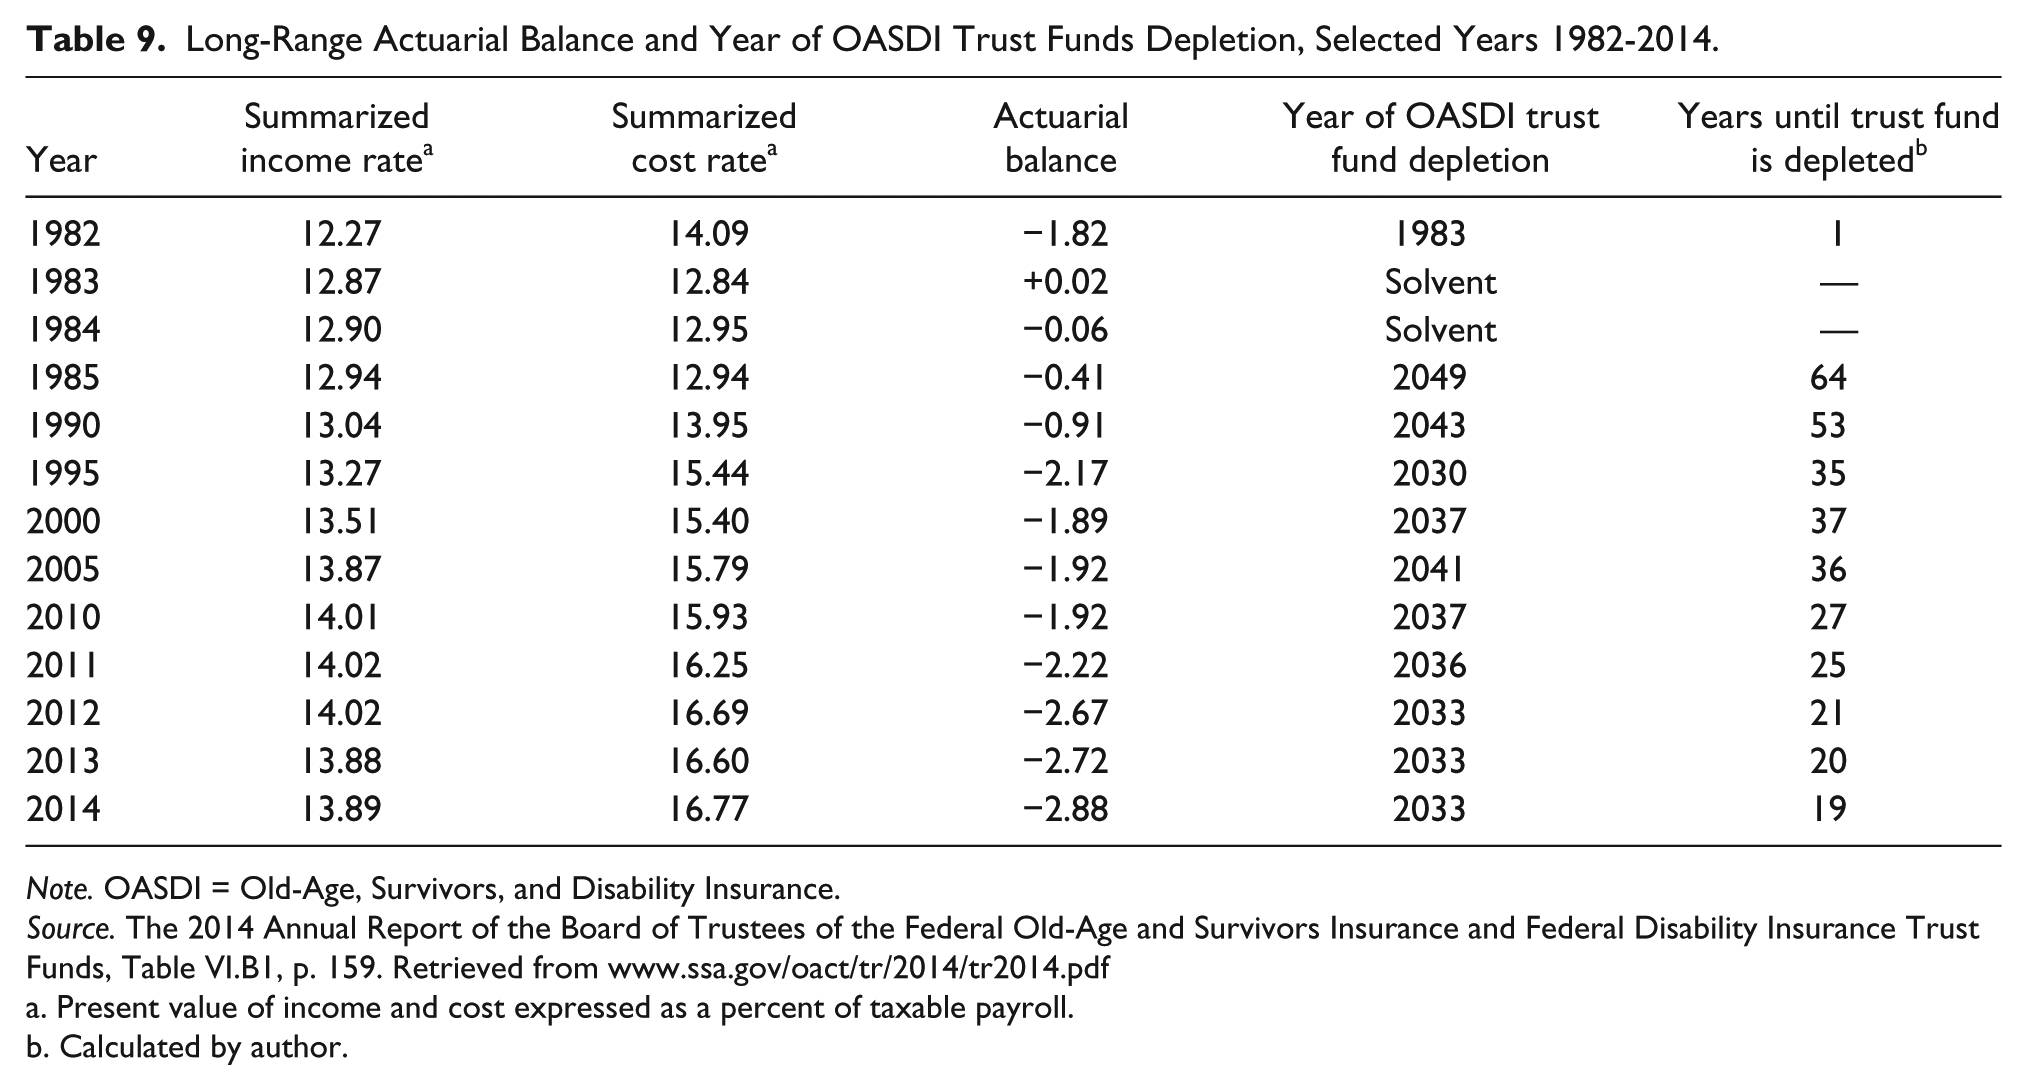
Note. OASDI = Old-Age, Survivors, and Disability Insurance.
Source. The 2014 Annual Report of the Board of Trustees of the Federal Old-Age and Survivors Insurance and Federal Disability Insurance Trust Funds, Table VI.B1, p. 159. Retrieved from www.ssa.gov/oact/tr/2014/tr2014.pdf
Present value of income and cost expressed as a percent of taxable payroll.
Calculated by author.
Of course this is Kabuki Theatre. The application of the full-funding standard to Social Security only confuses things. The idea of creating an actuarially balanced OASDI system over the long term is misleading and confusing. As long as the SSA is required to loan its surplus funds to the U.S. Treasury, OASDI will be essentially a pay-as-you-go system. That may be inevitable. There may be no workable alternative.
Had the SSA been allowed to invest its surplus funds in the U.S. equity and other financial markets after 1983, it would have created problems. How long would it have been before Congress or the Administration decided to improve (meddle with) corporate decision making to further some worthy cause? Allowing the SSA to invest in foreign securities presents other problems. Besides, the point is now moot. The surpluses have ended, and you can’t invest IOUs.
The exhaustion of the OASDI trust funds will not be the end of the world. The SSA will still be able to pay about 77% of scheduled benefits from employee, employer and self-employed contributions and remittances from the Treasury for income taxes paid on OASDI benefits. There will be no income from earnings on invested assets after 2033 because there will be no assets to invest.
Conclusion
Congress has to tackle the OASDI underfunding problem some time soon. Although it need not make the system actuarially sustainable for the next 75 years, it needs to increase revenue and/or reduce expenditures enough to pay scheduled benefits after 2033. There are many ways that this can be accomplished, including adjusting the FICA tax rate, increasing the taxable wage base, adjusting the benefit formula (bend points), further increasing the FRA and revising the cost of living adjustment. If the reforms are spread among these options, and adopted soon, they should be relatively easy. The longer we wait, the more difficult it will be.
Footnotes
Declaration of Conflicting Interests
The author declared no potential conflicts of interest with respect to the research, authorship, and/or publication of this article.
Funding
The author received no financial support for the research, authorship, and/or publication of this article.