
Abstract
The Affordable Care Act of 2010 (ACA) was grafted onto a complex structure employment-based health benefit plans supplemented by a number of federal and state health care programs including Medicare, Medicaid and the Child Health Insurance Program (CHIP). This article examines the development of health care benefits in the United States before 2010. A following article will appraise the ACA.
The Patient Protection and Affordable Care Act of 2010—widely referred to as the Affordable Care Act (ACA) or “Obamacare”—is the most important health care reform in the United States since the adoption of Medicare and Medicaid in 1965. Some of its more salient provisions went into effect immediately. Others took effect in 2014, and the so-called “Cadillac tax” will become effective in 2018.
Most advanced countries created comprehensive health plans after World War II on a relatively clean slate. The U.S. experience was different. The ACA was grafted onto a mature tree with many large branches and deep roots. This article examines the health benefit programs in the United States before the Affordable Care Act. A following article will examine the ACA.
Employer-Sponsored Health Benefits
During World War II, many employers facing a tight labor market under federal wage controls established pension and health benefit plans to help attract and retain workers. The National Labor Relations Act was passed in 1935. One of its provisions required private sector employers to bargain in “good faith” on “wages, hours and other terms and conditions of employment.” In 1947, the National Labor Relations Board (NLRB) was confronted with a question: Were pensions a “mandatory subject of bargaining.” It held that they were, and in 1949, the U.S. Supreme Court agreed (Inland Steel v. NLRB). The decision was written in a way that it applied to health and other benefits as well.
During the 1950s the private sector was much more unionized than it is today, and the unions were more assertive. They demanded pension and health benefit plans and the employers agreed. Nonunion employers followed suit in order to remain nonunion.
Public sector employers (governments) adopted health benefit plans at about the same time to remain competitive in the job market. State and local governments were not effectively unionized until states passed collective bargaining laws beginning in the 1960s and 1970s. While organized labor has declined in the private sector, it has remained strong in the public sector (Table 1).
Percentage of Private and Public Sector Union Membership and Employees Represented, Selected Years, 1985 to 2014.
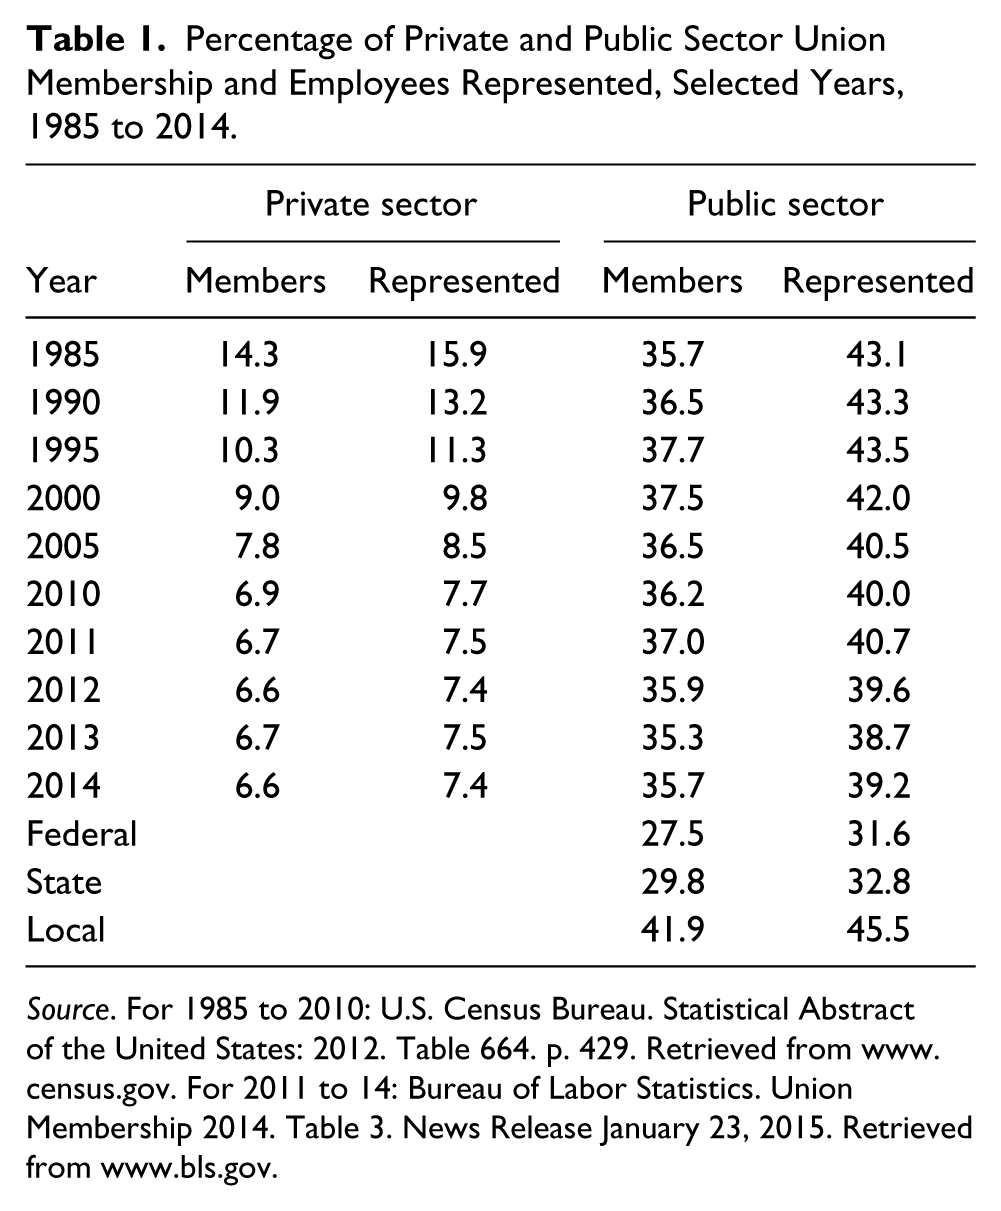
Source. For 1985 to 2010: U.S. Census Bureau. Statistical Abstract of the United States: 2012. Table 664. p. 429. Retrieved from www.census.gov. For 2011 to 14: Bureau of Labor Statistics. Union Membership 2014. Table 3. News Release January 23, 2015. Retrieved from www.bls.gov.
The U.S. system of employee and retiree health benefits worked well for those employed by or retired from a large business organization or government. For others, it worked less well. The result was large numbers of people without effective access to quality health care services.
Earlier Reform Efforts
The need for universal access to health care has long been recognized. The Roosevelt Administration explored the possibility as a logical extension of the New Deal. After the war, the Truman Administration continued the effort but was met with staunch opposition from the American Medical Association that characterized the proposal as “socialized medicine”—a weighty charge in the early days of the Cold War.
The Clinton Administration attempted health care reform in the 1990s. President Clinton appointed wife Hillary and friend Ira Magaziner to head the National Commission on Health Care Reform. The Commission had 500 members, 34 committees and operated in secret. By the time it reported its very complicated recommendations, the Republicans had gained control of Congress and the proposal was dead on arrival.
Though universal access to health insurance was not adopted, a number of more specific programs were. Such programs complemented and augmented the main employer-sponsored health benefit system. They include Medicare, Medicaid, COBRA, and the Children’s Health Insurance Program (CHIP).
Medicare
Medicare was enacted in 1965. It provides health benefits for Americans age 65 and older, the disabled after receiving Social Security Disability Insurance (SSDI) benefits for 2 years and those with end-stage renal disease. 1
In 2015, Part A of Medicare pays for up to 60 days of hospital care after the patient pays a deductible of $1,260 per benefit period. For days 61 to 90, the patient pays $315 per day. For days 91 and beyond, the patient pays $630 per day for a 60-day lifetime benefit. Part A is funded by a 1.45% payroll tax paid by the employee and employer (each) that is part of the 6.2% FICA contribution.
Part B of Medicare covers doctor’s visits, lab tests, prostheses and other services. It is funded for most people by a $104.90 monthly payment that covers 25% of its cost. The remainder is paid from the general fund. There is a $147 annual deductible for an individual earning between $85,000 and $107,000 ($170,000 and $214,000 for a couple). The premium goes up as income increases to a maximum of $335.70 for an individual earning $214,000 or more.
Part C (Medicare Advantage) was added in 1982 and became effective in 1985. It provides a capitation payment to managed care organizations: Health Maintenance Organizations (HMOs) and Preferred Provider Organizations (PPOs). Deductibles and copayments vary by plan. Most HMOs and PPOs cover prescription drugs.
Part D, prescription drug coverage, was added 2003 and became effective in 2006. Premiums vary by the plan chosen, and higher income consumers pay more based on the same income categories that apply to Part B. For example, an individual with a 2013 income between $85,000 and $107,000 will pay $12.30 plus the premium in 2015.
Part D pays for prescription drugs up to $2,850 per year. After that, there is the famous “donut hole” in which there is no payment until the “catastrophic coverage” provision kicks in at $4,550. Then Part D pays 95% of the cost. The ACA will reduce and then eliminate the donut hole by 2020.
Medicare also covers hospice services and mental illness. It does not provide long-term care. Many employers provide or individuals purchase so-called Medigap insurance policies that pay for medical expenses (deductibles and the donut whole) not covered by Medicare.
As of 2012, Medicare covered 50.8 million Americans, 42.2 million of whom were age 65 or older, 8.6 million were blind or disabled, and 500,000 had end-stage renal disease requiring dialysis or a kidney transplant. The program cost the federal government $552 billion in 2012.
Medicaid
Medicaid was also created in 1965. It is a federal-state funded and largely state administered program that provides comprehensive medical benefits (including dental and vision) to the poor. Prior to the ACA, eligibility was limited to a number of specified categories: blind and disabled, children, pregnant women, single women with children and the very poor elderly. It would have been unusual, and in 21 states impossible, for a working-age man or a woman without dependent children to be eligible.
As of 2012, 50.7 million Americans were covered by Medicaid. They included 22 million children (including the 5.9 million covered by the CHIP discussed below) and 12.9 million adults, mainly pregnant women and mothers of eligible children. There were also 9.8 million blind and disabled and 5.0 million very poor elderly persons. In 2012, the program cost the federal government $238 billion and the states $176 billion.
Medicaid looks great on paper. It is more comprehensive than Medicare and the patient pays only nominal fees. The problem is that many physicians and other health care providers are reluctant to serve Medicaid patients, or accept only a limited number, due to the payment arrangement. Thus, many individuals and families with Medicaid have trouble finding a doctor.
Medicare payments to physicians are set by the Center for Medicare and Medicaid Services (CMS) based on a complex system of relative value units (RVUs). Medicaid payments are set by the states and expressed as a percentage of the Medicare rate. The Medicaid-to-Medicare Fee Index for the United States for 2012 was 0.66 for all services and 0.59 for primary care services. That is, for all medical services the nationwide average payment from Medicaid was only 66% of that paid by Medicare. Among the states the percentage varies widely. North Dakota paid the most, 1.34 for all services. Rhode Island paid the least, 0.37. 2
CHIP
The State Child Health Insurance Program (CHIP) was created in 1997 to provide health benefits to American and immigrant children to the age of 19 not covered by Medicaid or another health plan. It is administered by the states and funded jointly by the federal and state governments. Eligibility varies by state. Medicaid and CHIP are closely related and their data are often combined.
As of 2012, 5.9 million children were covered by CHIP (included in the Medicaid numbers above). The program cost the federal government $9.0 billion and the states $4.0 billion in 2012.
The three major public health benefit programs, Medicare, Medicaid and CHIP, covered 10 million individuals and cost the federal government $800 billion and the states another $180 billion. 3 The three programs are administered at the federal level by the CMS. Medicare is a federal program. Medicaid and CHIP have substantial state administrative and funding involvement.
There are various other federal and state government health programs that will not be discussed. They include the Veterans’ Administration, Tricare for military personnel and retirees and families, the Federal Employee Health Benefits Program and the many programs sponsored by state and local governments for their own employees.
Employer-Sponsored Health Plans
The recipients of employer-sponsored health benefit plans fall into three groups: active employees, retirees and early retirees. There is also an important division between the private sector and the public sector. In general, government employees are more likely to have access to health benefits and those benefits are typically more generous than those in the private sector.
Active employees of medium and large employers (and their dependents) are generally covered by the employer’s group health plan. The employer’s plan is the primary, and often the only, payer of medical benefits. If the employee’s spouse also has coverage, it may be the secondary payer. As indicated in Table 2, private sector employees with access to employer-provided health benefits has declined in recent years, as has their eligibility and take-up rates. In the public sector, they have increased. The employer contribution share has decreased in both sectors.
Number of Private Sector Employers, Percentage of Employers That Sponsor Health Benefit Plans and Take-Up Rates, Selected Years, 1997 to 2010 (Employers in Millions).
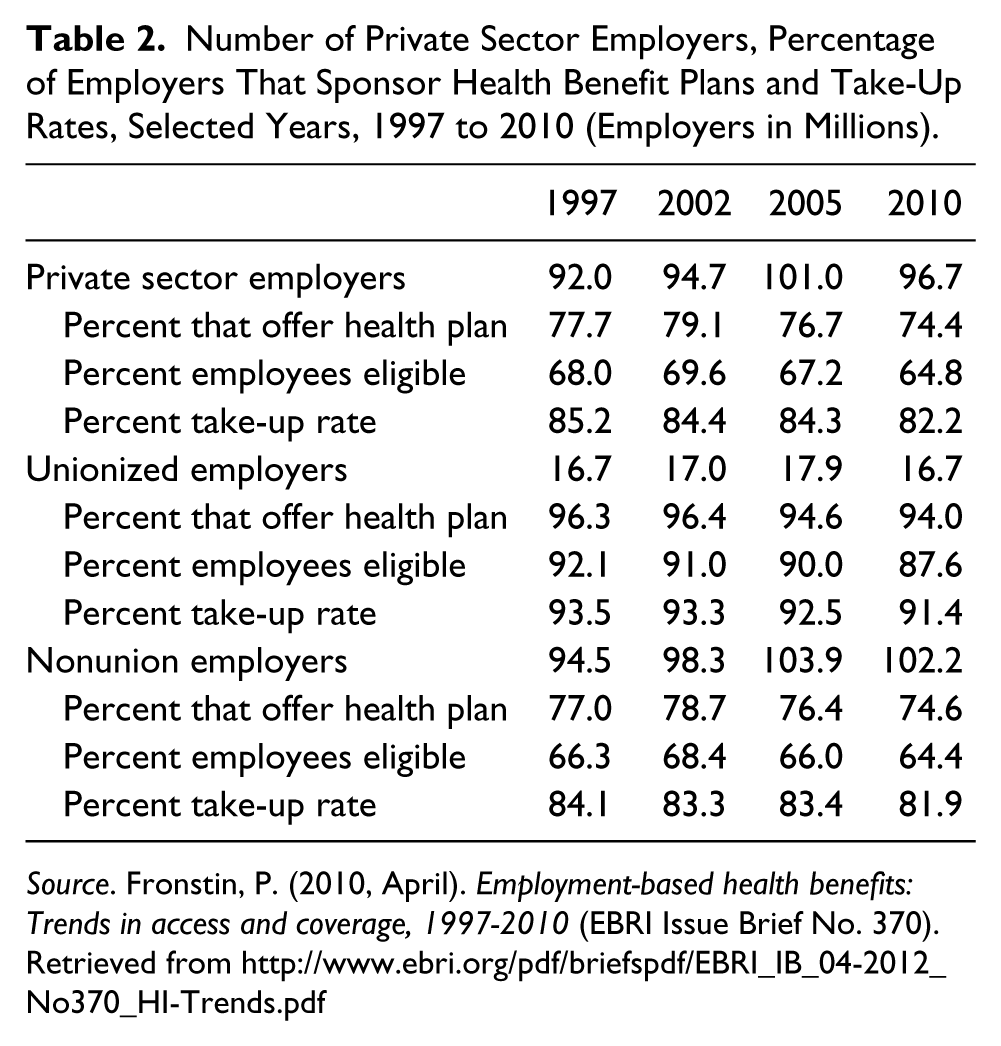
Source. Fronstin, P. (2010, April). Employment-based health benefits: Trends in access and coverage, 1997-2010 (EBRI Issue Brief No. 370). Retrieved from http://www.ebri.org/pdf/briefspdf/EBRI_IB_04-2012_No370_HI-Trends.pdf
Almost all retired employees age 65 and older are covered by Medicare. The retiree and spouse may have employer-sponsored or individually purchased Medigap insurance. If so, Medicare is the primary payer and the employer plan or Medigap insurance is the secondary.
Early retirees, usually defined as age 55 to 64, are not yet eligible for Medicare. They often continue to be covered by the employer’s health plan. Given the cost of individually purchased health insurance, it would be unusual for a healthy person without continuing employer health coverage to retire early. For early retirees, the employer plan is the primary or only payer.
Employers have been reducing their sponsorship of retiree health benefits for years. It is customary to report data separately for early retirees and Medicare-eligible retirees. As reported in Table 3, the percentage of “all employers” that sponsor health benefits for early retirees fell from 11.3 in 1997 to 6.2 in 2011. For Medicare-eligible retirees, the decline was from 10.2% to 5.8%. For employers with 1,000 or more employees, health benefit coverage for early retirees fell from 51.9% to 34.0% and for Medicare-eligible retirees from 44.4% to 29.87%.
Percentage of Private Sector Employers Offering Retiree Health Care Benefits and Percentage of Employees Eligible, 1997 to 2011.
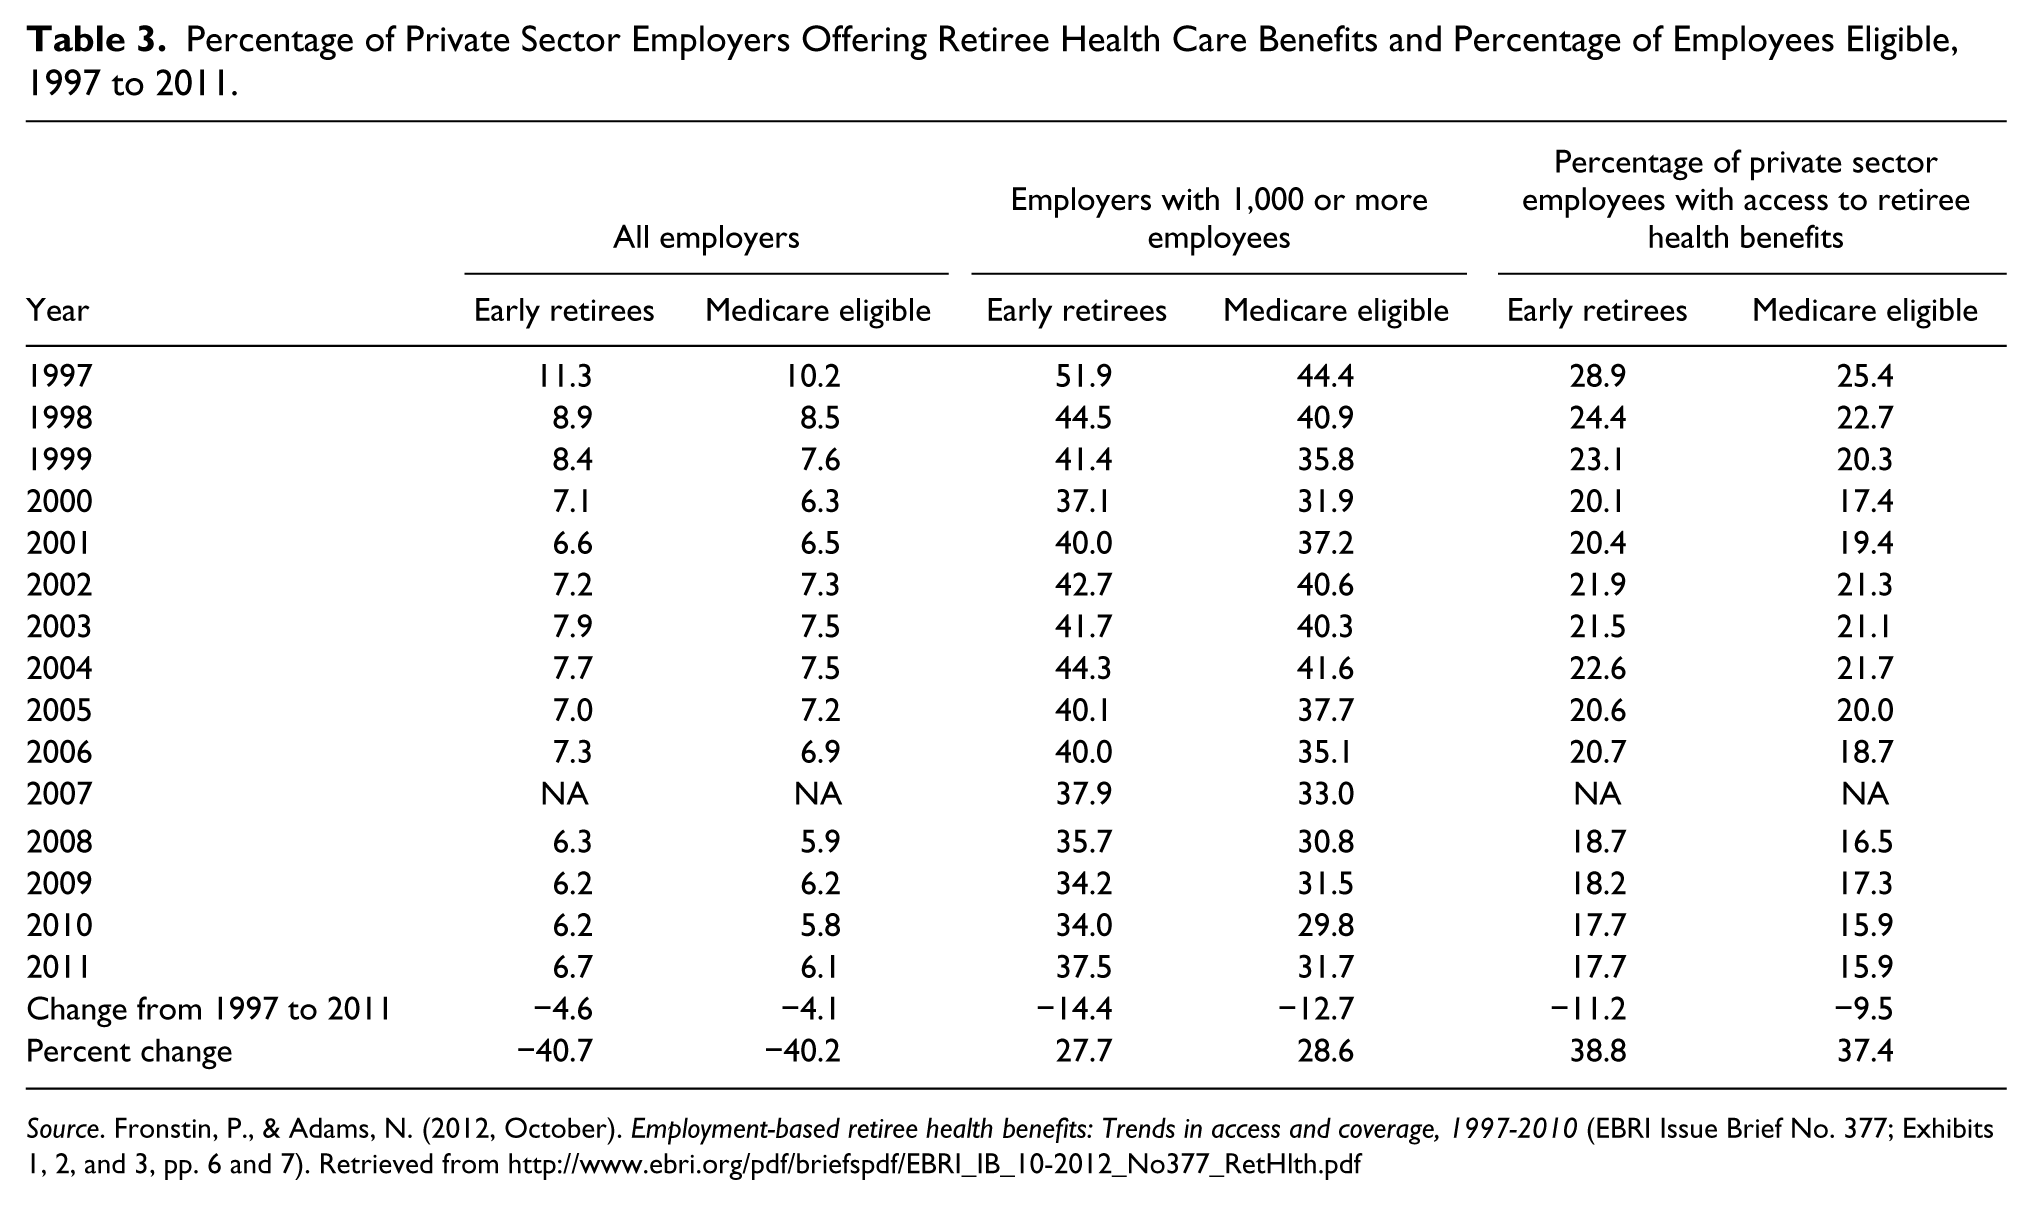
Source. Fronstin, P., & Adams, N. (2012, October). Employment-based retiree health benefits: Trends in access and coverage, 1997-2010 (EBRI Issue Brief No. 377; Exhibits 1, 2, and 3, pp. 6 and 7). Retrieved from http://www.ebri.org/pdf/briefspdf/EBRI_IB_10-2012_No377_RetHlth.pdf
The Uninsured
The employment-based health benefit system augmented by Medicare, Medicaid and CHIP has worked very well for some, pretty well for others and badly for those left without coverage. As indicated in Table 4, the uninsured increased (all ages) from 41.0 million in 1997 to 48.6 million in 2010, about 15% of the U.S. population. It declined to 44.8 million (14.4%) in 2013 and to 41.0 million (13.1%) in 2014-Q1.
Number and Percentage of Persons Without Health Insurance Coverage, 1997 to 2013 (Numbers in Millions).
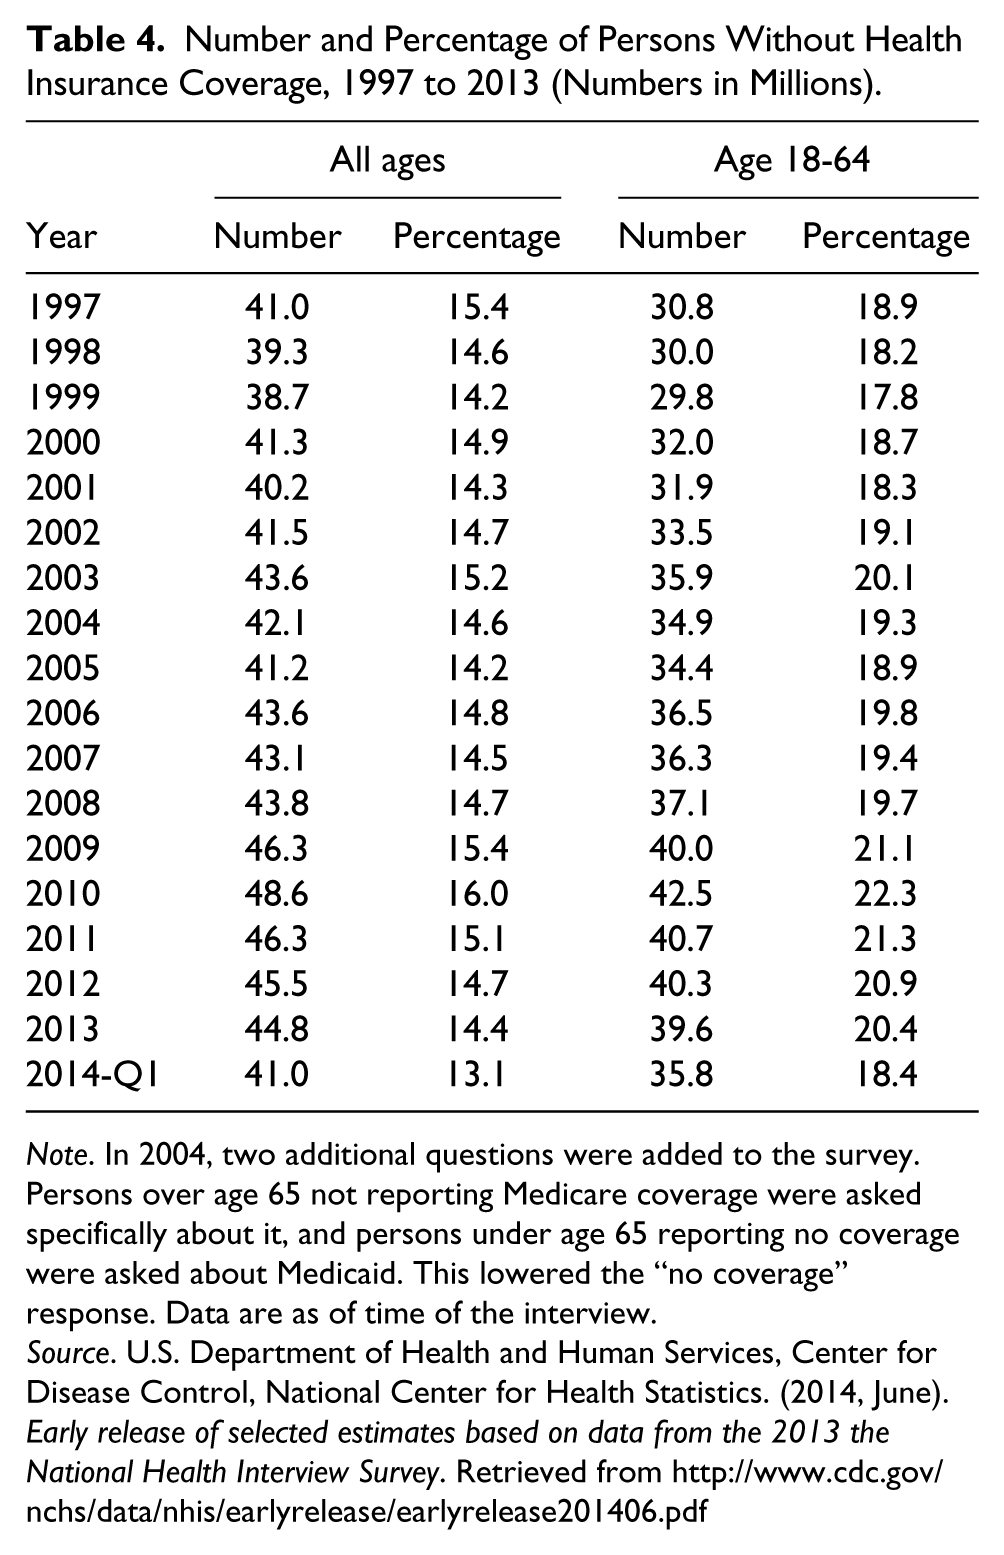
Note. In 2004, two additional questions were added to the survey. Persons over age 65 not reporting Medicare coverage were asked specifically about it, and persons under age 65 reporting no coverage were asked about Medicaid. This lowered the “no coverage” response. Data are as of time of the interview.
Source. U.S. Department of Health and Human Services, Center for Disease Control, National Center for Health Statistics. (2014, June). Early release of selected estimates based on data from the 2013 the National Health Interview Survey. Retrieved from http://www.cdc.gov/nchs/data/nhis/earlyrelease/earlyrelease201406.pdf
Among the working-age population (18-64), the number of uninsured went from 30.8 million (18.9%) in 1997 to 42.5 million (22.3%) in 2010. It then declined to 39.6 million (20.4%) by 2013 and to 35.8 million (18.4%) in 2014-Q1. The recent improvement is due to the ACA.
Some of the uninsured are the “healthy young invincibles.” They do not think they need health insurance and, statistically, they may be right. Others are the older, sicker and with families. They often worked one or more low-wage jobs without health benefits. The uninsured often get their medical needs serviced from hospital emergency rooms.
In 1986, Congress enacted the Emergency Medical Treatment and Labor Act (EMTALA; Pub. L. 99-272). It prohibits hospitals from refusing emergency care to anyone, regardless of ability to pay. It also restricted hospital “patient dumping.” Emergency room treatment is expensive. Moreover, it is generally limited to emergency treatment and lacks the early diagnosis and preventive care that keeps small problems from becoming big and more expensive problems.
Who Benefits the Most From Health Insurance?
Health insurance does not ensure good health. It protects us from the financial consequences of a physical or health catastrophe or a chronic condition. A health problem of even medium magnitude can devastate a family’s net worth. Employer-provided health insurance is of most value to members of the middle class, broadly defined. They own the assets that are protected. They also benefit most from the tax treatment of employer health benefits. If they received an equivalent amount of income, it would be taxed at their marginal (highest) rate.
The uninsured population is generally at the lower end of the income distribution. Such families would typically not have substantial financial assets to protect. A health problem, especially if accompanied by job loss or reduced earnings, often triggers Medicaid eligibility.
Extending health benefits to the uninsured will clearly help by providing early diagnosis and intervention. However, it will not provide the asset-protection and the tax advantage that it gives the middle class.
The primary goals of the ACA were to extend health benefit coverage to the uninsured and to reduce spending on health care. That implied reversing the private sector trend of employers curtailing their sponsorship of health plans. As reported in Table 2, the percentage of private sector employees with access to health benefit plans had declined from 79.1 in 2002 to 74.4 in 2010. The decline was driven largely by increasing cost of medical benefits. Note how much better union-represented employees have fared compared to the nonunion.
Table 5 compares the general rate of inflation (CPI-U) with that of medical cost inflation plus three subsets of medical costs for the period 2001 to 2014. Over the 14-year period, health care inflation was significantly higher than the general (CPI-U) rate. The cost of hospital and related services was the big driver of medical inflation, averaging 6.1%.
Percent Change in CPI-U All Items and Medical Costs, December to December 2001 to 2014.
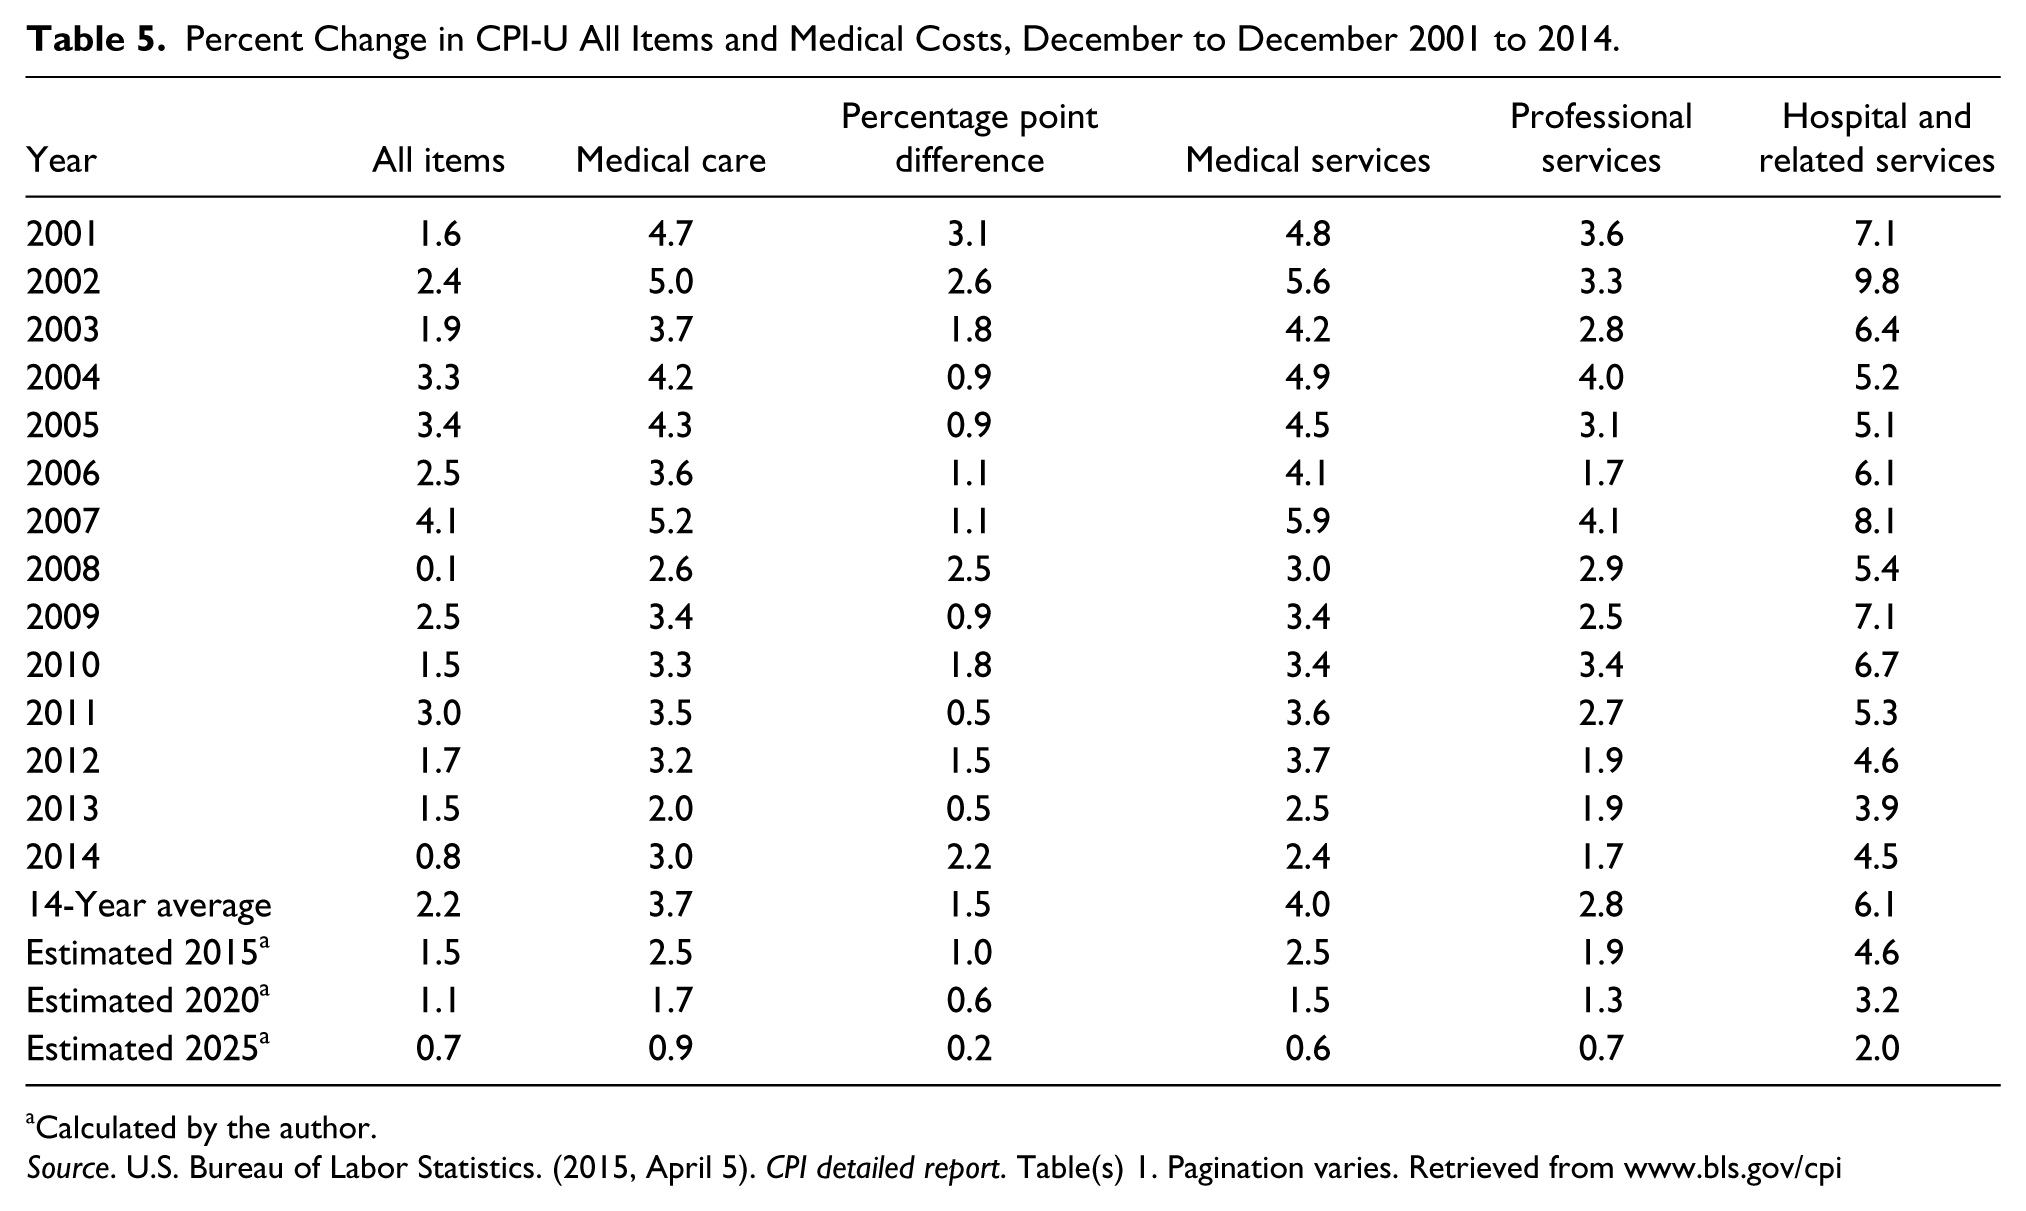
Calculated by the author.
Source. U.S. Bureau of Labor Statistics. (2015, April 5). CPI detailed report. Table(s) 1. Pagination varies. Retrieved from www.bls.gov/cpi
Table 5 also forecasts the trends of general inflation and medical cost inflation and their subsets to 2015, 2020, and 2025 (author’s calculations).
Conclusion
Because of the Supreme Court ruling in 1949 that retirement and, by extension, health benefits were mandatory subjects of bargaining under the NLRA, and because of the resistance of the American Medical Association and others, the United States has developed its unique primarily employment-based health benefit system. The absence of comprehensive national health insurance has resulted in the federal and state governments to create a complex mosaic of public health insurance programs, most notably Medicare, Medicaid and CHIP. Various important interest groups evolved under this system. They include health care providers (hospitals, physicians and others), pharmaceutical corporations and manufactures. It is against this backdrop that the Affordable Care Act was developed.
Footnotes
Declaration of Conflicting Interests
The author declared no potential conflicts of interest with respect to the research, authorship, and/or publication of this article.
Funding
The author received no financial support for the research, authorship, and/or publication of this article.