



Abstract
This article reports the results of an analysis of a matched sample of companies that use economic profit (EP) as part of their criteria for awarding incentive compensation for their Named Executive Officers (NEO) compared with competitor firms that do not (non-EP firms). Companies using EP display stronger relationships between changes in estimated EP and changes in yearly NEO average total compensation. A number of other financial metrics are compared between the two samples. Interestingly, the within sample, cross-firm analyses show weaker relationships between compensation and estimated EP for EP firms than for non-EP firms. This weaker relationship may be due to an unobservable, underlying factor stimulating a company’s adoption of EP as a criterion for the incentive compensation part of yearly NEO average total compensation.
Introduction
This article is the third in a series of studies that have explored the relationship between economic profit (EP) and executive compensation. The first described a four-step process for adjusting EBITDA, a widely used performance metric to evaluate operating managers, to approximate EP, a more shareholder-oriented profit metric. 1 It was argued that the proposed approach could be easily understood and used by nonfinancial operating managers and would appropriately reward and incent managers to the extent that earnings exceeded a risk-adjusted return on capital.
A second article sought to establish benchmarks for the share of EP that was actually paid to the executive teams at the largest public companies in the United States. 2 The endeavor was unsuccessful, not due to the lack of data, but to the very weak, almost nonexistent link between estimated EP and yearly “Named Executive Officer” (NEO) Average Total Compensation (NEO-ATC). 3 By far, the dominant empirical explanation for the differences in cross-company executive compensation levels was the difference in company size, whether measured by total assets or revenue. 4 The only statistically significant relationship between estimated EP and NEO-ATC was a slightly higher increase in compensation for companies reporting increases in estimated EP compared with those reporting decreases. Among the reasons offered for the inability to find meaningful empirical benchmarks was that so few companies, in that large sample, might actually employ an EP basis so that whatever patterns existed would be the proverbial “needle in the haystack” and thus difficult to identify.
In this third investigation of EP and executive compensation, a matched set of public companies was crafted to assess yearly NEO-ATC levels in those companies that report using EP (the EP firms) versus a group of competing companies who do not use EP (the non-EP firms). Again, and as detailed below, although there is a stronger empirical relationship between changes in EP and changes in yearly NEO-ATC over the 5 years studied (2011-2015), there is no evidence of a strong cross-company relationship between yearly NEO-ATC levels and estimated EP, even within the sample of EP firms.
Why Economic Profit Is Often Considered the Single Best Financial Measure of Performance
Traditionally, compensation plans have assessed financial performance on the basis of metrics such as net income; earnings before interest, taxes, depreciation and amortization (EBITDA); earnings per share (EPS); return on assets (ROA); return on net assets (RONA); total shareholder return (TSR) or share price appreciation. Each of these has some merit, but each also has important shortcomings. Stock prices are the product of market forces outside a manager’s control and less relevant, if at all, to privately held companies. Rates of return metrics do not reward managers for the situation in which value is created by monetarily growing business revenues and profits, not solely increasing percentage returns. On the other hand, traditional accounting earnings and EPS ignore capital deployed and fail to measure actual returns against those expected by shareholders. Even EBITDA may encourage managers to overinvest in capital-intensive endeavors.
Economic profit is defined as net operating profit after tax (NOPAT), less the cost of invested capital. In a single metric it combines “both the rate of return relative to the cost of capital and the magnitude of the performance.” 5 EP is applicable to both publicly and privately owned ventures—especially in situations where investments and returns can and should be balanced.
Of course, there are company situations in which EP may not be an appropriate gauge for management performance. For example, EP may be less appropriate for startups or end-of-life firms where maximizing very long-term returns, finding attractive acquirers or minimizing likely losses are key management tasks. In spite of the fact that EP is not always a suitable indicator of value creation for all companies in all situations, it is still touted by organizations, such as the venerable consulting firm McKinsey, as the “strategic yardstick you can’t afford to ignore.” 6
Following the advice of many consultants, a number of companies have adopted some form of EP as at least one of their bases for awarding executive incentive compensation. These include, at one time or another, Ball Corp., Best Buy, Genesco, Harsco, Herman Miller, Nucor, Target, Temasek, Tenneco, ThyssenKrupp, Watco and Whole Foods Markets. 7
But How Important Is EP in Explaining Cross-Firm Differences in NEO Compensation?
As stated earlier, the answer to this question is, in short, “not very important.” In our earlier study, size of company (whether measured as revenue or total assets) was about 10 times as more powerful than estimated EP in explaining cross-firm differences in yearly NEO-ATC. In fact, this earlier study showed that very large firms could produce very large losses, whether measured as estimated EP or accounting net income. As far as yearly NEO-ATC was concerned, that study showed it is better to be running a large firm with large losses than a smaller, more profitable company. The dominance of firm size confounds any attempt to benchmark compensation percentages of profits, however the latter are measured.
If there was any good news in our previous two studies for EP advocates, it is that we documented a positive, but relatively weak, relationship between changes in estimated EP and changes in yearly NEO-ATC. Companies that increased their estimated EP from year to year were slightly more likely to increase their yearly NEO-ATC than those companies in which estimated EP declined over the same periods. Changes in operating income were stronger predictors of changes in NEO-ATC; however, suggesting that while profitability is important, the adjustment for capital employed was not as important in evaluating NEO performance and awarding compensation.
So why is EP such a poor predictor of cross-company differences in compensation compared to the much stronger predictive power of company size? Some potential explanations for the very weak relationship between estimated EP and yearly NEO-ATC have surfaced. One is that companies in dire straits (those with large negative EP) may have to pay executives more to convince them to attempt turnarounds of large, currently unprofitable, businesses. Another possible explanation is that EP is not sufficiently sensitive to management performance due to time lags and/or the vagaries of the measurement. Indeed, and for example, a survey reported in the Harvard Business Review concluded that there is much variation in how businesses measure their cost of capital (weighted average cost of capital [WACC]). 8 Thus, for any one or more of the above possibilities and even among businesses that use some form of EP, the cost of capital may be sufficiently malleable such that EP adds little information over and above an operating income measure.
One Last Chance for EP: Matched-Company Samples
In this, the third and final article in a series focusing on EP and NEO compensation, we report on an analysis of a matched-pair design of EP versus non-EP companies. 9 The process of creating this sample of EP and non-EP companies is described in Appendix A and the resultant company pairings are presented in Appendix B. One of the primary reasons to construct a matched sample of companies was to eliminate any potential bias introduced by having confounded the use of EP with asset intensity or industry differences that were found to be significant predictors of yearly NEO-ATC in our previous studies. Also, by having an equal number of EP and non-EP companies, the analysis is expected to be more sensitive to the potential role of EP in predicting yearly NEO-ATC for those companies who had declared it to be an important performance consideration. In our previous samples, we suspected that too few companies relied on EP so as to have it play an explicit role in determining yearly NEO-ATC. Our expectations for the analyses of this matched sample of companies were that they would show, for EP versus non-EP companies,
a higher positive correlation between NEO-ATC and estimated EP;
a higher positive correlation between changes in yearly NEO-ATC and changes in estimated EP; and
more improvement in estimated EP amounts over the five years for the EP companies.
How EP Was Estimated in This Study
The widely accepted general definition of EP is

We sought to have as company-specific an estimation of EP as possible. To estimate each year’s EP for the companies in this study (none of whom publicly reported a monetary amount for EP), involved several steps:
Net Operating Profit after Tax (NOPAT) was derived by
Using the Operating Profit (OP) amount reported on (or derived from) a company’s income statement presented in their annual 10-k filed with the Securities & Exchange Commission (SEC) and then Multiplying that OP amount by (1 − the company’s effective tax rate). Each company’s effective tax rate, for each year in the sample, was obtained from http://financials.morningstar.com/ratios/r.html?t=KO. (This sample link is for Coca-Cola Company.) For any years where this site reported a zero (a blank) for the effective tax rate, we used a nominal rate of 0.01% so as to effectively preserve the after-tax OP amount at its pre-tax level.
Capital Employed (CE) for each company-year in the sample was derived by
Using the company’s Total Assets (TA) figure, reduced by its Total Current Liabilities (TCL) figure, both of which are reported in a company’s balance sheet presented in its annual 10-k filed with the SEC. Thus, CE = TA − TCL. For each year in our sample, we used CE at the beginning and end of the year to calculate a simple average and it is that average amount, for each year, that was then multiplied by a company’s cost of capital.
The Cost of Capital (CoC) figure was a company-specific amount obtained from the website http://thatswacc.com (accessed and used on April 18, 2016). Since that website uses a company’s real time financial condition to derive a CoC estimate, we used that CoC figure for all years in our sample. 10
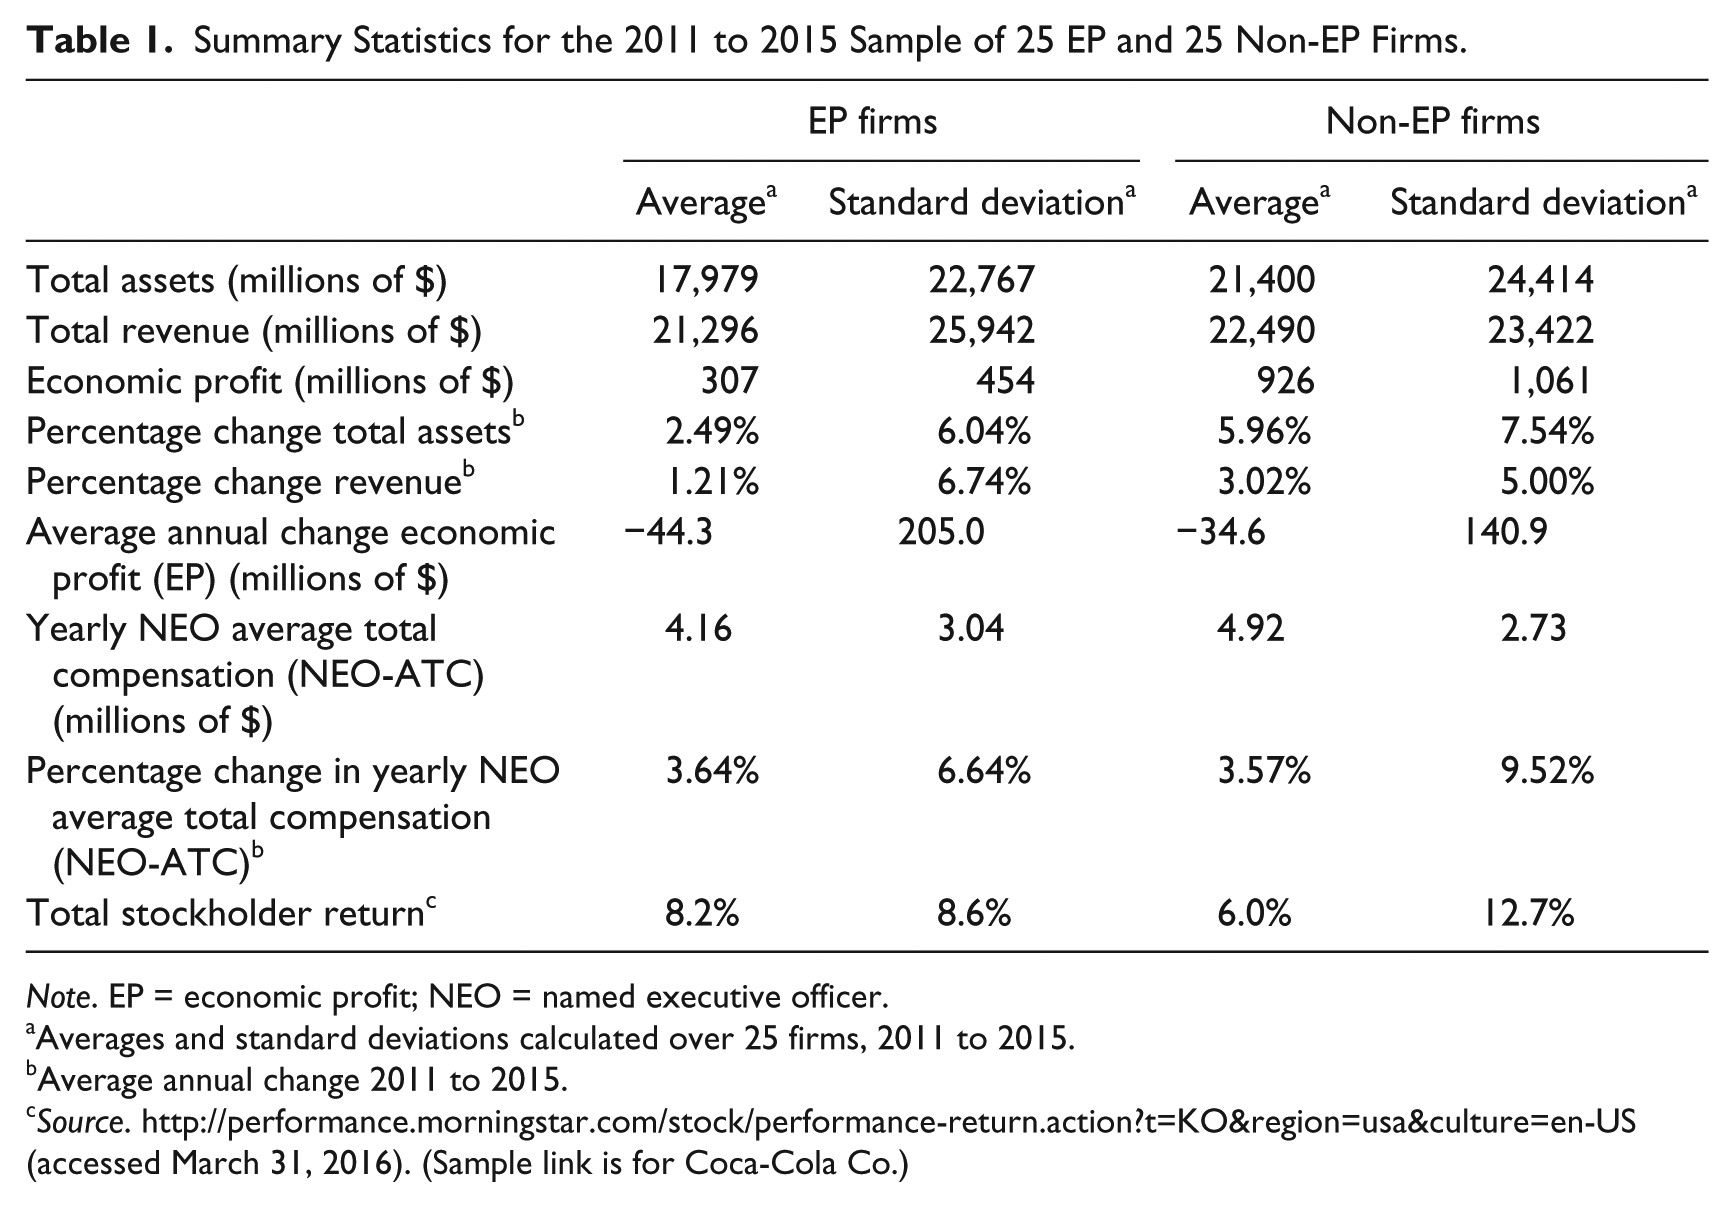
Descriptive statistics for the data accumulated per the above are summarized in Table 1. Although the averages and standard deviations of total assets and revenue presented are very close for the EP and non-EP firms, the non-EP firms are slightly more asset intensive (higher ratio of assets to revenues) and report higher average values for estimated EP—these differences, however, were not statistically significant. In this sample, non-EP firms grew total assets and revenues at higher rates than EP firms. Both EP and non-EP firms, on average, saw estimated EP decline over the study’s 5-year period. Non-EP firms reported lower declines in estimated EP and non-EP companies also reported slightly higher yearly NEO-ATC, but neither of these differences were statistically significant. (Percentage changes in estimated EP are not reported because the negative EP values are not appropriate for calculating percentage changes.) For both samples, the rate of growth in yearly NEO-ATC was (1) slightly more than the growth in revenue, (2) very close to the percentage change in total assets for EP firms and (3) well below the percentage change in total assets for non-EP firms. While it might be tempting to interpret these descriptive results as demonstrating more careful asset management for EP firms, the differences are only slight and as such, not conclusive and a much larger sample would be needed to establish statistical significance.
Summary Statistics for the 2011 to 2015 Sample of 25 EP and 25 Non-EP Firms.
Note. EP = economic profit; NEO = named executive officer.
Averages and standard deviations calculated over 25 firms, 2011 to 2015.
Average annual change 2011 to 2015.
Source. http://performance.morningstar.com/stock/performance-return.action?t=KO®ion=usa&culture=en-US (accessed March 31, 2016). (Sample link is for Coca-Cola Co.)
The data summarized in Table 1 represent a between-samples analysis. We are also interested in within-sample firm behaviors over the same time period. For example, do EP companies compensate their NEO’s in a more closely aligned EP fashion than non-EP companies? We addressed this question by comparing the percentage of variance explained (R-square) and the regression slope (i.e., the difference in yearly NEO-ATC as a ratio to a difference in estimated EP) obtained when regressing estimated EP on yearly NEO-ATC for each of the two samples. Two insights of note surfaced. First, and a bit surprising, the non-EP firms were more likely to show closer alignment between differences in estimated EP and differences in yearly NEO-ATC than the EP firms. The percentage variance explained for non-EP firms is approximately 42% compared to only 18% for the EP firms. Second, non-EP firms show yearly NEO-ATC as a function of estimated EP rising at almost twice the rate as that for EP firms. Non-EP firms, collectively, report about $2.2 million in yearly NEO-ATC for a $1 billion difference in estimated EP, while the same ratio for EP firms is $1.2 million for a $1 billion difference in estimated EP. See Figure 1A and B.

(A) Relationship of estimated EP and NEO average total compensation for non-EP firms—five observations for each year (2011-2015) for 25 firms (NEO compensation in dollars, EP in millions of dollars). (B) Relationship of estimated EP and NEO average total compensation for EP firms—five observations for each year (2011-2015) for 25 firms (NEO compensation in dollars, EP in millions of dollars).
Considering the results in Table 1 and Figure 1A and B, we think it is very likely that the reasons firms adopted EP as one of the primary criteria for awarding performance-based compensation is that the firms, compared to their non-EP counterparts, were experiencing lower returns on capital as well as lower growth in revenue and assets. EP has the advantage of rewarding both growth and returns on invested capital. While we clearly do not have the access to the actual motivations and thinking of these companies’ compensation committees, this supposition appears to be consistent with the data.
The equation used for the regressions depicted in Figure 1A and B is a simple linear equation. The line on the charts represent the regression predictions of the relationships between yearly NEO-ATC and estimated EP, but there are a few extreme “outliers.” For example, in 2014, one of the firm’s average NEO total payment was $14 million, estimated EP was $2 billion, 11 and the regression compensation prediction for this firm was just under $8 million (see Figure 1A). This was the highest yearly NEO-ATC in our entire sample. On the other EP extreme, another firm generated an estimated EP of approximately negative $2.3 billion in 2015 while paying NEOs an average of slightly more than $6 million. 12 For this firm, the regression prediction is a negative value for that year’s NEO-ATC, something never observed in our sample (and rarely, if ever, in public firms). As we noted in our earlier article, extreme negative values of estimated EP (or actual EP for that matter) are only possible for very large firms, where size is measured in total assets. With this limitation in mind, we believe it is still interesting to compare the patterns of non-EP firms in Figure 1A with those of EP firms in Figure 1B. 13 However, it does mean that looking at changes in estimated EP is more sensible than trying to interpret cross-firm patterns.
When the focus is solely on year-over-year changes in estimated EP and changes in yearly NEO-ATC, as opposed to the averages, new regressions (see Figure 2A and B) show the opposite pattern from those just noted. Specifically, non-EP firms demonstrate virtually no relationship between changes in estimated EP and changes in NEO-ATC. (Figure 2A actually shows a slightly negative relationship of the average yearly change in estimated EP and the yearly change in NEO-ATC for non-EP firms.) In contrast, for EP firms, almost 35% of the variation in yearly NEO-ATC is predicted by changes in estimated EP.

(A) Relationship of changes in yearly estimated EP and changes in yearly NEO average total compensation for non-EP firms (NEO compensation in dollars, EP in millions of dollars). (B) Relationship of changes in yearly estimated EP and changes in yearly NEO average total compensation for EP firms (NEO compensation in dollars, EP in millions of dollars).
Taken together, Figure 1A and B, along with Figure 2A and B, seem very consistent with the idea that firms experiencing lower than expected growth and return on capital are motivated to adopt EP as a criterion for evaluating executive performance and awarding NEO compensation. Thus, we should be careful about concluding that non-EP firms exhibit a lack of concern about growth and/or returns on invested capital. They may simply have other problems or challenges that require other incentive metrics (e.g., market share or new product development). Or, as other studies have highlighted, more exogenous factors and forces may be at play in the performance-metric-selection decision such as macroeconomic conditions, the labor market for executives, executives’ career considerations, the pro-activism and preferences of the firm’s board of directors, tax regulations, institutional shareholder concentration, choice of peer-company comparators, and choice of compensation consultants. 14 A few prior studies present results pointing to the differential effects of these latter two factors. 15
In our previous studies, as mentioned earlier, we found that total assets were the strongest predictor of cross-firm differences in yearly NEO-ATC. Figure 3A and B shows similar results again for the firms in this sample. 16 While both regressions in Figure 3A and B show generally similar relationships between total assets and yearly NEO-ATC, the curve for EP firms starts higher and does not rise quite as fast as the curve for non-EP firms. The curves cross at total assets of about $25 billion and for the very largest firms (total assets of about $80 billion), fitted-NEO-ATC for an EP firm is about 73% of that for a correspondingly large non-EP firm. Furthermore, the alignment between the two variables is closer for non-EP firms (percentage of variance explained for the non-EP sample is about twice that for the EP sample, 83.6% vs. 43.9%). We speculate that this relative lack of alignment in the EP firms may have been one of the motivations for some of the EP firms to adopt EP as a criteria for awarding incentive compensation. And, Figure 3A shows that in 2015 the highest paid NEOs in the non-EP sample were paid an average of slightly more than $12 million while managing a firm with total assets of about $44 billion. The regression (in this case nonlinear) predicted yearly NEO-ATC of about $8 million. The firm with the most total assets ($82 billion) paid their NEOs an average of just over $10 million.
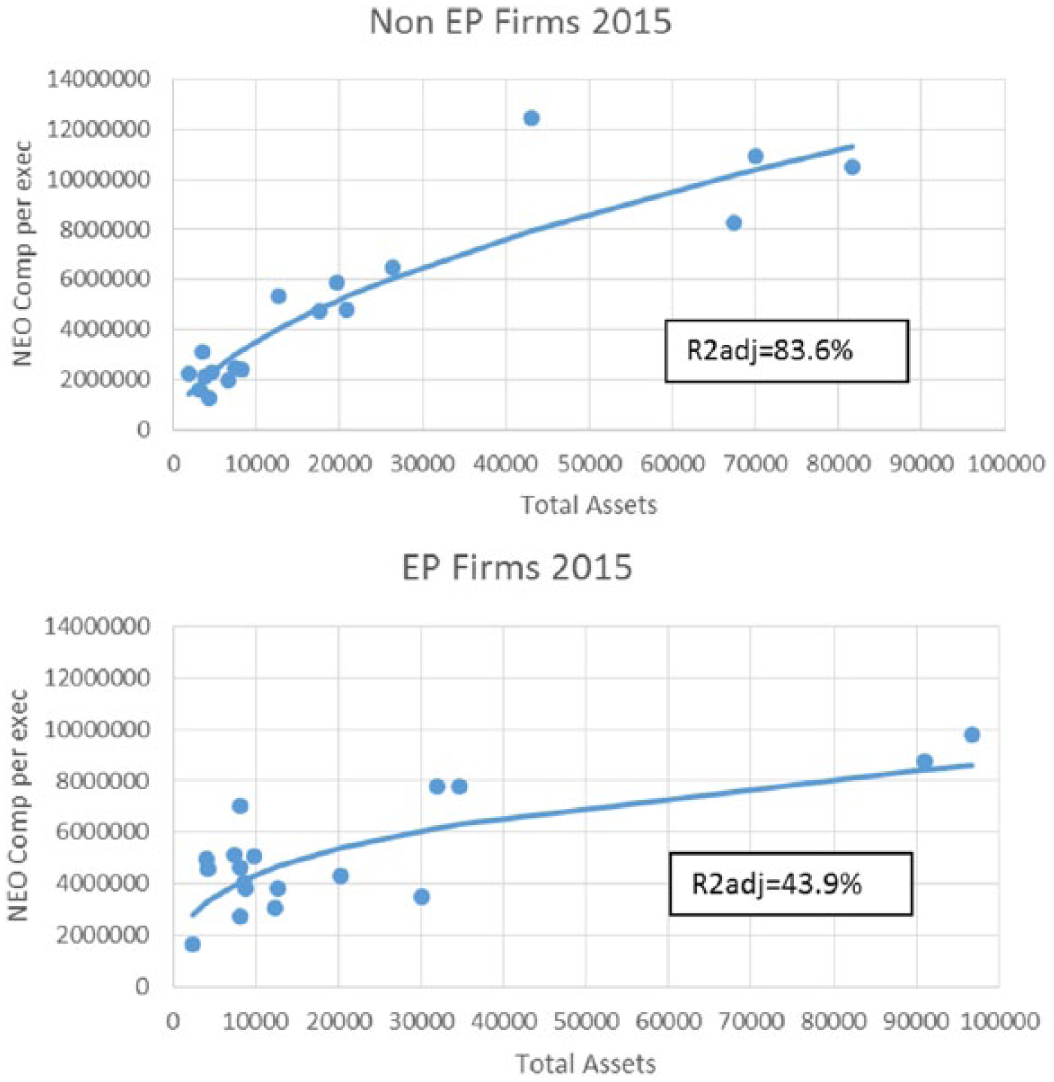
(A) Cross-firm relationship between total assets and NEO average total compensation, non-EP firms (total assets in millions of dollars and NEO compensation in dollars). (B) Cross-firm relationship between total assets and NEO average total compensation, EP firms (total assets in millions of dollars and NEO compensation in dollars).
On the other hand, it is heartening that firms adopting EP indeed, “walk the talk” to some extent by more closely aligning changes in estimated EP to changes in yearly NEO-ATC. Unfortunately, the results from this paired sample do not show more positive trends in estimated EP as a result of having adopted EP in the total compensation determination. Other structural or strategic factors, such as those mentioned earlier, appear to have outweighed the effects motivating executives through EP-related compensation packages. The matched sample of non-EP firms grew revenues and assets more than twice the average rate that EP firms did (see Table 1). Although both EP and non-EP firms, on average, produced lower estimated EP over the period of this study, the non-EP firms shrank estimated EP less in both absolute dollars and as a percentage change.
“Pay Leverage” Insights: Some Support for the Role of EP
As we bring our three-study investigation of EP and NEO compensation to a close, one further probe is borne of two points. First, the matched-pairs-sample derivation process (see Appendix A) resulted in some EP companies that experienced revenue growth over the 5-year sample period and some that did not. Likewise, it resulted in some EP companies that experienced increases in yearly NEO-ATC while others did not. Both circumstances were also true for the non-EP firms. As a result, we partitioned the sample accordingly. The second point is that, as we discussed earlier, we did find some support for the role of changes in estimated EP being associated with changes in NEO-ATC for the EP firms. We wanted to explore that a bit more using a recently touted and highly interpretable compensation metric—“pay leverage” multiple. 17 Specifically, we wanted to begin exploring changes in revenue due to the importance of such a size metric in our prior study’s results and others. We derive the pay leverage multiple for each of the partitioned sample subsets and compare the EP firms’ respective pay leverage multiples with those of the non-EP firms. The usefulness of this metric is limited to its descriptive nature as opposed to any statistical foundation. Our expectations are that (1) this partitioning’s separation of growing firms from shrinking firms will decouple the effects of one firm’s good performance from another’s bad performance and (2) changes in estimated EP for the EP firms’ yearly NEO-ATC is likely to be more responsive to changes in revenue and estimated EP than for non-EP firms.
Table 2 presents the pay leverage results. First, the upper-left cells indicate that EP firms have a relatively higher 5-year NEO-ATC compensation multiple (1.46) than non-EP firms (1.24). Second, and in a similar fashion as just noted, the lower-right cells point to a larger 5-year NEO-ATC decrease for EP firms (3.51) when sales decline than for non-EP firms (0.96). Third, in those instances when company sales have declined but 5-year NEO-ATC is increasing (lower-left cells), clearly due to other non–revenue-related factors, the increase in the 5-year NEO-ATC is smaller for non-EP firms (−2.23) than for EP firms (−2.90). Last, the upper-right cells present the scenario when revenues are increasing but 5-year NEO-ATC declines. This may be due revenue growth that may not have resulted in increases in a firm’s actual earnings-based, compensation-based performance metric (e.g., EP, return on assets, etc.). For this sample, and in this instance, the pay leverage multiples in the upper-right cells indicate that for those companies using EP at a time when revenues grew but NEO-ATC declined, it declined more (−3.32) than it did for the non-EP companies (−0.69).
Five-Year “Pay Leverage” to Revenue Multiples (% Change in NEO-ATC/% Change in Revenue) a .

To derive the % Change in NEO-ATC, we first calculated the 5-year percentage change for each firm according to: ((2015 NEO-ATC − 2011 NEO-ATC)/(2011 NEO-ATC). We then calculated the average of this measure for the firms in each cell. A similar process was used to derive the 5-year % Change in Revenue figures. As an example of the interpretation of the pay leverage multiples above, consider the upper-left cell in Panel A (top table). The pay leverage multiple applicable to this sample’s five year focus is 1.46, thus suggesting that for every 10% increase in revenue, NEO-ATC increased 14.6%.
Note. EP = economic profit; NEO = named executive officer; ATC = average total compensation. We also looked into the pay leverage multiples as a function of estimated EP. Due to the vagaries of some of the % changes in estimated EP being extremely large from 2011 to 2015, we ascertained those multiples were not interpretable. It is, however, interesting to note the number of firms in each of the same partitioned sample subsets. Those were dispersed as follows:

Each of the four conditions depicted in Table 2 warrant further research using the “pay leverage” construct and/or the closely related EP “momentum” concept. 18 The results depicted in Table 2, in general, point to a greater impact, both positively and negatively, on NEO total compensation for those firms using EP as part of their performance-based NEO total compensation vis-à-vis the non-EP firms (see upper-left, lower-left, and lower-right cells). The upper-right cells call for further inquiries before any performance-based conclusions, as speculative as they might be, can be rendered.
Limitations
We are well aware that there are many differences in the situations and objectives of companies that influence the adoption of certain metrics for performance evaluation and NEO compensation. These differences are largely unobserved therefore unaccounted for in an analysis of publicly available, aggregate data. We believe that our matching process captured and controlled for at least some of these unobserved differences among firms. We are aware of these and other difficulties and have attempted, throughout this article, to be transparent about the limitations of this study. For example, we have estimated the cost of capital from other sources and did not have access to the rates that companies actually use. It is also well known that book value of assets, which we used to estimate EP and total assets, have limitations as estimates of replacement costs or market values that might be more appropriate foundations for estimating EP. Moreover, for the EP firms, we did not have access to the actual monetary EP amounts they derived and used. Another shortcoming is the reality of the small number of firms actually using EP relative to those that do not and thus, the small sample size of 25 EP firms and 25 non-EP firms in this study.
Summary and Practical Implications
Pay for performance is conceptually sound, publicly popular, and problematic in reality. In fact, some researchers have recently declared that “CEOs are not paid for performance,” 19 and when it appears that they have been, it is “more by chance than by design” 20 —these are strong assertions. Thus the rise, to some extent, of the historical argument for EP as a viable metric for assessing firm and management performance. EP appears, however, to have had more theoretical appeal than applicability to management and boards of directors. EP advocates have been mainly consultants, academics, and the business press. The fact that only a small percentage of large, sophisticated companies report EP as a consideration in evaluating executive performance is, by itself, an indication that shareholders and boards have yet to be convinced of EP’s superior properties.
Even if businesses have largely stayed away from EP, at least as the primary metric for establishing NEO incentive compensation, our hope was to find that EP was effective in capturing the essence of several other financial metrics used in evaluating performance: in particular, revenue growth, return on capital employed and operating profits. If so, then it would be a good predictor of differences in yearly NEO-ATC for EP firms versus non-EP firms. Of course, in one of our earlier, previously mentioned studies, we found that total assets and revenues are the best predictors of yearly NEO-ATC—not estimated EP. In this current study, we also found that estimated EP, somewhat perversely, explains more of the cross-firm variance in yearly NEO-ATC for those who do not note EP as one of the primary criteria for establishing performance compensation. Perhaps it is the lack of a relationship between estimated EP and yearly NEO-ATC for non-EP firms that stimulated companies to adopt EP as at least one of the criteria for awarding incentive compensation.
However, at least the EP companies practice what they preach to some extent. As our data here have shown, for our sample of companies using EP, the changes in yearly NEO-ATC were more strongly linked to changes in estimated EP than for non-EP firms. Less encouraging, however, is the fact that there was little difference in the change in estimated EP between the two samples. Table 1 reports that EP firms, as well as non-EP firms, report average declines in estimated EP over the 5-year period, with EP firms declining slightly more in dollar terms than non-EP firms. One might have hoped that rewarding managers on the basis of EP would stimulate changes that would improve it. EP companies also reported lower average estimated EP for the 5 years studied even with similar average revenues and slightly lower total assets. This may again indicate that the companies adopting EP were doing so because they were more in need of focusing on efficient allocation of capital employed than non-EP firms.
Besides some of the practical implications sprinkled throughout the article, another implication that we see from this study for practitioners is that there are limits on what a compensation package can do to enable executives to change structural and strategic trends. At least over the time period investigated here, EP firms did not manage to show positive trends in estimated EP or even show better trends than their non-EP counterparts. This was in spite of the fact that the EP firms, relative to non-EP firms, were more likely to align changes in compensation with changes in estimated EP. Over longer periods, might the focus on EP result in a higher EP performance? Perhaps, but 5 years covered by our study is not a short period and boards and stockholders might not have the patience to wait for turnarounds that take longer. The generally positive macroeconomic trends during this study’s time frame (see Appendix D) might also have taken the focus and emphasis off of EP. If the macroeconomic trends had been negative, might the observed patterns have also been different? Again, perhaps.
Although more of an opinion than something directly concluded from our study, we believe that there is another practical implication, especially for large firms, such as the ones in our study: changing company performance as a direct result of changing criteria for executive compensation can only work with significant time lags. As such, boards and compensation committees need to recognize these lags and not depend on, or even necessarily expect, compensation packages to change financial performance quickly. To use a nautical example, oil tankers cannot be maneuvered like speed boats. Thus, firms such as those in our sample, that get into “EP trouble” may not quickly see improvements in EP by simply adopting it as a criteria for awarding NEO incentive compensation.
If it is still true, as others have asserted, that (1) “executives generally believe that earnings per share (EPS) is the most important measure of value creation” 21 ; and (2) that “employees [do] not appreciate that capital has a cost”; and (3) that “managers [do] not focus enough on the balance sheet”; and (4) that “many business units generate profits that fail to cover the cost of capital,” 22 then compensation committees and their consultants have a sizeable educational task before them to raise their company’s value-creation IQ. Due to the results presented in our three EP studies presented in the pages of this journal, there is no evidence that suggests such a task has been widely accomplished.
Footnotes
Appendix A
Appendix B
Paired Companies (Stock Ticker) (SIC).

| EP company | Non-EP company | |
|---|---|---|
| 1 | Coca-Cola Co. (KO) (2080) | PepsiCo, Inc. (PEP) (2080) |
| 2 | 3M Co. (MMM) (3841) | Boston Scientific Corp. (BSX) (3841) |
| 3 | Clorox Co. (CLX) (2842) | Colgate-Palmolive Co. (CL) (2844) |
| 4 | United Rentals Inc. (URI) (7359) | TAL International Group, Inc. (TAL) (7359) |
| 5 | PulteGroup Inc. (PHM) a (1531) | KB Home (KBH) (1531) |
| 6 | Whole Foods Market, Inc. (WFM) (5411) | Ingles Markets, Inc. (IMKTA) (5411) |
| 7 | Avery Dennison Corp. (AVY) (2670) | Bemis Company, Inc. (BMS) (2670) |
| 8 | Republic Services, Inc. (RSG) (4953) | Waste Management, Inc. (WM) (4953) |
| 9 | Crown Holdings, Inc. (CCK) (3411) | Silgan Holdings, Inc. (SLGN) (3411) |
| 10 | Essendant Inc. (ESND) (5110) | WESCO International, Inc. (WCC) (5063) |
| 11 | ManpowerGroup, Inc. (MAN) (7363) | Kelly Services, Inc. (KELYA) (7363) |
| 12 | National Oilwell Varco, Inc. (NOV) (3533) | Baker Hughes, Inc. (BHI) (3533) |
| 13 | Avnet, Inc. (AVT) (5065) | Tech Data Corp. (TECD) (5045) |
| 14 | Boeing Co. (BA) (3721) | Lockheed Martin Corp. (LMT) (3760) |
| 15 | Target Corp. (TGT) (5331) | Costco Wholesale Corp. (COST) (5331) |
| 16 | Archer-Daniels-Midland Co. (ADM) (2070) | Bunge Ltd. (BG) (2070) |
| 17 | Deere & Co. (DE) (3523) | Caterpillar, Inc. (CAT) (3531) |
| 18 | Halliburton Co.(HAL) (1389) | Schlumberger Ltd. (SLB) (1389) |
| 19 | AutoZone, Inc. (AZO) (5531) | O’Reilly Automotive, Inc. (ORLY) (5531) |
| 20 | Ball Corp. (BLL) (3411) | Greif, Inc. (GEF) (3412) |
| 21 | Tenneco, Inc. (TEN) (3714) | Meritor, Inc. (MTOR) (3714) |
| 22 | BorgWarner, Inc. (BWA) (3714) | Autoliv, Inc. (ALV) (3714) |
| 23 | NCR Corp. (NCR) (3578) | Verifone Systems, Inc. (PAY) (3578) |
| 24 | Advance Auto Parts, Inc. (AAP) (5531) | Genuine Parts Co. (GPC) (5013) |
| 25 | Arrow Electronics, Inc. (ARW) (5065) | Anixter International, Inc. (AXE) (5063) |
Per Def. 14-a, dropped EP use in 2015.
Appendix C
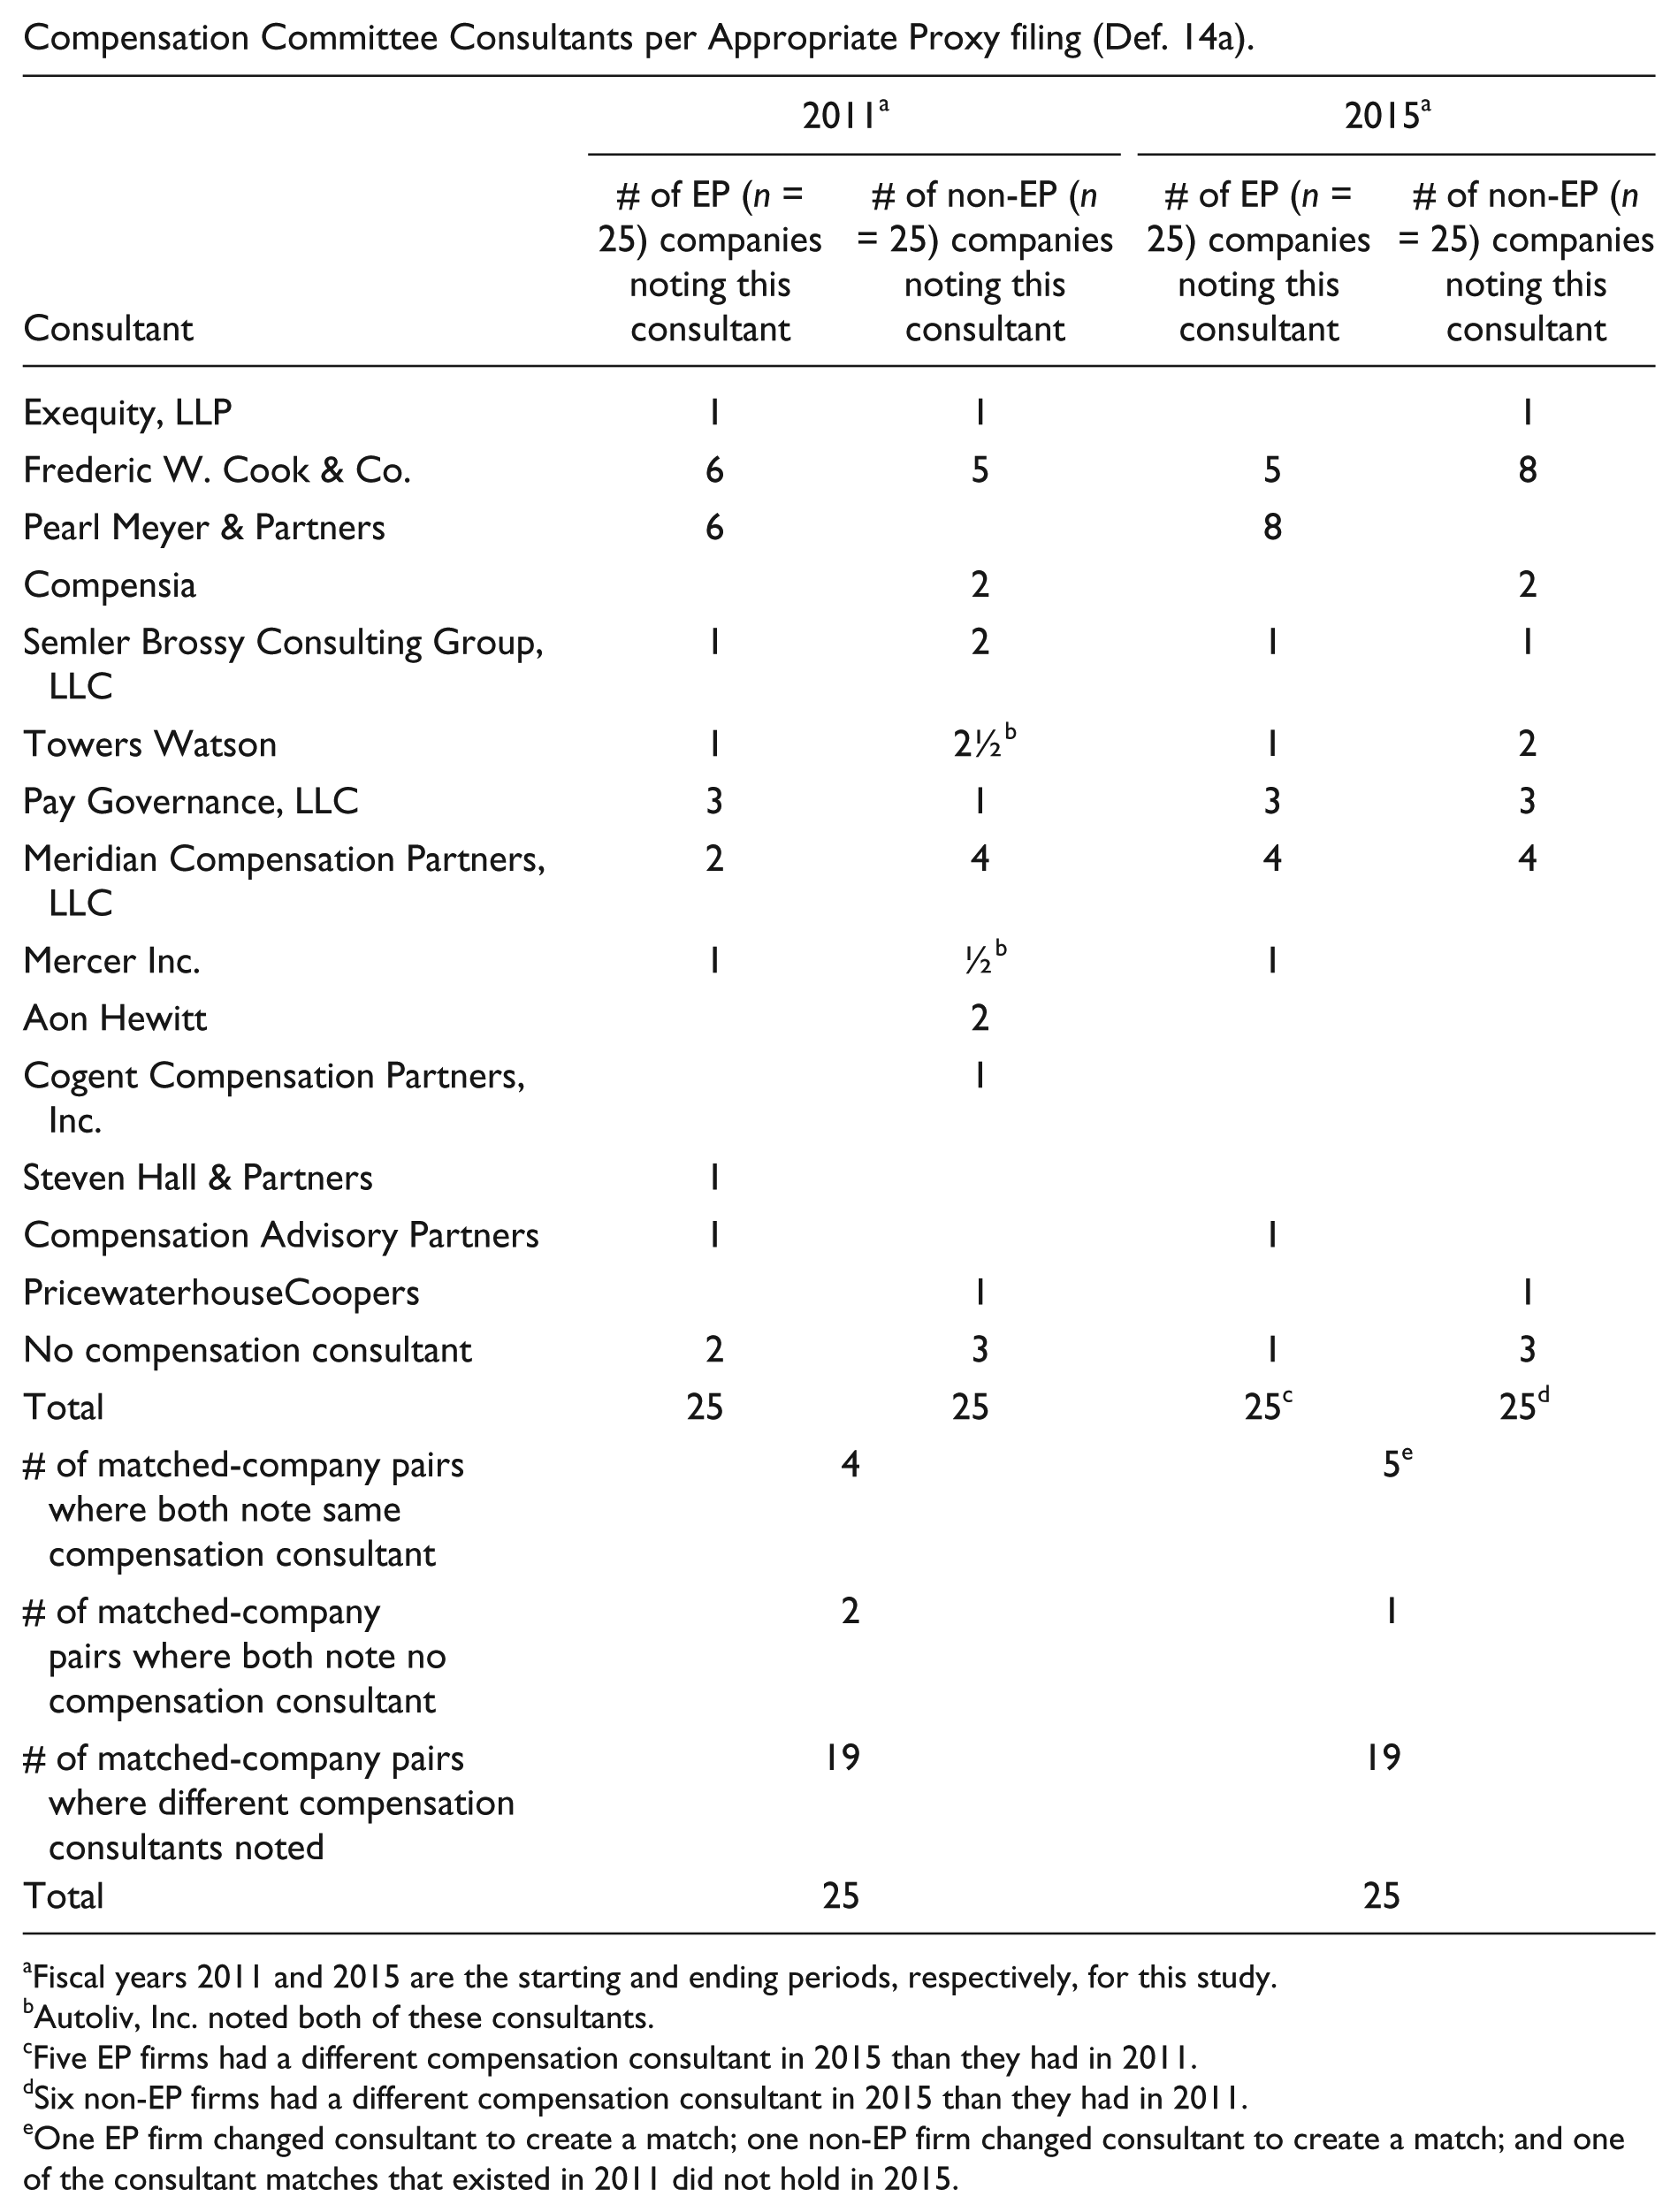
Compensation Committee Consultants per Appropriate Proxy filing (Def. 14a).
| Consultant | 2011
a
|
2015
a
|
||
|---|---|---|---|---|
| # of EP (n = 25) companies noting this consultant | # of non-EP (n = 25) companies noting this consultant | # of EP (n = 25) companies noting this consultant | # of non-EP (n = 25) companies noting this consultant | |
| Exequity, LLP | 1 | 1 | 1 | |
| Frederic W. Cook & Co. | 6 | 5 | 5 | 8 |
| Pearl Meyer & Partners | 6 | 8 | ||
| Compensia | 2 | 2 | ||
| Semler Brossy Consulting Group, LLC | 1 | 2 | 1 | 1 |
| Towers Watson | 1 | 2½ b | 1 | 2 |
| Pay Governance, LLC | 3 | 1 | 3 | 3 |
| Meridian Compensation Partners, LLC | 2 | 4 | 4 | 4 |
| Mercer Inc. | 1 | ½ b | 1 | |
| Aon Hewitt | 2 | |||
| Cogent Compensation Partners, Inc. | 1 | |||
| Steven Hall & Partners | 1 | |||
| Compensation Advisory Partners | 1 | 1 | ||
| PricewaterhouseCoopers | 1 | 1 | ||
| No compensation consultant | 2 | 3 | 1 | 3 |
| Total | 25 | 25 | 25 c | 25 d |
| # of matched-company pairs where both note same compensation consultant | 4 | 5 e | ||
| # of matched-company pairs where both note no compensation consultant | 2 | 1 | ||
| # of matched-company pairs where different compensation consultants noted | 19 | 19 | ||
| Total | 25 | 25 | ||
Fiscal years 2011 and 2015 are the starting and ending periods, respectively, for this study.
Autoliv, Inc. noted both of these consultants.
Five EP firms had a different compensation consultant in 2015 than they had in 2011.
Six non-EP firms had a different compensation consultant in 2015 than they had in 2011.
One EP firm changed consultant to create a match; one non-EP firm changed consultant to create a match; and one of the consultant matches that existed in 2011 did not hold in 2015.
Appendix D
Panel B: Selected Market Indicators at Year End.

| S&P Index a | Dow Jones Industrial Index b | |
|---|---|---|
| December 31, 2010 | 1257.64 | 11,577.51 |
| December 31, 2011 | 1257.60 | 12,217.56 |
| December 31, 2012 | 1426.19 | 13,104.14 |
| December 31, 2013 | 1848.36 | 16,576.66 |
| December 31, 2014 | 2058.90 | 17,823.07 |
| December 31, 2015 | 2043.94 | 17,425.03 |
Source. http://fedprimerate.com/s-and-p-500-history.htm (accessed December 22, 2015, and February 15, 2017).
Source. http://www.fedprimerate.com/dow-jones-industrial-average-history-djia.htm (accessed December 22, 2015, and February 15, 2017).
*
Even though MeadWestvaco initially showed up as an EP company, it was dropped because it merged with Rock-Tenn during the sample period.
Declaration of Conflicting Interests
The authors declared no potential conflicts of interest with respect to the research, authorship, and/or publication of this article.
Funding
The authors disclosed receipt of the following financial support for the research, authorship, and/or publication of this article: Research support from the Darden School, University of Virginia.