



Abstract
Most state and local governments have historically funded their retiree health care benefits on a pay-as-you-go basis. This has resulted in massive amounts of unfunded liability in many states including the five largest states of California, Florida, Illinois, New York and Texas. Recent accounting and reporting rules changes by the Governmental Accounting Standards Board has made these liabilities more visible and has resulted in more attention being paid to this problem. California has adopted a plan to pay off its huge unfunded retiree health benefit liability by 2044. It might serve as an example for other states with similar problems.
Unlike defined-benefit (DB) pension plans, which are largely prefunded, retiree health care and other post-employment benefits (OPEBs) have typically been financed on a pay-as-you-go basis. Rather than prefund them with employer and employee contributions and with earnings on the accumulated invested assets, OPEBs have traditionally been paid for by the state (or local) governments’ General Funds.
OPEBs are mainly retiree health care, vision, dental and prescription drugs. They may also include employer-provided life insurance. Health benefits (broadly defined) are the big one, and the terms “retiree health care” and “OPEBs are often used interchangeably, as they will be in this article.
Recent changes in the accounting rules that apply to OPEBs have made state and local government employers more aware of the magnitude of the problem of unfunded or underfunded non–pension retirement benefits. This article will examine the revised accounting rules, the growth of the OPEB underfunding and the efforts made to address the problem with particular attention to the state of California.
This is a complex topic. Not only are there 50 states but many states have multiple state and local retiree health care plans. Many local jurisdictions contract with state plans to provide public sector retiree health benefits.
The Private Sector
The Employment Retirement Income Security Act of 1974 (Pub. L. 93-406; ERISA) initially required that existing DB pension plans become fully prefunded within 40 years. New plans and improvements in existing plans had 30 years. The funding requirement has been strengthened a number of time over the years. It is now 7 years. ERISA does not require full funding of OPEBs. However, the accounting and disclosure rules of the Financial Accounting Standards Board (FASB) do.
In 1993, the FASB Standard 106 required that private sector employers apply pension-like funding requirements to retiree health plans in their financial statements for all current and future retirees. The FASB has no enforcement powers. However, its standards are incorporated into the Generally Accepted Accounting Practices (GAAP). The Securities Exchange Commission requires that corporations and others be GAAP compliant in their financial reporting.
Private sector employers responded to the new liability reporting rules by curtailing benefits or even eliminating retiree health care plans entirely and thereby shifting costs from the employers to retirees. The percentage of private sector employers (with 200 or more employees) offering any type of retiree health benefits declined from 66% in 1998 to 28% in 2013. 1
Almost all private sector employees become covered by Medicare at age 65. Employer-sponsored retiree health benefits are the secondary payer after Medicare. The reduction or elimination of such benefits falls most heavily upon those who choose to or have to retire before age 65.
The Public Sector
Public sector employers are not covered by ERISA. However, they are subject to the accounting and disclosure rules of the Governmental Accounting Standards Board (GASB), the state and local government equivalent of the FASB. In 2004, the GASB released Statements 43 and 45, effective June 30, 2008. They required recognition of net OPEB obligations on the employer’s balance sheet, 30-year amortization of unfunded benefits and the calculation of actuarial liability and normal cost based on the plan’s funding policy and expected return on assets. Since almost all OPEBs are pay-as-you-go, this meant a significantly lower discount rate of 3% or 4% rather than the 7% or 8% formerly used. The lower the discount rate, the higher the unfunded liability.
GASB 43 and 45 have recently been replaced by GASB 74 and 75, released on June 2, 2015. GASB 74 replaces GASB 43 effective July 1, 2016. GASB 75 replaces GASB 45 effective July 1, 2017.
GASB 75 requires recognition of “net OPEB liability” (NOL) on balance sheets using a blended discount rate derived from a 20-year municipal general obligation bond index if assets are not available and the plan’s long-term expected return on assets to the extent that they are. It also requires the development of annual OPEB expenses based on normal cost and a portion of changes in unfunded actuarial liability due to investment experience, demographic experience and actuarial assumptions amortized over 5 years. The cost of plan changes are to be recognized immediately.
GASB 75 is expected to increase balance sheet liability because the entire NOL (formerly the “unfunded actuarial liability” or UAL) is recognized on the balance sheet. There will also be more volatility because NOL will be largely based on the 20-year general obligation bond rate that will change annually. That rate was 2.85% as of June 30, 2016, and 3.56% in 2017 and 3.95% in 2018. 2
Another feature of GASB 75 is that all OPEB plans will use the same “entry-age normal” (EAN) actuarial cost method, which spreads the cost of future retirement benefits as a level percent of payroll. Under GASB 43 and 45, there were six acceptable cost methods allowed. 3 The most commonly used were the EAN and the “projected unit credit” methods. Requiring a single actuarial cost method will allow better comparisons among different state and local government plans.
The Annual OPEB Expense is used solely for accounting purposes under GASB 75 and is not appropriate for developing the employer’s prefunding contribution due to its volatility. 4 Employers are free to adopt their own OPEB funding policies.
How Big Is the Problem?
It is big. The Pew Charitable Trusts has done yeoman service in reporting on OPEB data of the 50 states since 2010. It reviews the Comprehensive Financial Annual Reports (CFAR) of governmental employers’ health and other OPEB plans and aggregates them for each state. 5 Having a single aggregate plan for each state allows comparisons among the states. The number of such plans ranges from one in Massachusetts to 22 in Arkansas. 6
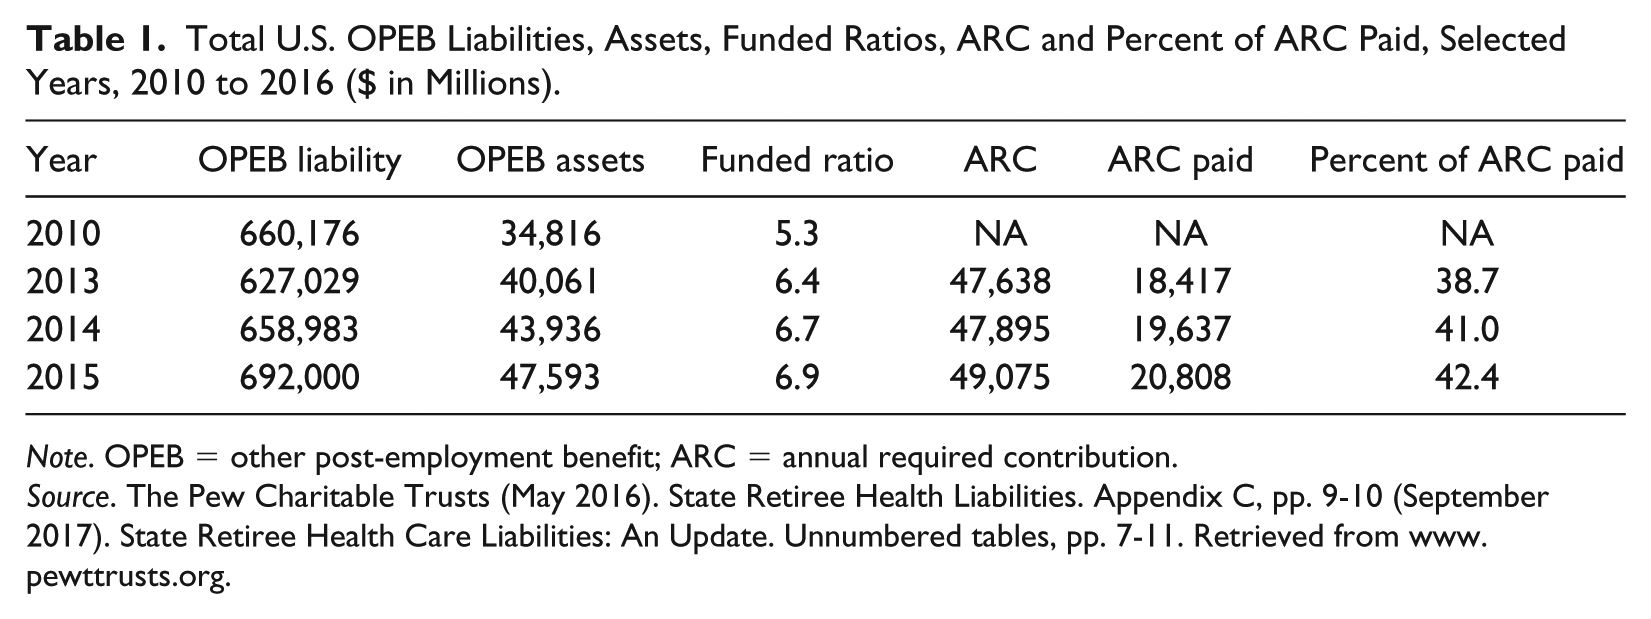
As indicated in Table 1, total OPEB liabilities for the United States in 2015 (the most recent year for which complete aggregated data are available) were $692.0 billion, up from $627.0 billion in 2013. The total assets available in 2015 was $47.6 billion, up from $40.1 billion in 2013. That gives a funded ratio (assets ÷ liabilities) of 6.9%, for 2015, up from 6.4% in 2013 and 5.3% in 2010. That is, the state plans had enough assets accumulated to pay for 6.9% of the promised benefits as of 2015.
Total U.S. OPEB Liabilities, Assets, Funded Ratios, ARC and Percent of ARC Paid, Selected Years, 2010 to 2016 ($ in Millions).
Note. OPEB = other post-employment benefit; ARC = annual required contribution.
Source. The Pew Charitable Trusts (May 2016). State Retiree Health Liabilities. Appendix C, pp. 9-10 (September 2017). State Retiree Health Care Liabilities: An Update. Unnumbered tables, pp. 7-11. Retrieved from www.pewttrusts.org.
In 2015, the Annual Required Contribution (ARC) calculated by plan actuaries, based on various demographic and financial assumptions, was $49.1 billion. It is common for plan sponsors to contribute less than the full ARC. In 2015, actual contributions made were $20.8 billion or just 42.4% of the total ARC. Presumably, when data become available for 2016 and 2017, the percent of ARC paid will look better, given the new GASB accounting rules and the subsequent growth in the financial markets throughout the period. What will happen when (not if) the next recession occurs is another matter.
Note: The ARC has recently been changed to the “actuarial calculated liability” (ACL). That is a better descriptor since the “annual required contribution” was not really required and was seldom fully paid. However, the Pew Charitable Trusts continues to use the ARC and so will I.
The funded ratio (assets ÷ liabilities) is a widely used measure of funding status of DB and OPEB trust funds. As of the end of 2015 nine states had OPEB funded ratios of 30% or more, 10 states had ratios of 10% to 29%, 10 states had ratios from 1.0 to 9.9% and 19 states (including the five largest states) had ratios of one percent or less. There were no data available in two states. 7
Table 2 reports comparable data for the five largest states by size of the Civilian Labor Force (CLF). Combined they represent about 37% of the CLF, which makes them a pretty good sample of the whole. The five largest states have a combined OPEB liability of $315.6 billion, combined assets of $1.4 billion, which gives a funded ratio of 0.3%, pretty close to zero. The five largest states have a total ARC of $20.3 billion of which they contributed a combined amount of $7.5 billion for a percent of ARC paid of 37.2% in 2015.
OPEB Liabilities, Assets and Funded Ratio and ARC and Percent of ARC Paid, Selected Years, 2010 to 2015 ($ in Millions).

Note. OPEB = other post-employment benefit; ARC = annual required contribution.
Source. The Pew Charitable Trusts (May 2016). State Retiree Health Liabilities. Appendix C, pp. 9-10 (September 2017). State Retiree Health Care Liabilities: An Update. Unnumbered tables, pp. 7-11. Retrieved from www.pewttrusts.org.
Table 2 also reports comparable data for each of the five largest states. Among them, California has an OPEB liability at just under $94.0 billion, the most of any state. Oklahoma has the lowest at $5 million (not shown).
Two of the big-five states, Florida and New York, had no OPEB assets (and consequently a 0.0% funded ratio) throughout the 2013 to 2015 period. Illinois had −$106 (and therefore a −0.2% funded ratio) in 2014 and 2015. I assume this means that Illinois’ OPEB fund owe money to other entities or have bonded indebtedness.
From a Different Perspective
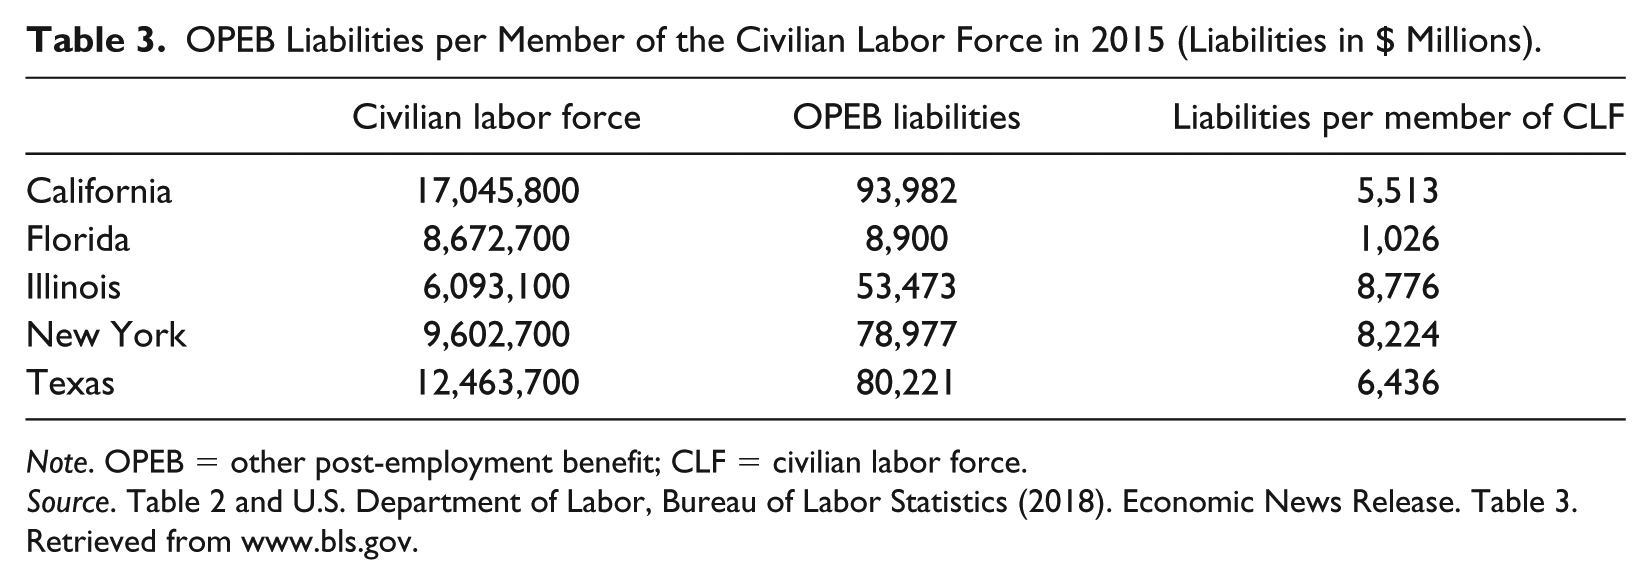
It is all relative. California has the largest unfunded OPEB liabilities. However, it also has the largest population and CLF. Table 3 reports the unfunded OPEB liability per member of the CLF (for March 2018) for the five largest states for 2015. Note that in relative terms, California with $5,513 was the second lowest of the big five, after Florida with $1,026. Illinois was the highest with $8,776 per member of the CLF. Illinois also has very large unfunded pension liabilities (not shown).
OPEB Liabilities per Member of the Civilian Labor Force in 2015 (Liabilities in $ Millions).
Note. OPEB = other post-employment benefit; CLF = civilian labor force.
Source. Table 2 and U.S. Department of Labor, Bureau of Labor Statistics (2018). Economic News Release. Table 3. Retrieved from www.bls.gov.
Illinois is not in the worst shape with regard to OPEB liabilities. That distinction goes to New Jersey. It had $84.3 billion in unfunded OPEB liabilities and a CLF of 4.2 million. That amounts to a debt of $20,168 per member of the state’s CLF.
The California Experience
California started its employee and retiree health benefit program in 1961 with the passage of the Public Employees’ Medical and Hospital Care Act (PEMHCA). In 1967, PEMHCA was amended to allow local government agencies to contract with the California Public Employees’ Retirement System (CalPERS) for health benefits. In 1981, a dental plan was added. 8
In 1974, employer contributions were changed from a dollar amount to a percentage of premiums. At that time, the state contribution to retiree health care benefits was based on 80% of the cost for active employees and retirees plus 60% of the cost for dependent coverage (the 80%/60% formula). In 1976, state contributions for active employees and retirees was increased to 85%. In 1978, what is referred to as the 100%/90% formula was adopted for State of California and California State University (CSU) employees and retirees. It was based on the weighted average of premiums the four health plans with the largest enrollment in the previous year. 9
In California, the underfunded liabilities of the two huge statewide pension plans, CalPERS and the California State Teachers’ Retirement System (CalSTRS), have been under attack since the Great Recession of 2008-2009. As of 2016, CalPERS has a pension funded ratio of 68.0%. 10 That of CalSTRS is 64.0%. 11
Less attention has been paid to the even larger amount of unfunded liability associates with California’s retiree health benefits or OPEBs. This was due in part to the fact that data on retiree health benefits were not as easy to find and compare as are pension data. Until GASB 43/45 (effective 2008), OPEB data were reported in the footnotes and the “required supplementary information” (RSI) of financial reports of state and local governments.
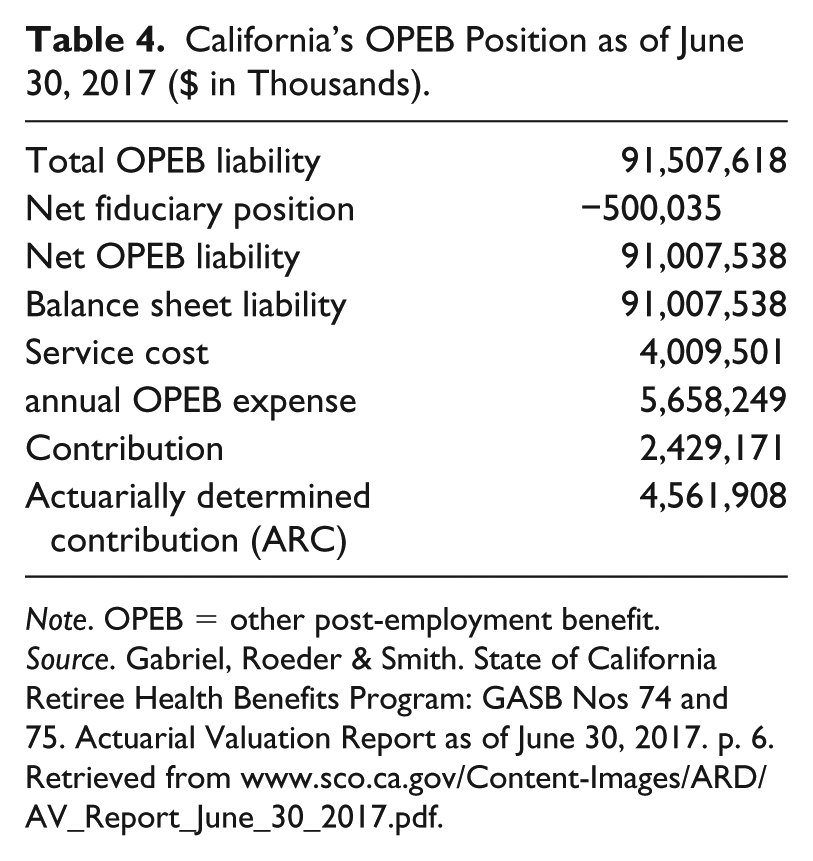
With the advent of GASB 74/75 (effective 2016 and 2017, respectively) that changed. Under the new GASB accounting and disclosure rules, the information is readily available to anyone interested, and it would be shocking. As indicated in Table 4, under the new accounting rules, California’s net OPEB unfunded liability as of June 30, 2017, was $91.5 billion and the assets or “net fiduciary position” of just over $500 million. That gives a funded ratio of 0.55% (author’s calculation).
California’s OPEB Position as of June 30, 2017 ($ in Thousands).
Note. OPEB = other post-employment benefit.
Source. Gabriel, Roeder & Smith. State of California Retiree Health Benefits Program: GASB Nos 74 and 75. Actuarial Valuation Report as of June 30, 2017. p. 6. Retrieved from www.sco.ca.gov/Content-Images/ARD/AV_Report_June_30_2017.pdf.
How fast is California’s unfunded OPEB liability growing? In 2001, it was $458 million and equal to 0.6% of the state’s General Fund. It was expected to grow to $2 billion and 1.7% of the General Fund by 2017-2018. 12
Governor Brown’s Proposal
When announcing his proposed retiree health care reform in 2015, Governor Jerry Brown referenced a chart showing that, if no action is taken, the unfunded OPEB debt will be $300 billion by 2047-2048. Under his administration’s prefunding plan, it would be zero by 2044-2045. 13
The plan requires active employees to pay for half of the normal cost of retiree health benefits earned each year. The state will continue to fund benefits for current retirees and a portion of unfunded OPEBs on a pay-as-you-go basis. Employer and employee contributions would accumulate in the already existing California Employers Retirement Benefit Trust (CERBT) fund administered by CalPERS.
The CERBT does not separately account the funds contributed for individual employees/retirees or their dependents. All contributions made by employers and employees are to be held as assets of the state or local government employers. Contributions made by employees who depart before retirement may not be withdrawn. That means that some former employees will have contributed to a retiree health plan from which they will not benefit. That could become a problem down the road.
Before 1989, an employee only had to work for the state for 5 years to be eligible for retiree health benefits for life. This was foolishly generous. For employees hired after January 1, 1989, the eligibility requirement was changed to 50% vested after 10 years of service, increasing by 5% per year until fully vested after 20 years. The new requirement is 50% vested after 15 years and 100% vested after 25 years.
Another provision of plan is to get rid of the “anomaly” of State of California and CSU retirees getting a more generous health-benefit formula after they retire than they had before they retired. When in 1974, the benefit formula was change from a dollar amount to a percent of premium the benefit formula was set at 100% for the employee/retiree and 90% for one dependent. In 1991, the state moved away from the “100%/90% formula” for active employees to one paying 80% or 85% (depending on the collective bargaining agreement) for individual or family coverage. However, the 100%/90% formula was retained for State of California and CSU retirees.
Implementation
The California Employers’ Retirement Benefit Trust received its first contributions in 2007. Effective 2008 all California public agencies were allowed to join. By March 31, 2018, 544 public agencies have contributed $7.9 billion to the CERBT management. 14 That amounts to a funded ratio of 8.6%, up from 0.55% in 2017 (author’s calculations). The state of California was not yet listed as one of the contributors to the CERBT.
Participating agencies must submit an OPEB cost actuarial report and a CERBT participation agreement. Employer contributions to the plan are voluntary. Employers are not required to fully fund the amount shown in their actuarial valuation.
Each participating public employer owns a proportionate share (percentage) of the portfolio based on the amount of its contributions. The pooled assets are invested by CalPERS. The State Street Bank serves as custodian of the CERBT and Northeast Retirement Services serves as record keeper. 15
Implementation of the prefunding arrangement is mainly through collective bargaining. In California, public employees are highly unionized (about 55%). In the recent round of bargaining, Governor Brown made prefunding of OPEBs a key priority establishing the following conditions: employee contributions must be mandatory, the rate of contributions within a bargaining unit must be uniform (though rates may vary among bargaining units) and no cash-outs of employee mandatory contributions are allowed. 16
CERBT Investment Strategies
Central to the success of the CERBT and the OPEB prefunding plan is the effective investing of the accumulated assets in the public-employer accounts. Contracting public employers have three investment strategies from which to choose that reflect three levels of risk preference.
As indicated in Table 5, Strategy 1 has an investment portfolio with 57% global equities, 27% fixed income and 5% Treasury inflation-protected securities (TIPS). Strategy 2 involves 40% equities, 39% fixed income and 10% TIPS. And Strategy 3 has 24% equities, 39% fixed income and 26% TIPS. All three strategies have the same percentages of Real Estate Investment Trusts (REITS) and commodities, 8% and 3%, respectively.
CERBT Investment Strategies and Past Performance as of March 31, 2018 (in Percentage).

Note. CERBT = California Employers’ Retiree Benefit Trust.
Source. CalPERS. California Employers’ Retiree Benefit Trust (CERBT), March 31, 2018. CERBT Strategies 1, 2 and 3 (Separate documents). Retrieved from www.calpersca.gov.
Table 5 also reports the anticipated net rates of return for years 1, 3 and 5 for the three investment strategies as of March 31, 2018. As one would expect, given the recent performance of the equity markets, the high-risk Strategy 1 has done best, so far.
Strategy 1 has been chosen by the state for State of California and CSU employees. It is expected to earn about 7.28% per year over the long term. 17 There is no information available yet on the investment strategies chosen by the 544 other participating public employers. It will be interesting to see how many of them follow the state’s lead of opting for Strategy 1 or opt for the more conservative and less volatile Strategies 2 or 3.
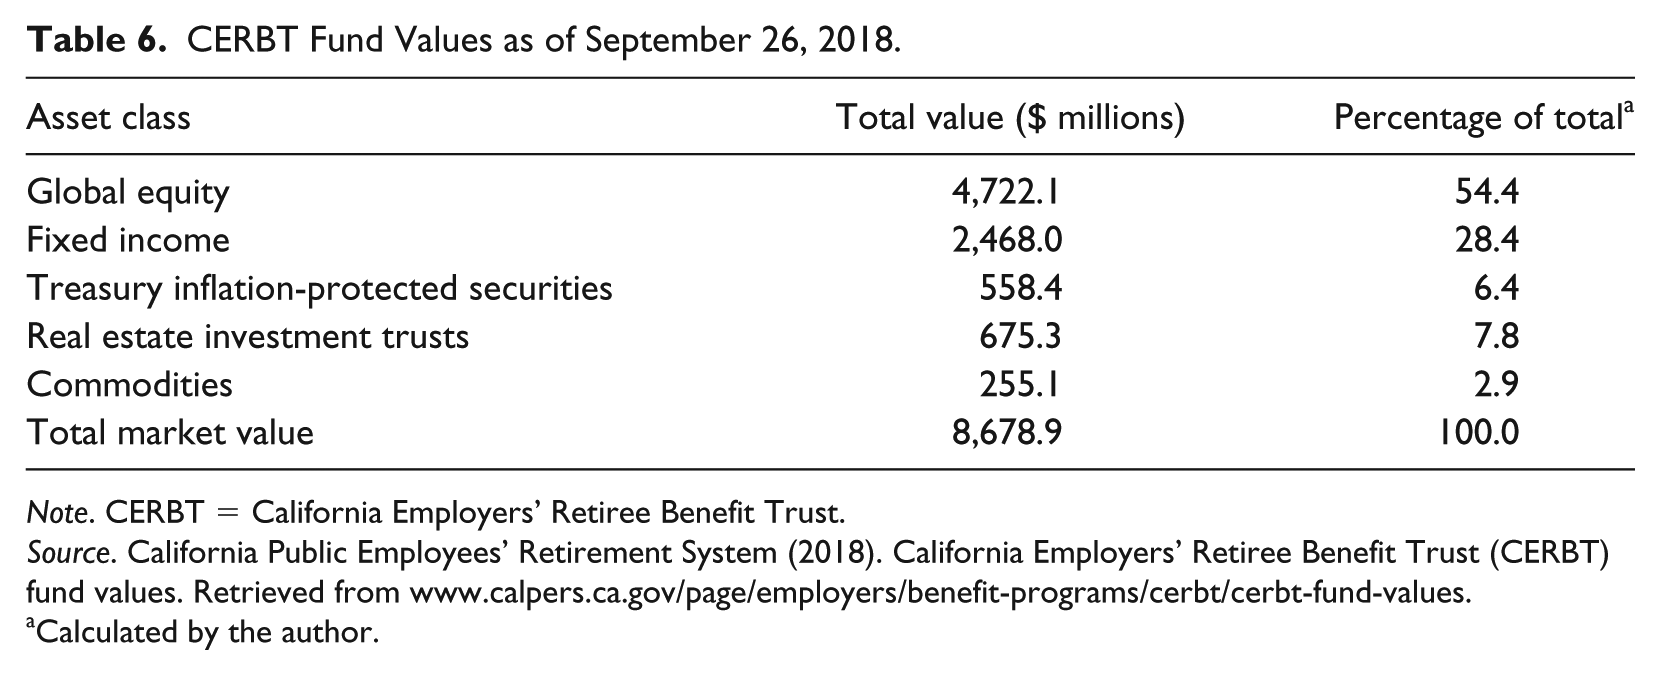
As of September 26, 2018, the CERBT fund had a market value of $8.7 billion. Table 6 reports the dollar value and percent breakdowns of the five asset classes (investment categories). It most closely reflects Strategy 1.
CERBT Fund Values as of September 26, 2018.
Note. CERBT = California Employers’ Retiree Benefit Trust.
Source. California Public Employees’ Retirement System (2018). California Employers’ Retiree Benefit Trust (CERBT) fund values. Retrieved from www.calpers.ca.gov/page/employers/benefit-programs/cerbt/cerbt-fund-values.
Calculated by the author.
Conclusion
California has adopted a pathway to gradually eliminate its retiree health care unfunded liability by 2044. Its main elements are increased contributions by active employees, continued State funding of benefits for retired former employees and employer choice of one of three rather optimistic investment strategies. The plan appears to be well thought out.
Of course, the program has just begun and any definitive assessment would be premature. Thirty years is a long time. The increased employee contributions are likely a given. The only qualification on that is that departed formerly employees may successfully sue to have their contributions returned (with interest). The anticipated returns on invested assets in the CERBT are not unreasonable. Experts project CalPERS’ return on invested assets to average 6.2% over the next decade. 18 However, state and local government employer contributions are less certain. Several recessions will occur over the next 30 years during which government revenues will decline and costs increase.
However, even if the projections are not accurate, California has adopted a promising plan to eliminate its retiree health benefits underfunding. Other states with large unfunded OPEB liabilities, including the four other big-five states, would do well to consider doing something similar.
Footnotes
Declaration of Conflicting Interests
The author declared no potential conflicts of interest with respect to the research, authorship, and/or publication of this article.
Funding
The author received no financial support for the research, authorship, and/or publication of this article.
Notes
Author Biography
John G. Kilgour, PhD, is a professor emeritus in the Department of Management at California State University, East Bay. He is a longtime and frequent contributor to Compensation & Benefits Review.