



Abstract
Increasing compensation reduces turnover in other industries, but it is unclear if increasing tip percentages will reduce turnover among tipped service workers. This question was examined using a panel data set on the charge tips of restaurant servers over time from POS systems. The results indicate that tip percentages were generally consistent across servers’ running workday counts (in other words, across growing levels of server experience), but were slightly higher overall for those servers who ultimately stayed in the job for more workdays. These findings provide more compelling evidence of a potential tip percentage effect on server tenure than is provided by existing cross-sectional correlational data sets. However, the effect of servers’ average tip percentages on their tenure was relatively small—accounting for only 5% of the variance in server tenure, as compared to 14% accounted for by servers’ average dollar tips per day and 33% accounted for by servers’ average number of daily checks. Compensation is important, but when it comes to restaurant waitstaff turnover, other things may matter more.
Introduction
Hospitality and tourism workers often depend on voluntary gifts of money (called “tips”) from their customers as a major portion of their work compensation. Since job tenure has been linked to compensation in other industries (see Sarkar, 2018), Lynn (1996, 2006) has argued that hospitality managers should be able to reduce turnover at their establishments by training their employees to engage in behaviors known to increase the tip percentages customers leave. However, tips differ from other forms of work compensation in ways that may undermine the former’s effects on employee turnover. In particular, while wages and salaries come from employers, tips come from customers. Furthermore, unlike most wages or salaries, tips are voluntary payments that are supposed to vary with the employee’s performance. In fact, tipped workers believe that they can affect the tip amounts their customers give (Lynn, 2017a). These considerations suggest that workers may feel less tied to high tip jobs than to high wage/salary jobs, because they believe that they can take their high tip earning potential to other establishments. Thus, previous research in other industries provides little confidence about the effects of tip income on employee job tenure. Ultimately, this is an empirical question to be addressed by tipping specific research.
Unfortunately, existing research on the effects of tipping on job tenure is less than dispositive. Some studies have found that servers’ claimed tip averages are positively associated with their tenure in the profession (Brewster, 2015; Lynn, Kwortnik, and Sturman, 2011) and are negatively associated with servers’ thoughts about quitting their current job (Lynn, 2003). However, other studies have found that higher restaurant-wide charge tip percentages are reliably associated with lower turnover among units of a restaurant chain only among restaurants with low sales (Lynn, 2002; 2003) and still other studies have found no reliable relationships of tip percentages with either intended (Lynn, 2017b) or actual (Kim, Nemeschansky and Brandt, 2017) tenure in the workers’ current tipped jobs.
Adding to the uncertainty provided by this mixed evidence are a number of problems with the studies. First, the self-report measures of typical tips used in some studies are likely to be inaccurate or at least imprecise. Second, the effects of tips on tenure within the profession that was examined in some studies may not generalize to the effects of tips on tenure in a specific job, because servers may make internal rather than external attributions for their tip incomes as explained earlier. Third, cross-sectional correlations between tips and tenure (or turnover) could easily be attributed to higher server tenure (or lower server turnover) causing better tips, rather than bigger tips increasing tenure (or reducing turnover). Such reverse causality is plausible because: (i) servers may learn over time how to elicit larger tips—through better service or in other ways, (ii) managers may give better (higher tip-potential) shifts and/or dining parties to servers with greater experience/tenure, and/or (iii) servers may become more familiar over time to regular customers, who may tip familiar servers more than unfamiliar ones. Indeed, these reverse causal processes are interesting in their own right, because they would suggest that managers can truthfully advise new servers who are dissatisfied with their current tip percentages to be patient and that their tips will grow over time.
Many of the issues plaguing existing research on tip income effects on server tenure/turnover could be addressed with panel data on the charge tips of servers over time from POS systems. In particular, the direction of causality in the relationship between tips and tenure can be assessed with panel data by comparing the effects of running counts of days worked with the effects of total days worked. Effects do not precede causes, so if tenure or experience increases tips, then tips should be more strongly related to the experience of the server on the day the tips were given (aka, to running count of days worked) than to the future level of experience the server will eventually attain (aka, to total days worked). However, if tips increase retention, then the reverse should be true. Accordingly, the current study analyzes such panel data in the hopes of providing stronger evidence about the effects of tip percentages on servers’ job tenure.
Method
Upserve provided data on 296,477 checks written between January 1, 2017 and January 2, 2018 at seven casual-dining restaurants in California. The data about each check provided by Upscale included the following: • Random store id, • Random employee id • Check open date and time, • Check close date and time, • Number of diners on the check, • Net bill size (without taxes; 6288 observations with net bill sizes <$5 and >$500 and/or with more than 10 diners and were recoded as missing values to avoid problems with outliers caused by (i) large parties with multiple servers but one check with only one server’s id, (ii) credit card limits necessitating multiple checks where the bill size and tip charges were divided in unknown ways, (iii) customers requesting separate checks where the bill size and tip charges were split in unknown ways, and (iv) other unusual circumstances), • Total charge tip amount left on the ticket (78,161 values of zero could reflect cash, or other non-credit card, payment of the bill and/or tip, so they were recoded as missing values).
These data were used to calculate the following variables: • Percent tip (tip amount as a percentage of the net bill size) • Trimmed percent tip (percent tip after dropping 4484 extreme values coming from approximately 1% of each tail of the distribution—those <7% and those >50%), • Normal percent tip (normal score of percent tip using Blom’s formula), • Cleaned dollar tip (total net tip if percent tip ≥7% and ≤50%), • Server first workday (the day of the study period the server first works – 1 = first, 2 = second, etc…; this variable was used to control for the fact that servers hired later in the year had less opportunity than others to accumulate total workdays during the study period) • Server day count (aka, server job experience: whether the check was written on the server’s first, second, third, etc… workday), • Total server workdays (aka server tenure: total number of days the server who wrote the check worked during the study period), • Server total dollar tips (sum of server’s cleaned dollar tips for the study period), • Server average dollar tips per day (each server’s total dollar tips divided by total workdays), • Server sales for the day (sum of server’s net bill sizes for the day the check was written on), • Total server sales (sum of server’s net bill sizes for the study period), • Server average sales per day (each server’s total sales divided by total workdays), • Server number of checks for the day (number of checks written by the server during the day the check was written), • Total server number of checks (number of checks written by the server during the study period), • Server average number of checks per day (each server’s total number of checks divided by total workdays), • Server average trimmed percent tip (the mean by server of trimmed percent tip).
All variables involving sales or the number of checks were based on the cleaned net bill size measure or on the number of those cleaned bill sizes. The final data set included 216,700 transactions with non-zero tip information and involving a total of 285 servers. However, missing values for some variables created during data cleaning to eliminate outlying cases mean that the sample sizes vary across the analyses reported below.
Results and Discussion
Descriptive statistics for the variables in the dataset.
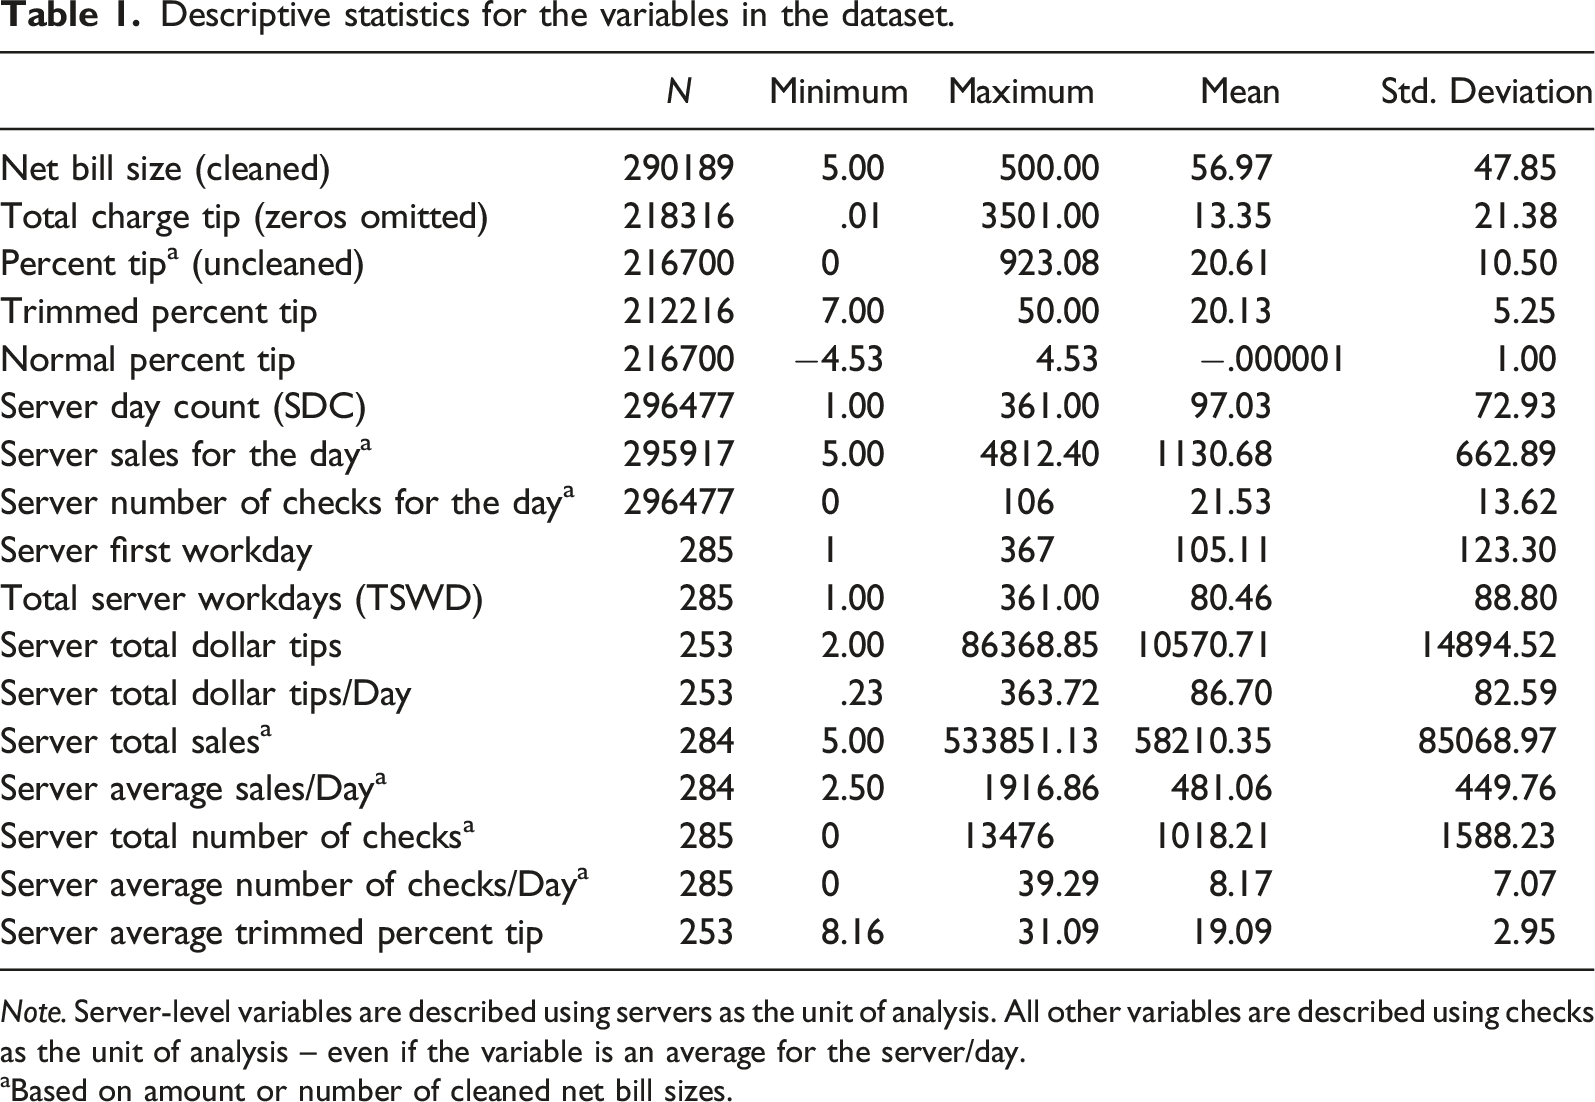
Note. Server-level variables are described using servers as the unit of analysis. All other variables are described using checks as the unit of analysis – even if the variable is an average for the server/day.
aBased on amount or number of cleaned net bill sizes.
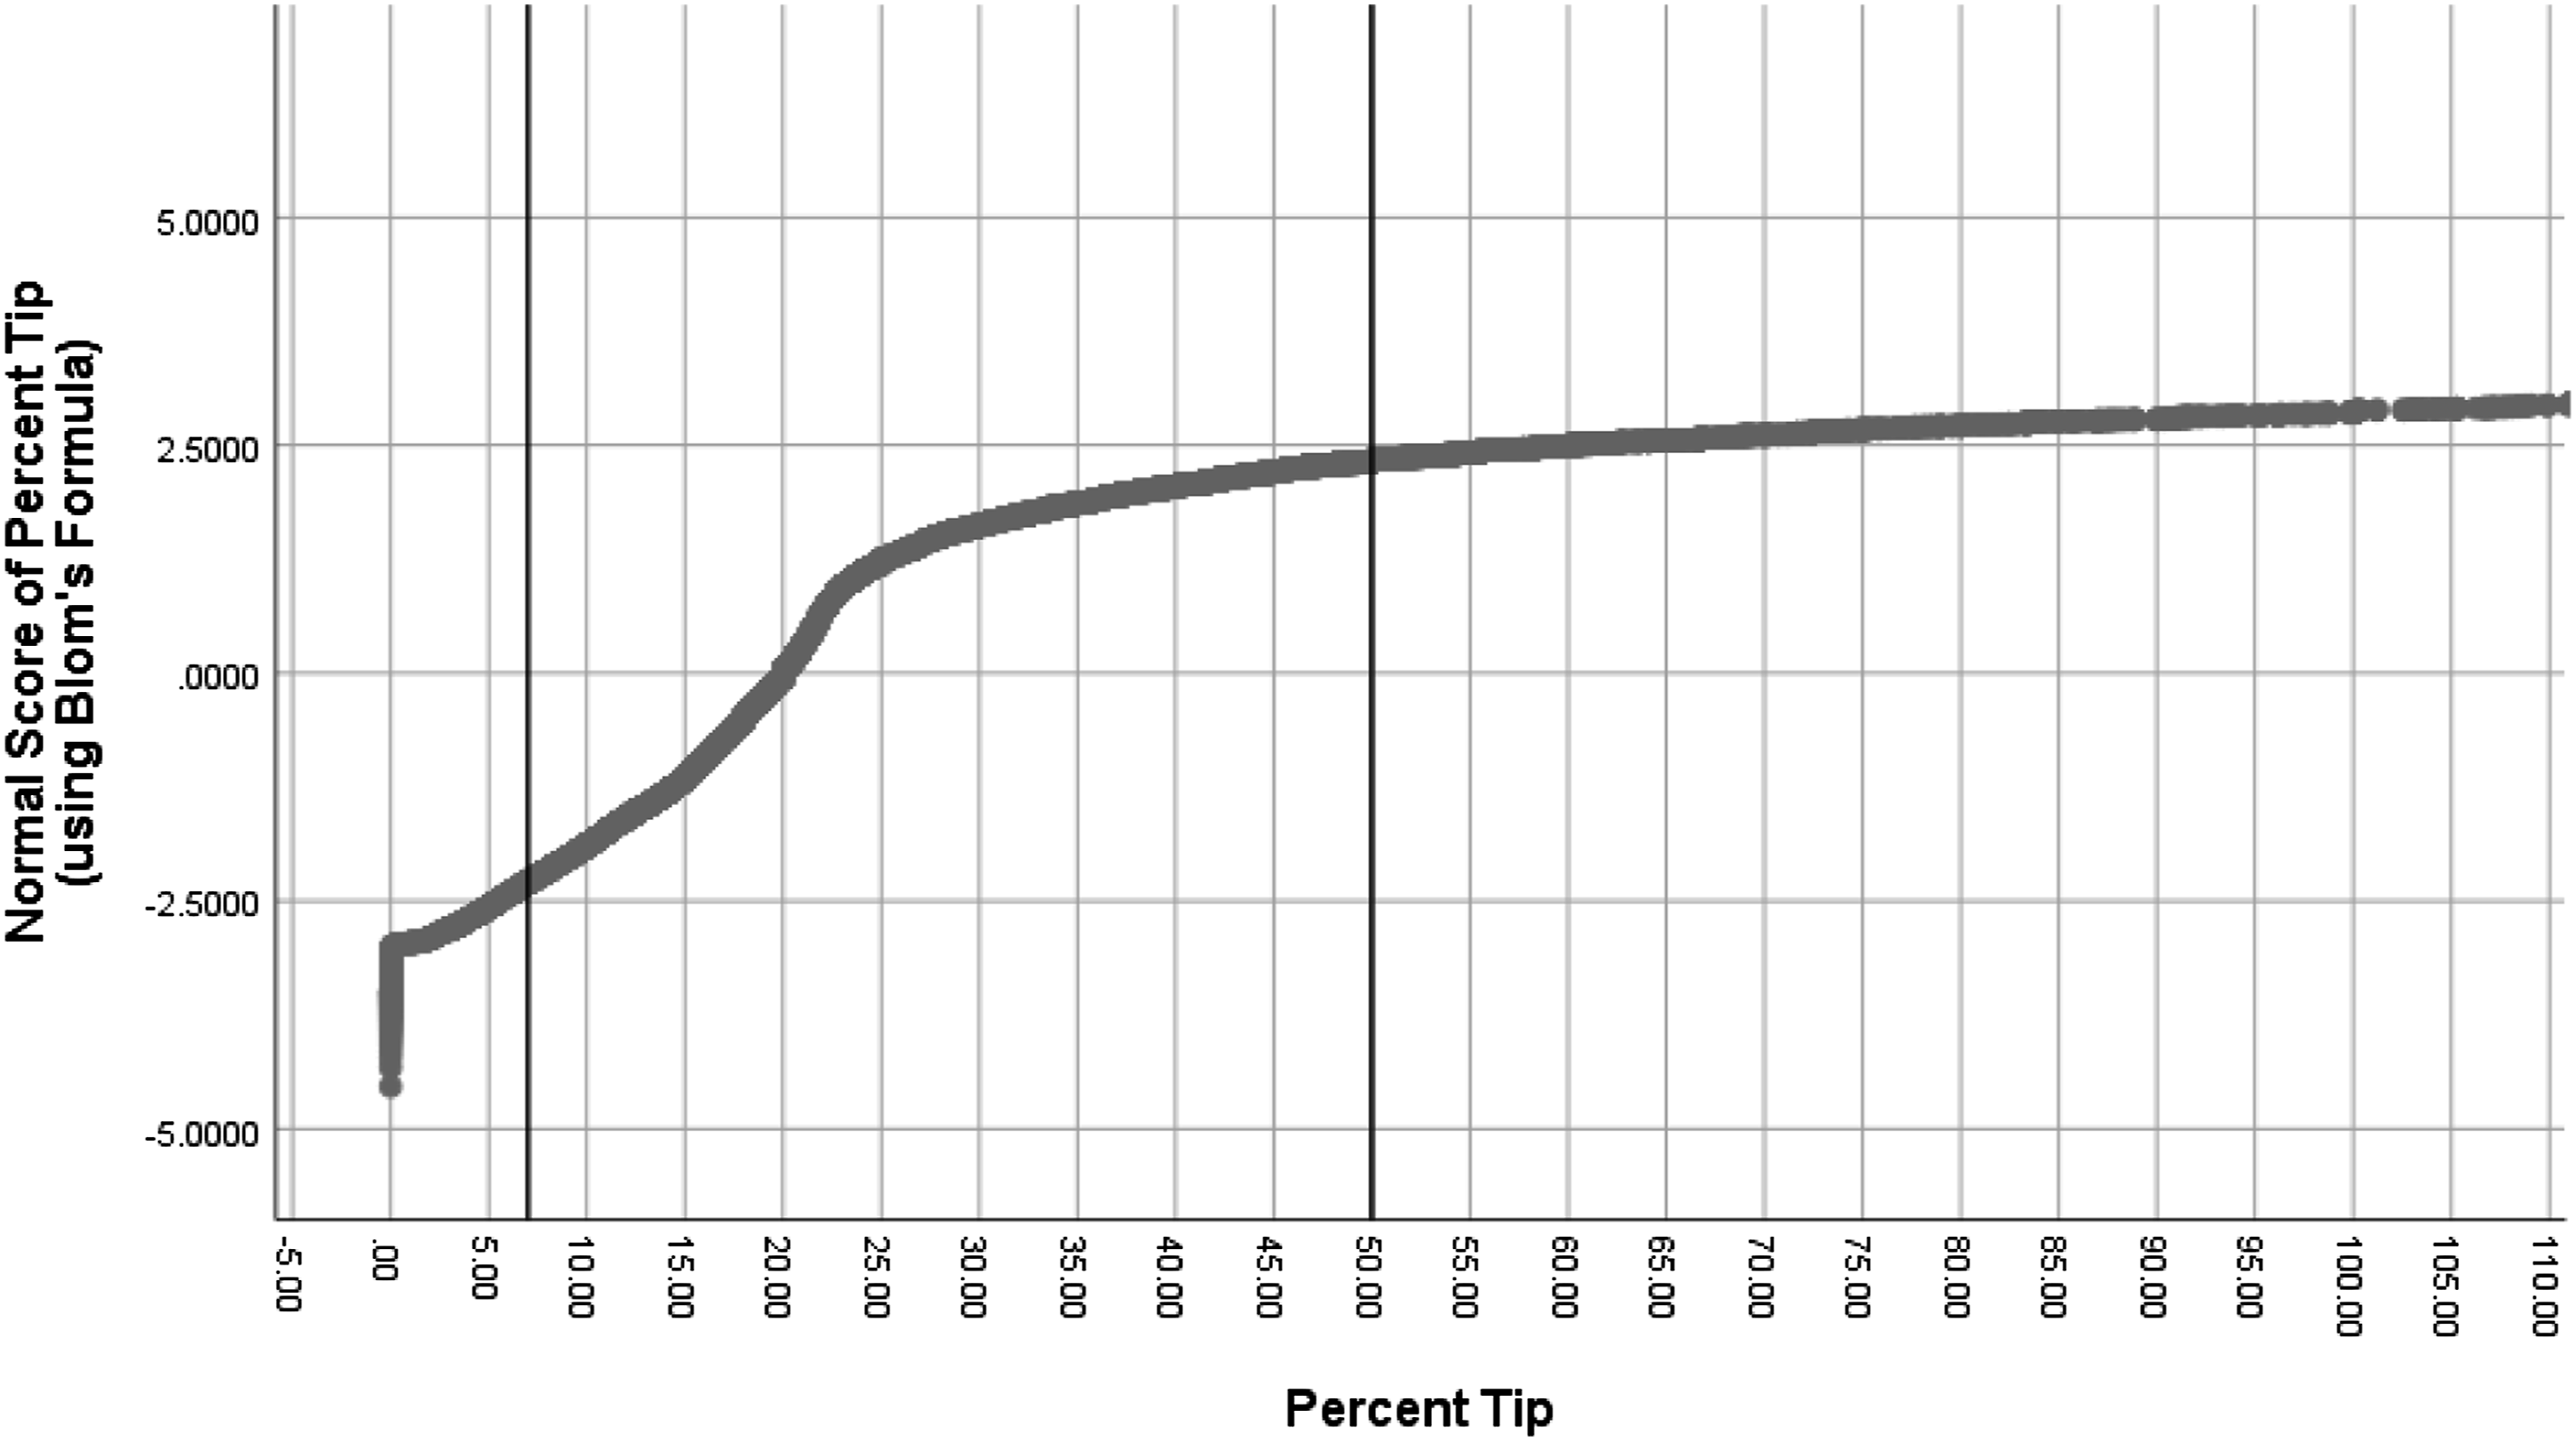
Outliers in percent tip were addressed by (i) trimming values outside the reference lines at 7% and 50% - with the resulting measure called “trimmed percent tip,” and (ii) transforming all the data as shown to bring outliers in toward the center while preserving their ordinal positions - with the resulting measure called “normal percent tip.” Note that the graph’s x-axis was truncated at $105 to enhance readability, but the relationship between normal percent tip and percent tip continued along the shown trajectory.
Correlations among selected server-level variables.
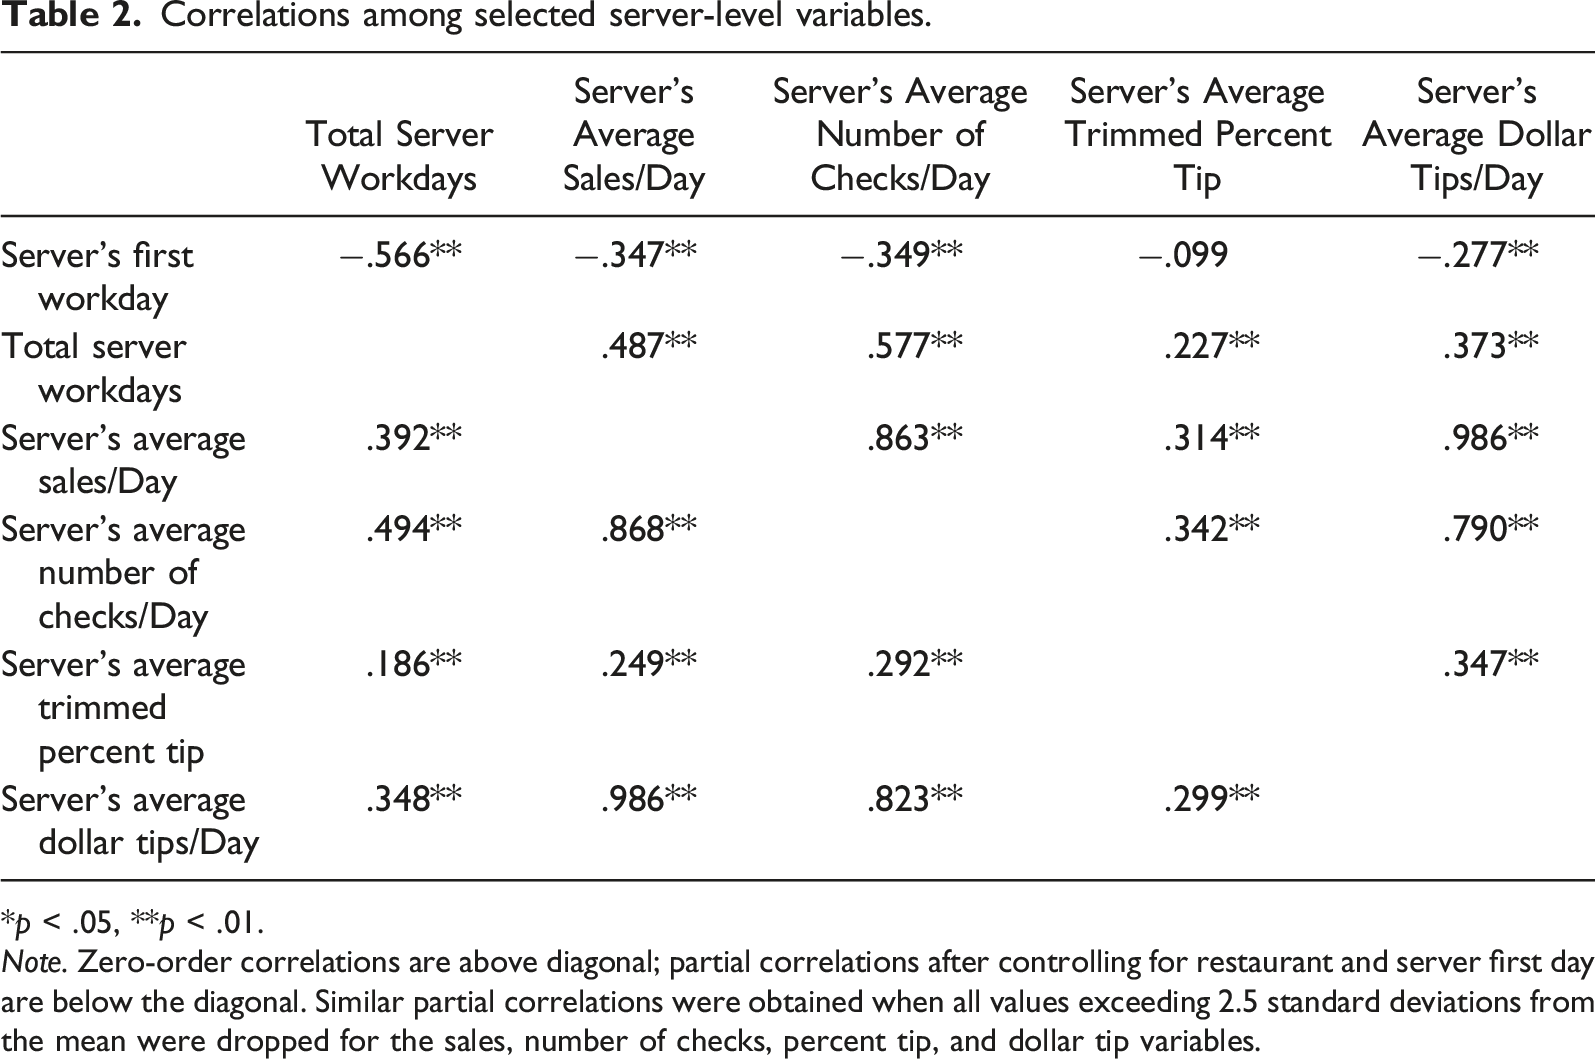
*p < .05, **p < .01.
Note. Zero-order correlations are above diagonal; partial correlations after controlling for restaurant and server first day are below the diagonal. Similar partial correlations were obtained when all values exceeding 2.5 standard deviations from the mean were dropped for the sales, number of checks, percent tip, and dollar tip variables.

Servers working less than 200 days are more likely to have low than high average tip percentages while those working more than 200 days are more likely to have high than low average tip percentages. Note that the means of trim percent tip becomes less extreme as the number of server workdays and, hence, number of tips included in the mean increase.
Coefficients (and robust standard errors clustered within server) from regressions of total server workdays on check-level tipping as well as server’s daily sales and daily number of checks.
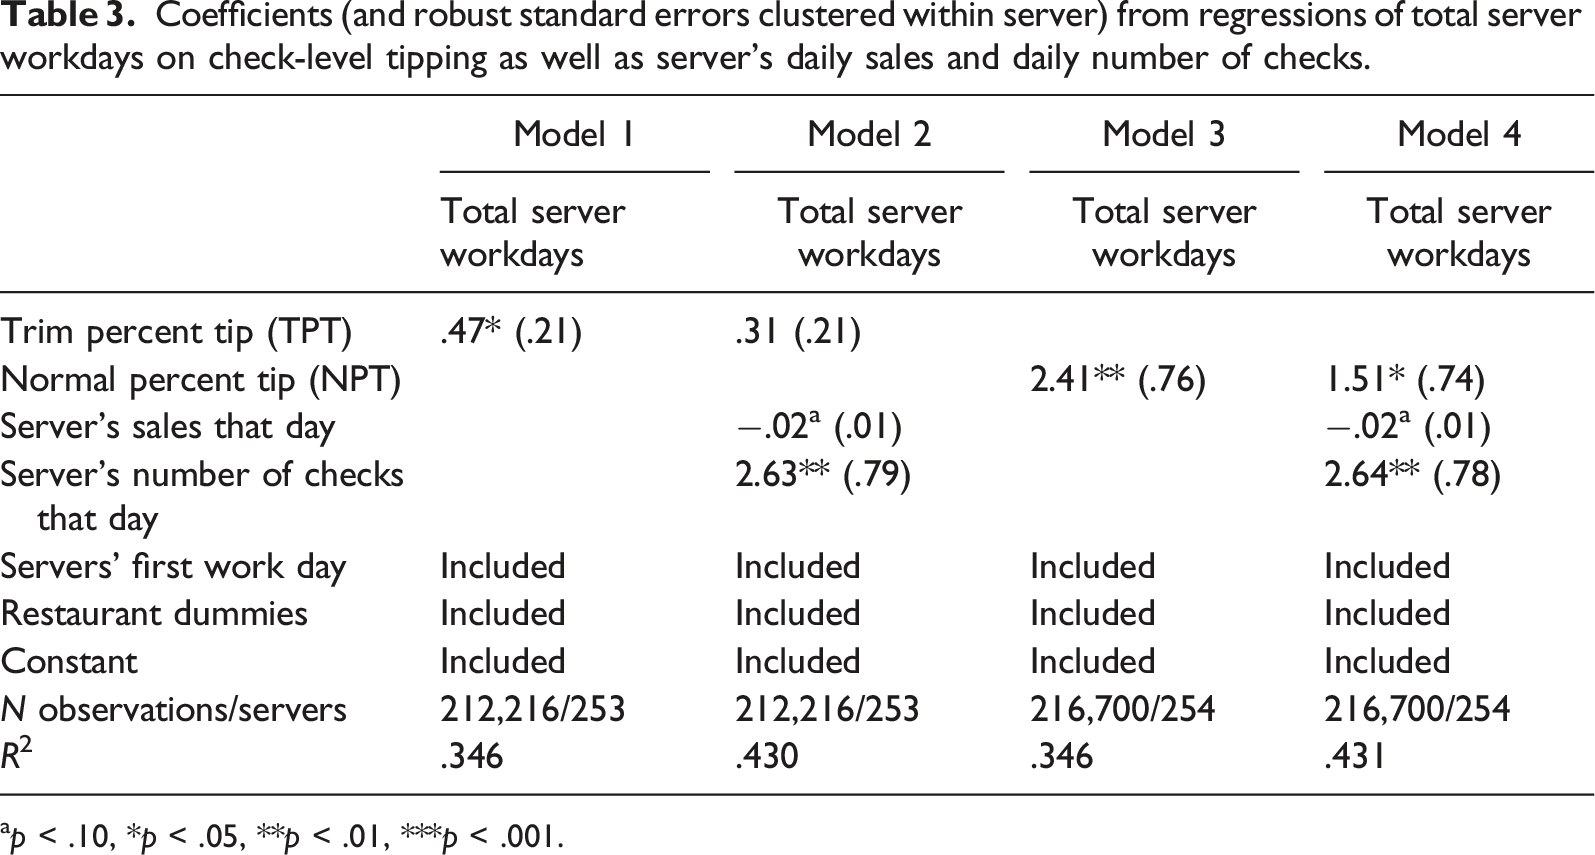
ap < .10, *p < .05, **p < .01, ***p < .001.
Coefficients (and robust standard errors clustered within server) from regressions of tipping measures on servers’ running workday counts and total server workdays.
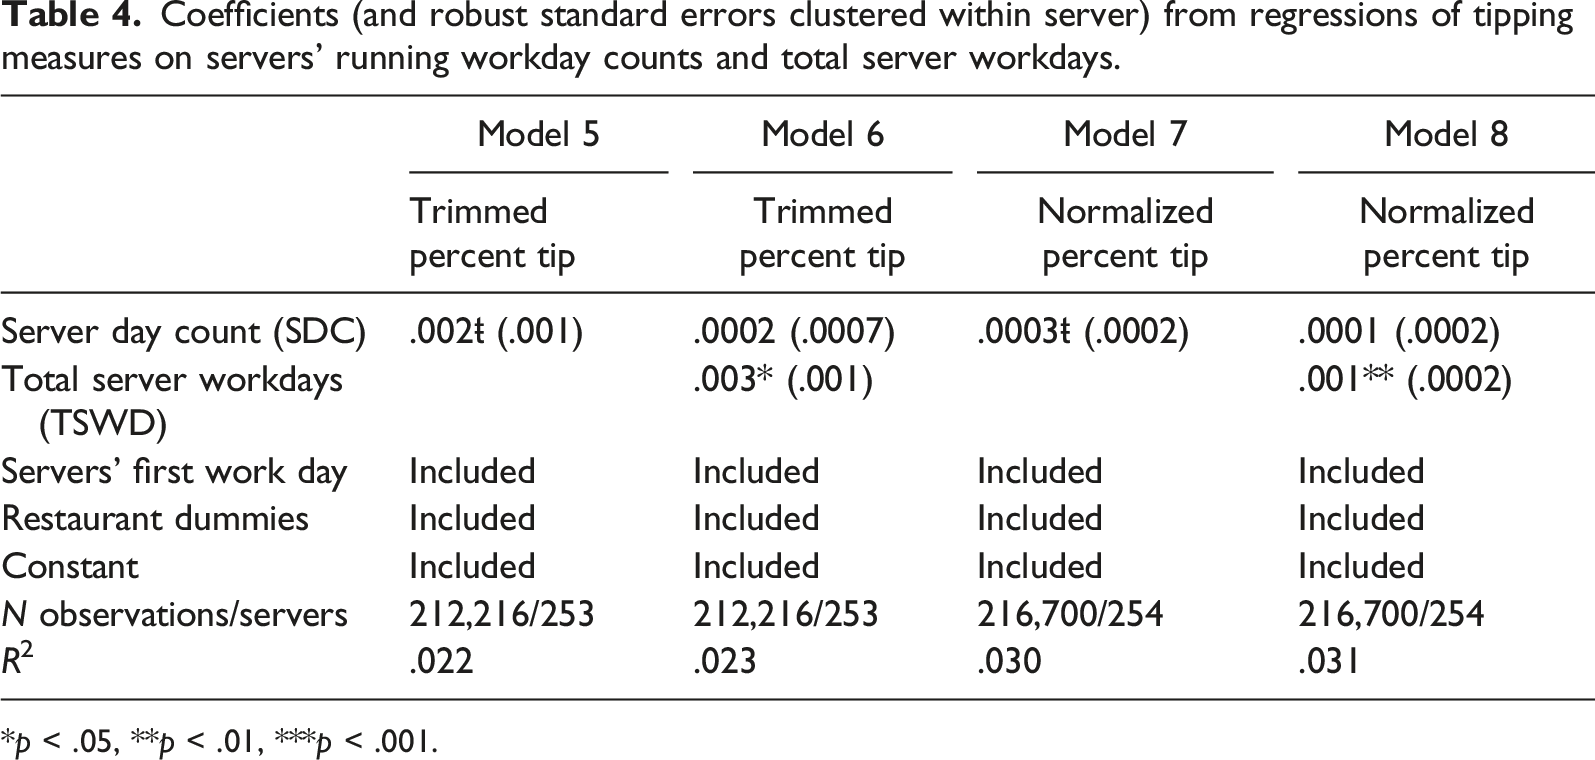
*p < .05, **p < .01, ***p < .001.
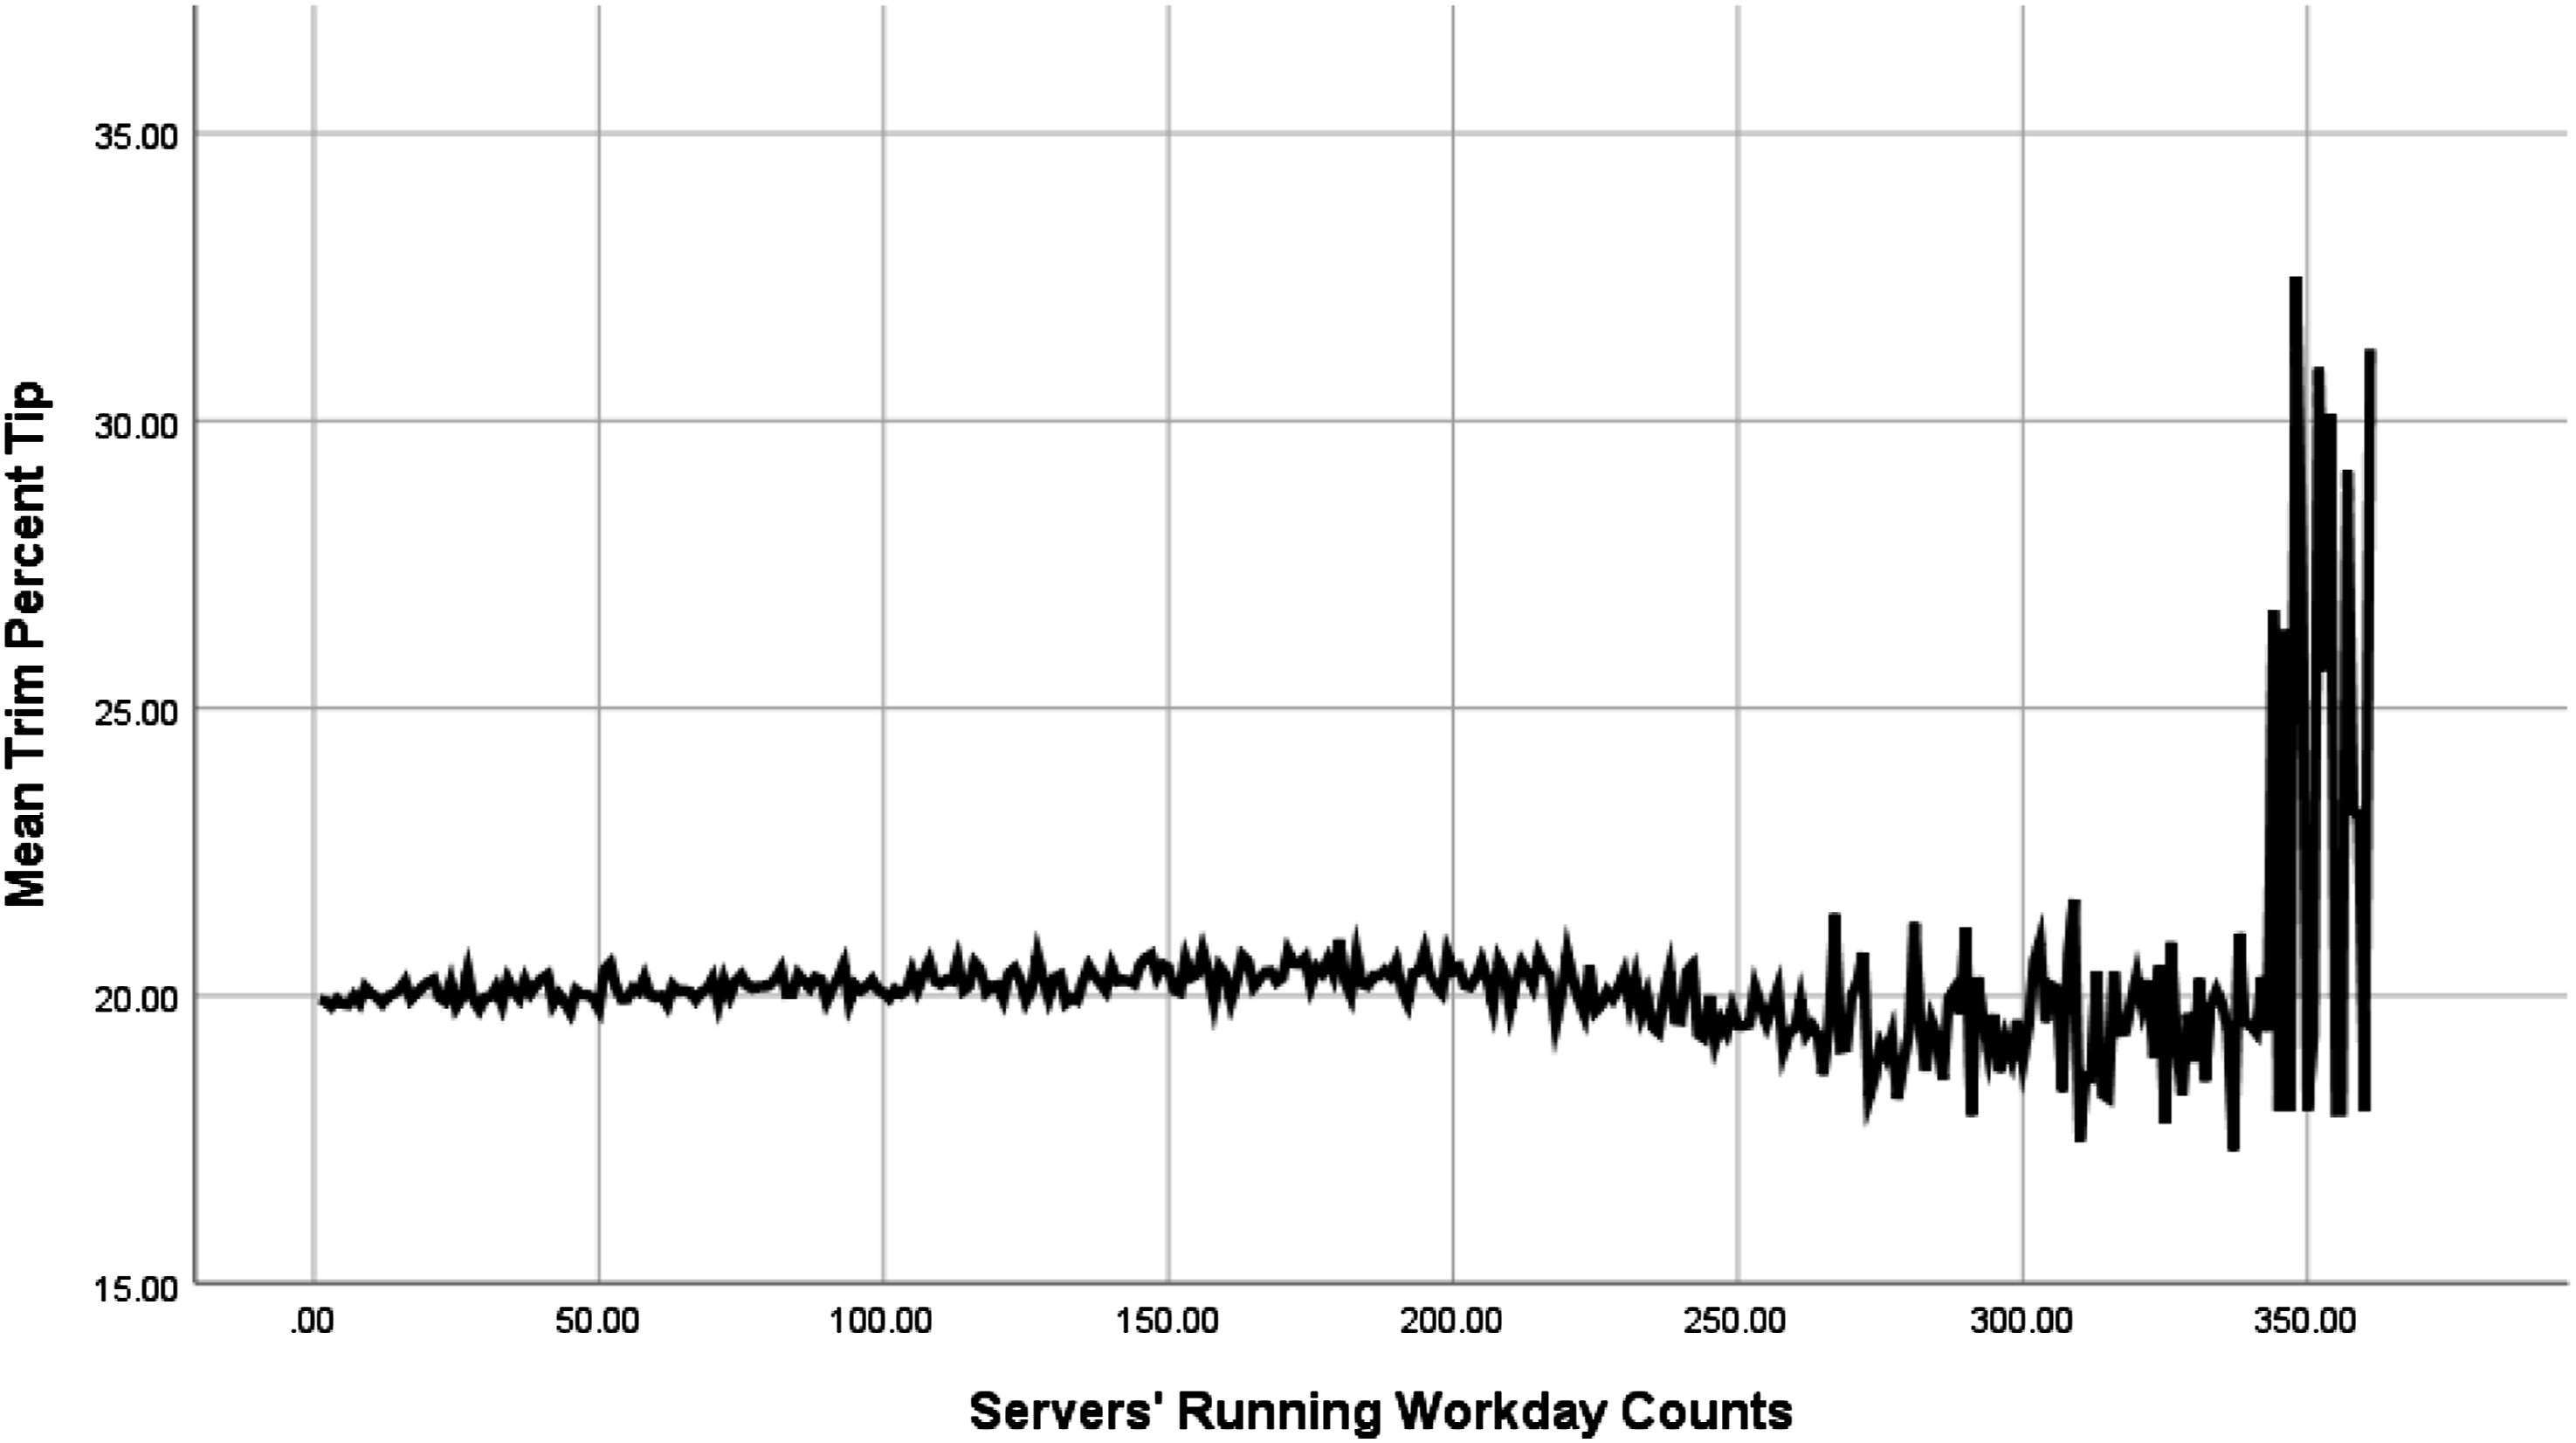
Mean trim percent tip varies little with servers’ running workday count.
Conclusions and Directions for Future Research
The results of this study indicate that tip percentages were generally consistent across servers’ workday counts (aka, server experience), but were slightly higher overall for those servers who ultimately stayed in the job for more workdays. The panel data are only correlational and cannot be used to make definitive causal inferences, but these findings provide more compelling evidence of a potential tip percentage effect on server tenure than is provided by existing cross-sectional correlational data sets. To that extent, they support Lynn’s (1996, 2006) claim that managers in the hospitality and tourism industries can reduce turnover at their establishments by training their employees to engage in behaviors known to increase tip percentages (also see Fernandez, et al., 2020). However, the effect of servers’ average tip percentages on their tenure was relatively small—accounting for only 5% of the variance in server tenure, as compared to 14% accounted for by servers’ average dollar tips per day and 33% accounted for by servers’ average number of daily checks (see Table 2). Tip percentages do matter, but, in this context at least, tip dollars matter more, and check counts matter the most. Thus, it does not appear that managerial attempts to increase servers tip percentages should be the highest priority when seeking to reduce turnover.
Despite the small size of tipping effects on retention in this study, more research on the topic needs to be conducted because it is possible that those effects are stronger in other contexts. The restaurants studied here were all in California, which has a relatively high minimum wage and does not allow employers to credit tips toward the minimum wage (Alli, 2016). Thus, the servers in this study had a much higher base wage than is typical throughout much of the country ($10 vs. $2.13 per hour; see Alli, 2016) and this may have reduced the effects of tip percentages on retention. In addition, California law permits tip pooling or sharing of tips among workers (Krook, 2019). It is not known if the restaurants in this study pooled tips or not, but if they did, that too would have likely reduced the effects of individual differences in tip percentages on retention. These and other moderators of tip percentage effects on retention deserve further research.
The results of this study point to other directions for research as well. As mentioned previously, the effect of check counts on job tenure was nearly 6 times as large as that of tip percentages. Dollar tip income increases with the number of customers served, so the effect of number of daily checks may be partly attributable to its effects on server’s dollar tip income. However, the fact that this effect was the strongest of those examined (see Table 2) and that it remained reliable after controlling for servers’ average tip percentages and average daily sales (see Table 3) suggests that some other process must also underlie it. Perhaps check counts are a better predictor of server tenure than are average daily sales or tip percentages, because staying busy makes working more enjoyable. Alternatively, check counts may be a source of tip income that servers attribute more to their employer and less to their own skill than is true for sales and tip percentages. Servers may be more reluctant to switch jobs the more of their income they attribute to a particular employer. These possibilities also deserve investigation in future research.
In summary, the results of this study support the idea that receiving higher tip percentages increases employee retention. The effect was small, but it may be larger in other contexts, so more research needs to examine this effect in the future. Pending additional research, the current findings suggest that training staff to wait on more customers and scheduling them in a way that maximizes their customer counts would more effectively reduce waitstaff turnover than would training servers in tactics than increase tip percentages. Compensation is important, but when it comes to restaurant waitstaff turnover, other things may matter more.
Footnotes
Declaration of conflicting interests
The author(s) declared no potential conflicts of interest with respect to the research, authorship, and/or publication of this article.
Funding
The author(s) received no financial support for the research, authorship, and/or publication of this article.
