



Abstract
The aim of this study was simulating the temperature distribution in course-wise extended weft-knitted fabrics by considering different extension levels. Accordingly, three types of weft-knitted fabrics structured in plain single jersey, plain rib, and interlock patterns were prepared using an electronic flat knitting machine. The fabrics were then exposed in a course-wise manner to three different extension levels (0%, 15%, and 30%) from which their heat transfer features at an extended state could be measured, by using the hot plate instrument and an infrared thermal camera. For the theoretical evaluation of temperature distribution, the fabrics’ corresponding geometrical unit cells were established in a finite element software environment. There was an acceptable agreement between the experimental and modeling results. It was also shown that applying different extension levels could significantly affect the knitted fabrics’ temperature distribution.
Keywords
Thermal comfort is an important property of garments, and it helps determine their end-use applications. This property can be influenced by several factors such as fiber type, yarn properties, and the fabric’s structural pattern (Jhanji, Gupta, & Kothari, 2015; Oglakcioglu & Marmarali, 2007). Numerous researchers have studied heat transfer in weft-knitted fabrics (Bivainyte, Mikucioniene, & Milasiene, 2012; Erdumlu & Saricam, 2017; Onofrei, Rocha, & Catarino, 2011). In order to conduct precise investigations, other researchers have focused on both the experimental and theoretical aspects of heat transfer in weft-knitted fabrics. Cimilli, Nergis, and Candan (2008), for example, investigated the applicability of a computational model to the simulation of heat transfer through the plain weft-knitted structure. The authors found that the finite element method could provide accurate and promising results in comparison to the experimental results. Hasani, Ajeli, and Nouri (2013) also discovered compatibility between the experimental and theoretical results obtained for the interlock knitted fabrics they investigated. Three-dimensional simulation of heat transfer through single jersey weft-knitted fabrics was performed by Puszkarz, Korycki, and Krucinska (2016). They found that the SolidWorks approach could be very appropriate for analyzing heat transfer phenomena in textiles. Infrared thermography analysis was introduced by Puszkarz and Krucinska (2017) in order to study the thermal insulation of weft-knitted fabrics. Using this method together with numerical simulation can provide acceptable results when investigating a fabric’s thermal insulation is the main concern. Accordingly, Siddiqui and Sun (2017) predicted the thermal conductivity of plain single jersey knitted fabrics by the finite element method, using a new experimental setup; by comparing the results, they found a correlation between the experimental and simulation methods.
From previous studies, it can be inferred that all the fabric samples have been thermally investigated, while they have been in the relaxed condition with no extension. But the importance of studying surface temperature distribution, especially for weft-knitted fabrics tightly fitted to the human body, illustrates the main impetus for this research. Due to their high shape-ability with the body, weft-knitted fabrics should also be considered to have nonuniform deformation corresponding to their contact area. This nonuniform extension would change the geometry of the fabric, ultimately affecting heat transfer properties. In this work, the computational modeling of the fabrics’ surface temperature distribution at different extension levels was also investigated. Verification of temperature distribution in the simulating model was done by comparing experimental and theoretical results.
Materials and Methods
Samples
Weft-knitted fabrics with three different patterns were fabricated on a Stoll flat knitting machine (CMS400, E5) using 100% acrylic yarn. The diameter, count, and twist of yarn were 0.48 mm, 6 Nm, and 266 TPM, respectively. The elastic modulus, breaking force, and yarn extension were 1,431 MPa, 19.02 N, and 34.1%, respectively. Before the experimental tests, the samples were initially exposed to dry relaxation at 20 ± 2 °C and 65 ± 2% relative humidity for 24 hr until the internal stresses could be released. Characteristics of all samples used in this research are given in Table 1. Mass per unit area and thickness of the samples were tested according to ASTM D3776-96: Standard Test Method for Mass per Unit Area (Weight) of Fabric (Annual Book of ASTM Standards, 2002) and ASTM D1777-96: Standard Test Method for Thickness of Textile Materials (Annual Book of ASTM Standards, 2007), respectively. Air permeability was tested according to ASTM D737-96: Standard Test Method for Air Permeability of Textile Fabrics (Annual Book of ASTM Standards, 2004), and fabric porosity was calculated using the following equation (Stankovic & Bizjak, 2014):

Characteristics of the Samples.
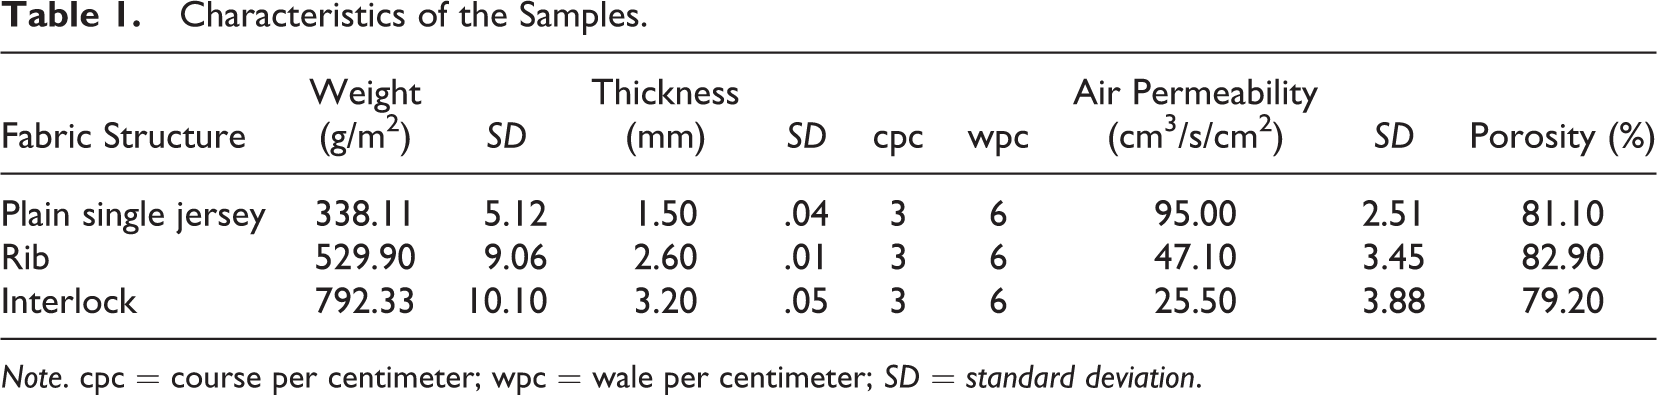
Note. cpc = course per centimeter; wpc = wale per centimeter; SD = standard deviation.
where ρ and ρ0 are the densities of fabric and fiber (g/cm3), respectively.
Experimental Setup
In ideal conditions, a cylindrical weft-knitted fabric fitted on a truncated cone (conical frustum) should be considered, as the minimum diameter of the cone is equal to the diameter of the fabric cylinder. It is obvious that the fabric is exposed to a nonuniform extension, which changes linearly toward the maximum diameter of the cone. The surface temperature of the truncated cone and the outermost layer of the fabric are considered the hot side (human body) and the cold side, respectively. Since the precise recording of a surface temperature map for the three-dimensionally modeled fabric required high memory and runtime, a cone-like plane geometry was instead considered, as shown in Figure 1.

(A) Truncated cone. (B) Cone-like plane geometry.
To apply the lateral linear extension in course-wise direction to the fabrics, movable jaws were designed and assembled. A schematic diagram of the device is shown in Figure 2(A). The movable jaws consisted of bars capable of gripping the edge of the fabric firmly. The top part of the jaws was jointed to a slotted horizontal bar so that it could be fixed in a position capable of rotating freely. The bottom part of the jaws was mounted on a horizontal slotted bar and could move horizontally. By moving the bottom joints outward while the top joints were fixed, a linear lateral extension was applied to the fabric. By knowing the length and width of the device, the value of the extension could be calculated. As established in previous research, garments are exposed to two types of stretch: comfort stretch (5–30%) and power stretch (30–50%); when fabrics are exposed to extension levels in the range of 5–30%, only loop deformation occurs, but when the exposure is in the range of 30–50%, yarn may slip from its loop structure (Masteikaite, Saceviciene, Kopbajeva, & Nurjasarova, 2015; Senthilkumar & Anbumani, 2011). In this study, the fabrics were experimentally exposed to extension levels of about 0–30%, in which the loops were correspondingly stretched. To study temperature distribution within the weft-knitted structures, the fabrics, while fixed between the movable jaws, were placed on a hot plate apparatus created in previous research (Ziaei & Ghane, 2013) and set at 35 °C, equal to the nominal temperature of human skin (Siddiqui & Sun, 2018). The functional principle of the hot plate was based on the guarded hot plate method, as described in ASTM D-1518-85: Standard Test Method for Thermal Transmittance of Textile Materials (American Society for Testing and Materials, 2003). Two thermocouples were used, and the hot plate was equipped with a heat sensor connected to a Proportional-Integral-Derivative (PID) controller, which could adjust the hot plate temperature to the desired value. The top view of the hot plate instrument and positions of the thermocouples are shown in Figure 2(B). A view of the experimental setup used in this study is shown in Figure 2(C). Investigation into the heat transfer of the weft-knitted fabrics at nonuniform extension levels was done by an infrared thermal camera through which the temperature map of the fabric’s surface could be captured. The cold side of the fabric was in contact with the ambient air. During all tests, the temperature and the relative humidity of ambient air were constantly kept at about 20 ± 2 °C and 65 ± 2%, respectively. The thermal images from the infrared thermal camera were finally transferred to a data acquisition system for more detailed analysis.
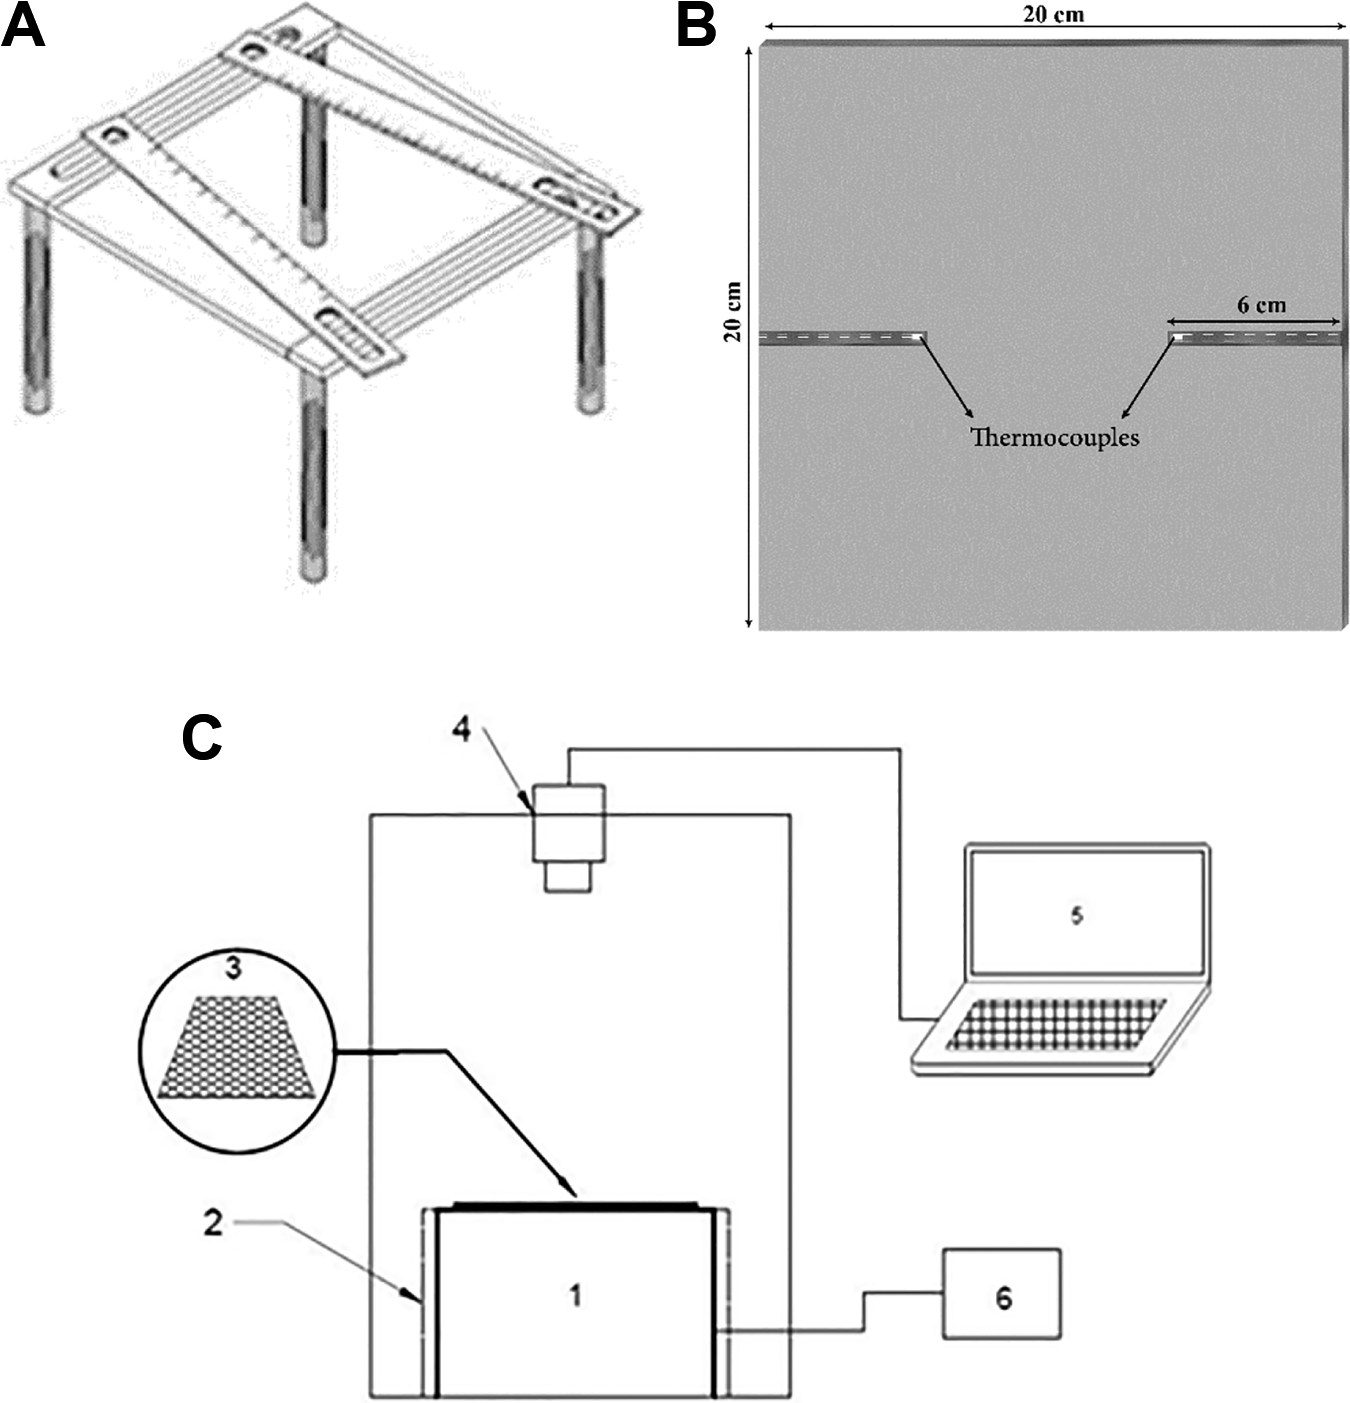
(A) Movable jaws. (B) Top view of the hot plate and positions of the thermocouples. (C) A view of the experimental setup: 1. Hot plate, 2. Movable jaws, 3. Extended fabric, 4. Infrared thermal camera, 5. Data acquisition system, 6. PID controller.
It should be mentioned that three different fabric structures (plain single jersey, rib, and interlock) were fabricated and then their surface temperature distributions were evaluated at three different extension levels (0%, 15%, and 30%). In fact, the effects of two factors (fabric structure and extension level) on surface temperature distribution have been evaluated both in the experimental method and computational modeling.
Computational Modeling
Creating Loop Geometry
Geometrical simulation of a knitted loop known as the weft-knitted fabrics’ unit cell was the basis of computational modeling, the main aim in this research. By using the finite element method together with the loop equation of Vassiliadis, a three-dimensional model of the fabric samples could be achieved (Vassiliadis, Kallivretaki, & Provatidis, 2007a, 2007b). The geometrical models of plain single jersey knitted structure in top, front, and side views are shown in Figures 3(A), 3(B), and 3(C).
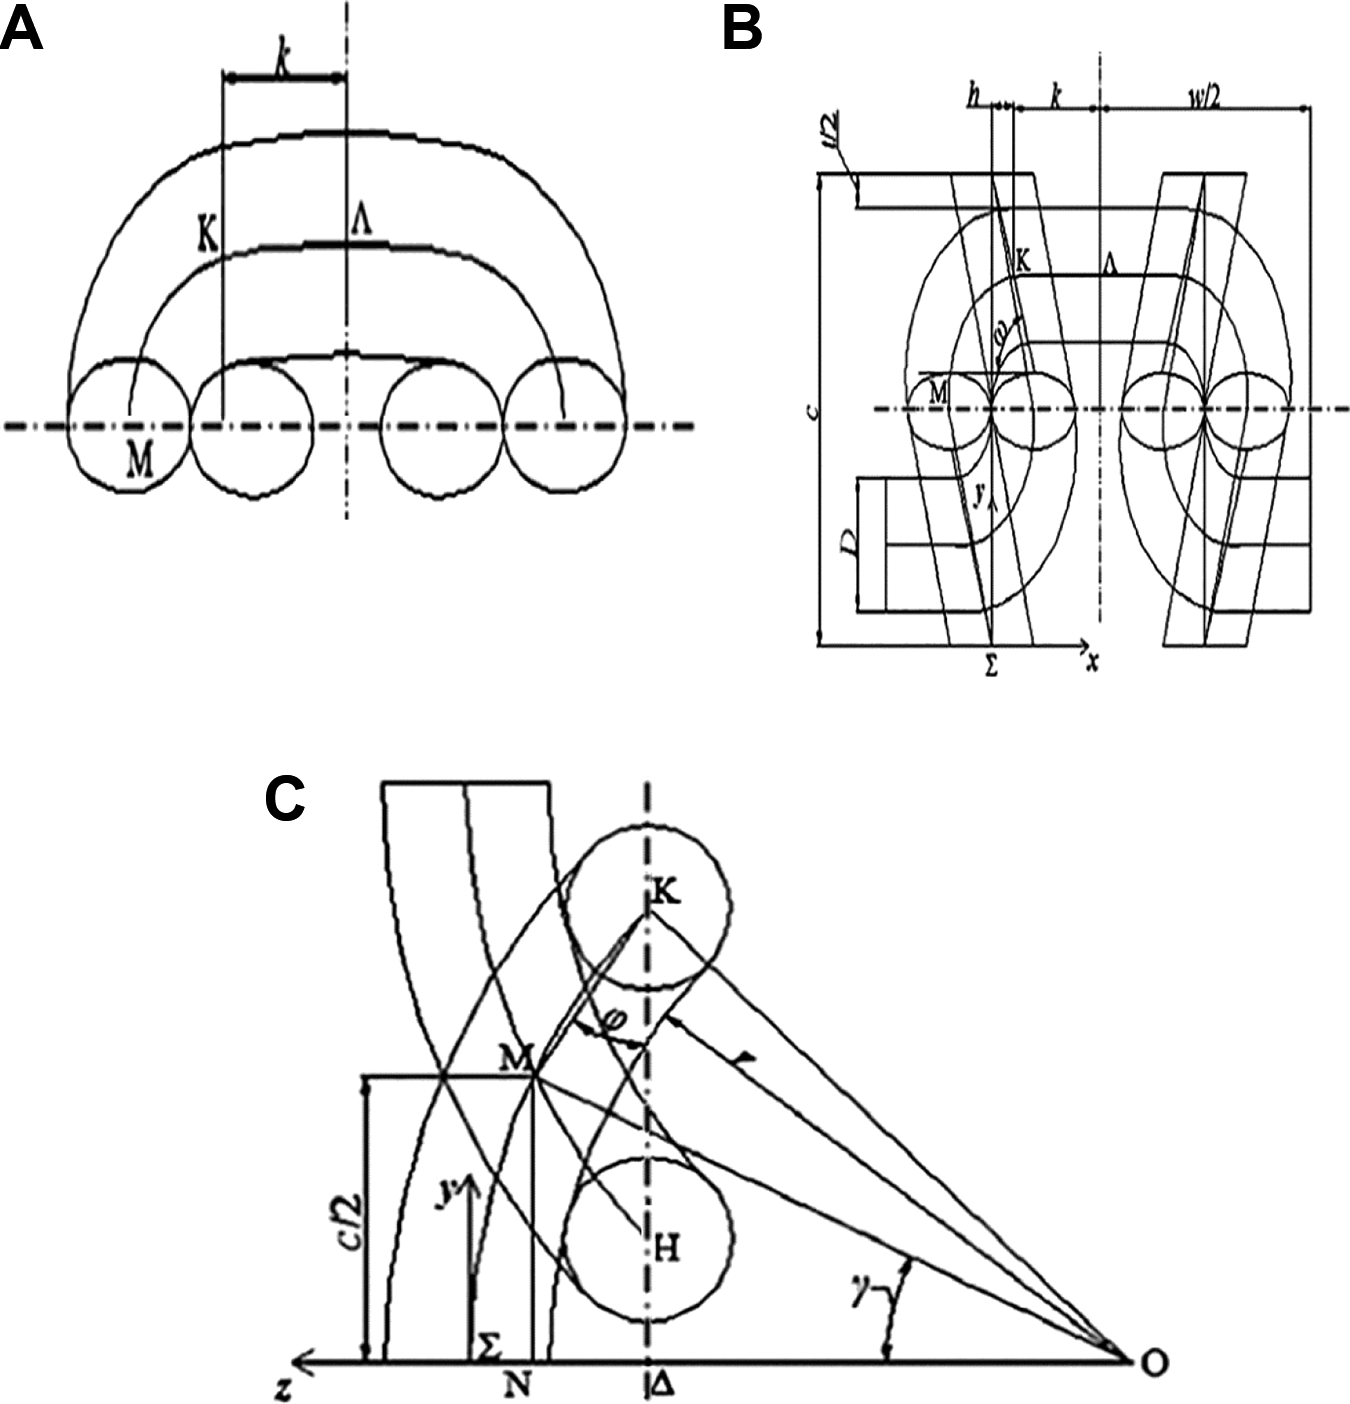
Geometrical model of plain single jersey knitted structure: (A) top view, (B) front view, and (C) side view (Vassiliadis et al., 2007a, 2007b).
According to Figure 3, creating a central axis of a quarter of plain loop is enough (part ΣMKΛ). Because the plain loop consists of four identical sections, part ΣMKΛ is divided into three mathematical curves. Part ΣM was created according to the following equations (Vassiliadis et al., 2007b):


Part MK was created according to the following equations:


Part KΛ was created according to the following equations:


In order to create the rib and interlock structures, back and front loops are connected to each other by a linking yarn. The geometrical model and top view of the linking yarn are shown in Figure 4.
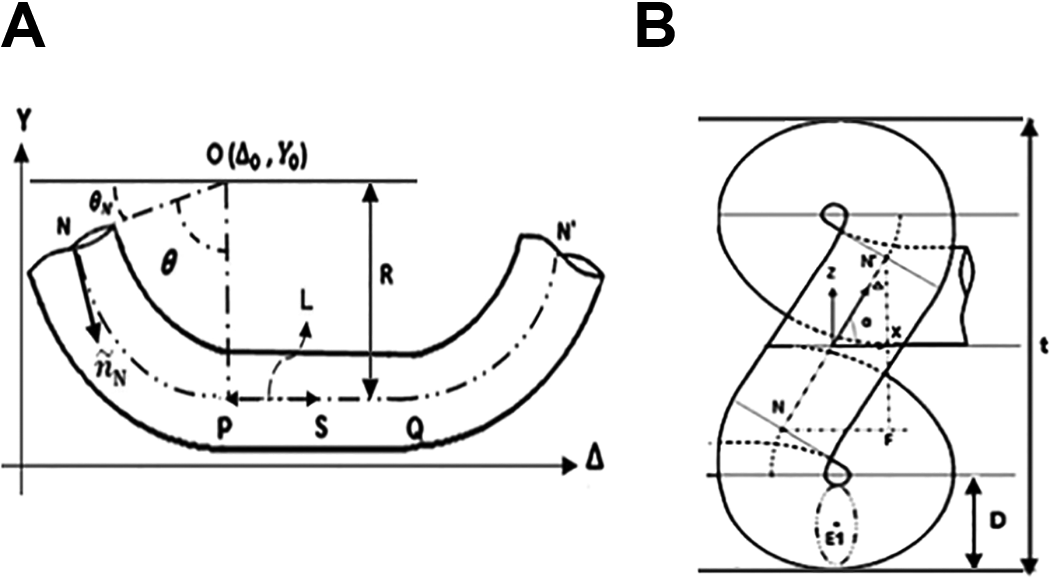
(A) Geometrical model of linking yarn. (B) Top view of linking yarn (Abghary et al., 2016).
According to Figure 4, linking yarn is a curve between points N and N′ and is created according to the following equations (Abghary, Hasani, & Nedoushan, 2016):






To simplify equation writing on the loop geometry within the Abaqus (version 6.14) software environment, Python (version 3.7.2) script programming was employed (Abghary et al., 2016, Abghary, Hasani, & Nedoushan, 2018). Considering important input data including yarn diameter, wale, and course spacing of the fabric structures and fabric thickness individually, the geometry of the unit cells could be modeled. The models of the structural unit cells for the plain single jersey, rib, and interlock knitted structures are, respectively, shown in Figures 5(A), 5(B), and 5(C).

Unit cells of (A) plain single jersey, (B) rib, and (C) interlock knitted structures.
Simulation of Temperature Distribution Within the Fabrics
The Abaqus software was used in this study due to its high ability to simulate temperature distribution within the fibrous structures. To simulate the real condition of heat transfer, a copper plate (considered the hot plate) was assumed to be in close contact with the structural unit cell of each sample, as depicted in Figure 6. DC3D4 meshing consisted of four-node linear tetrahedral elements applied to solve the model. Due to the complexity of fabrics’ structures and precise meshing of curved parts, this mesh type was selected. Mesh elements number 12,046, 26,507, and 36,032, respectively, for plain single jersey, rib, and interlock. It should be noted that the grid independency study was performed for all structures in order to examine the impact of grid densities on the temperature distribution results.

The meshed hot plate and the meshed unit cells of (A) plain single jersey, (B) rib, and (C) interlock knitted structures.
Some assumptions were made to simulate temperature distribution within the fabrics:
The structure of samples consisted of planar loops; all loops had an identical and uniform configuration within each individual sample (Abghary et al., 2016; Cimilli, Deniz, Candan, & Nergis, 2012);
Heat transfer was assumed to be steady state.
It is also important to mention that the boundary conditions could have a great effect on the heat transfer process. The temperature of the hot plate and the ambient air was set at 35 °C and 20 °C. At the initial boundary condition, the degree of freedom for both ends of the unit cells must be limited if 0% lateral extension is required. However, in order to simulate 15% or 30% extension in the course-wise direction (X direction), the displacement was correspondingly applied to the unit cells of all samples.
Results and Discussion
To confirm the validity of the computational modeling, values of the samples’ temperature distribution were experimentally measured using an infrared thermal camera (FLIR TG165). The samples were individually placed on a hot plate; after achieving the steady-state condition of heat transfer, thermal images were provided for each sample. As an example, a thermal image captured from the hot plate is shown in Figure 7.
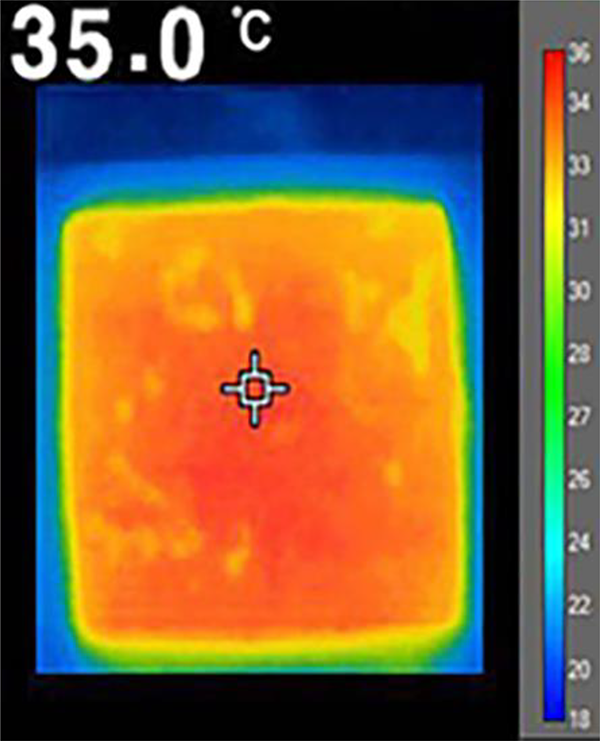
Thermal image of the hot plate.
From the thermal images, a temperature reference bar and the point at which the temperature was measured could be obtained. The thermal images of the plain single jersey, rib, and interlock knitted structures considering the nonuniform lateral extension in the course-wise direction are shown in Figures 8(A), 8(B), and 8(C), respectively. Different extension levels (e%) and the temperature (T) of different parts of fabrics have also been marked.
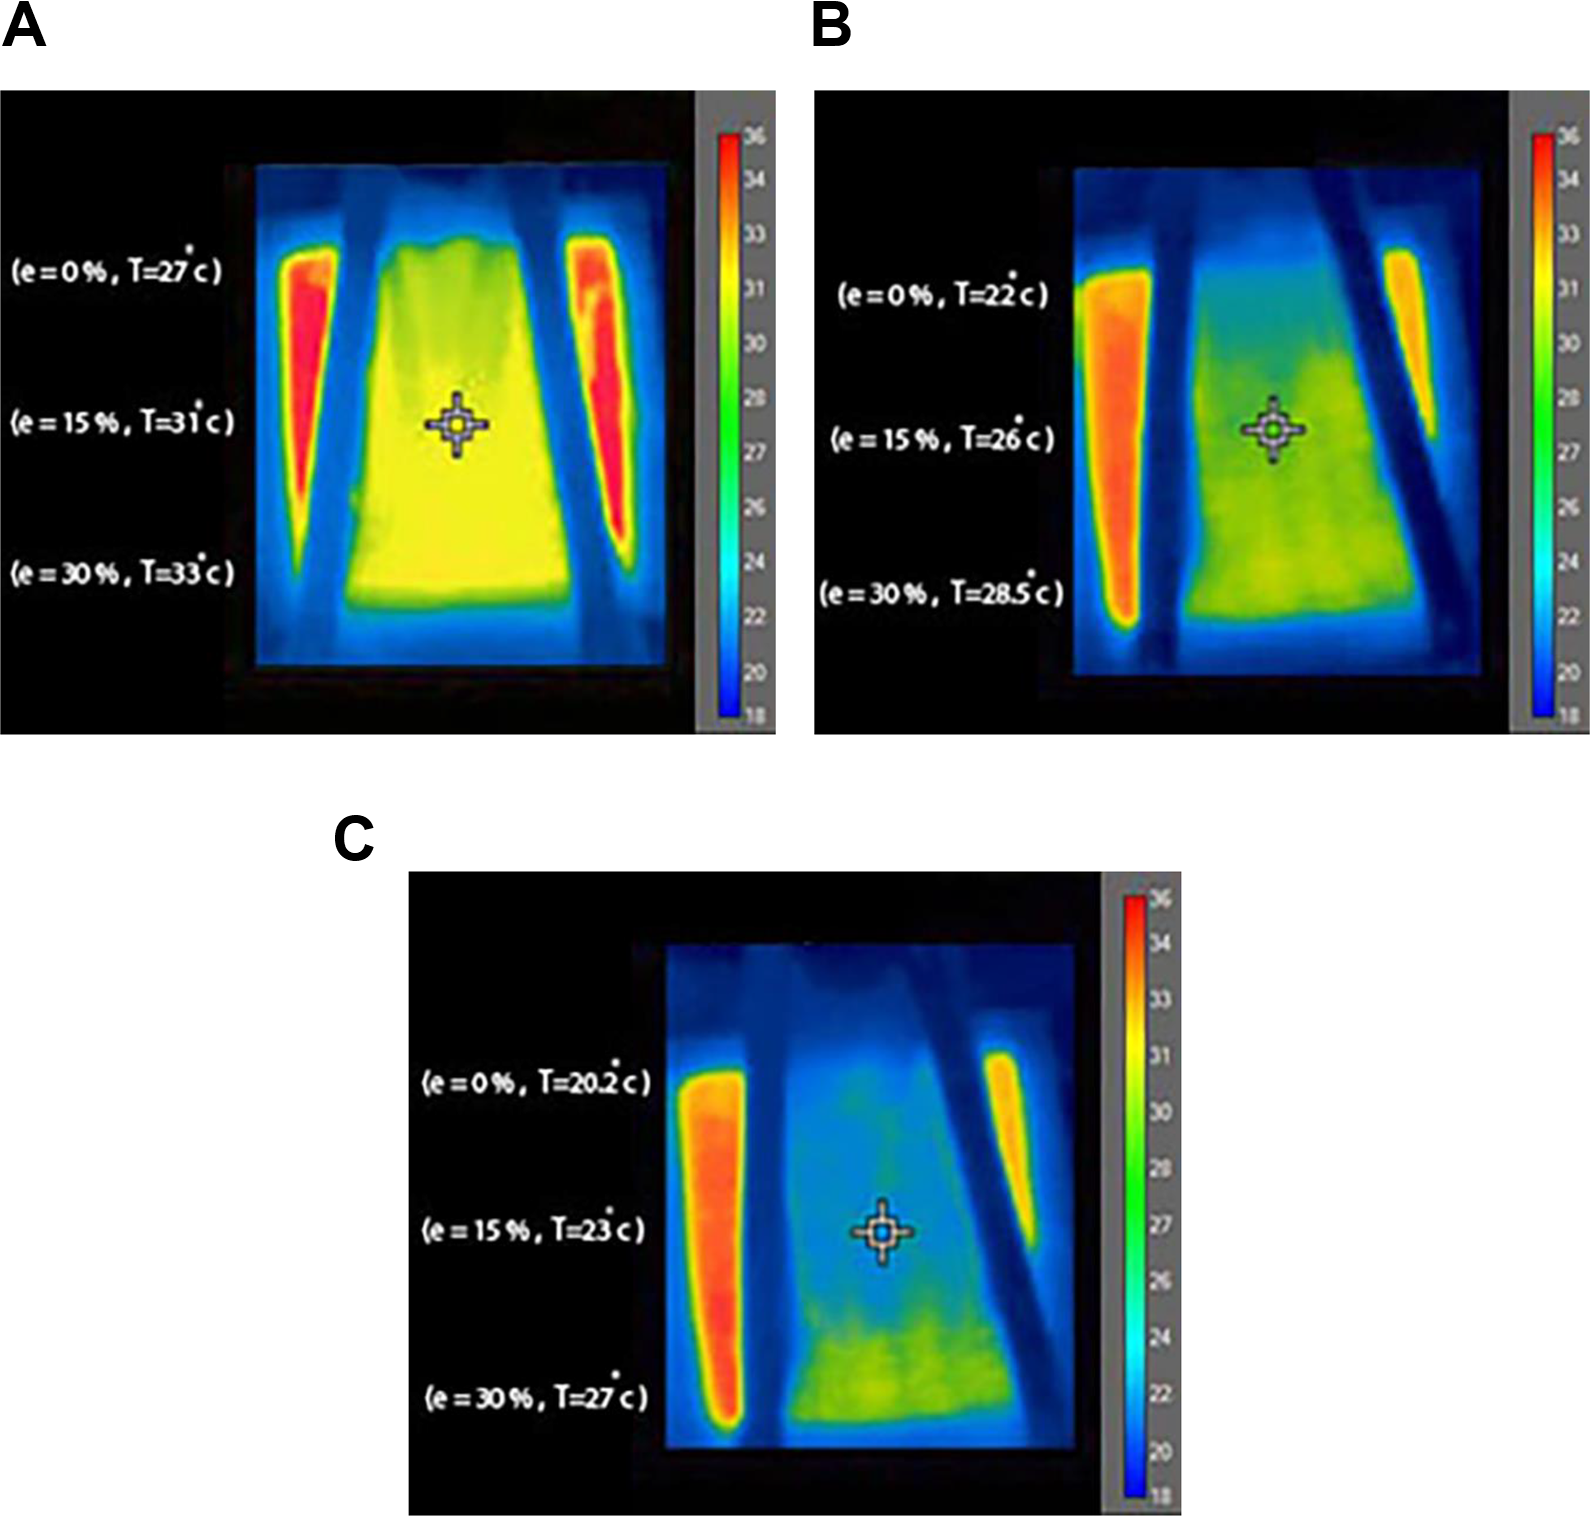
Thermal images of (A) plain single jersey, (B) rib, and (C) interlock knitted structures.
Because of the fabrics’ structural differences, different surface temperature values in accordance with the extension level were expected. The temperature contours of the plain single jersey, rib, and interlock unit cells in (a) 0%, (b) 15%, and (c) 30% extension in the course-wise direction, as obtained from Abaqus software, are shown in Figures 9, 10, and 11, respectively.
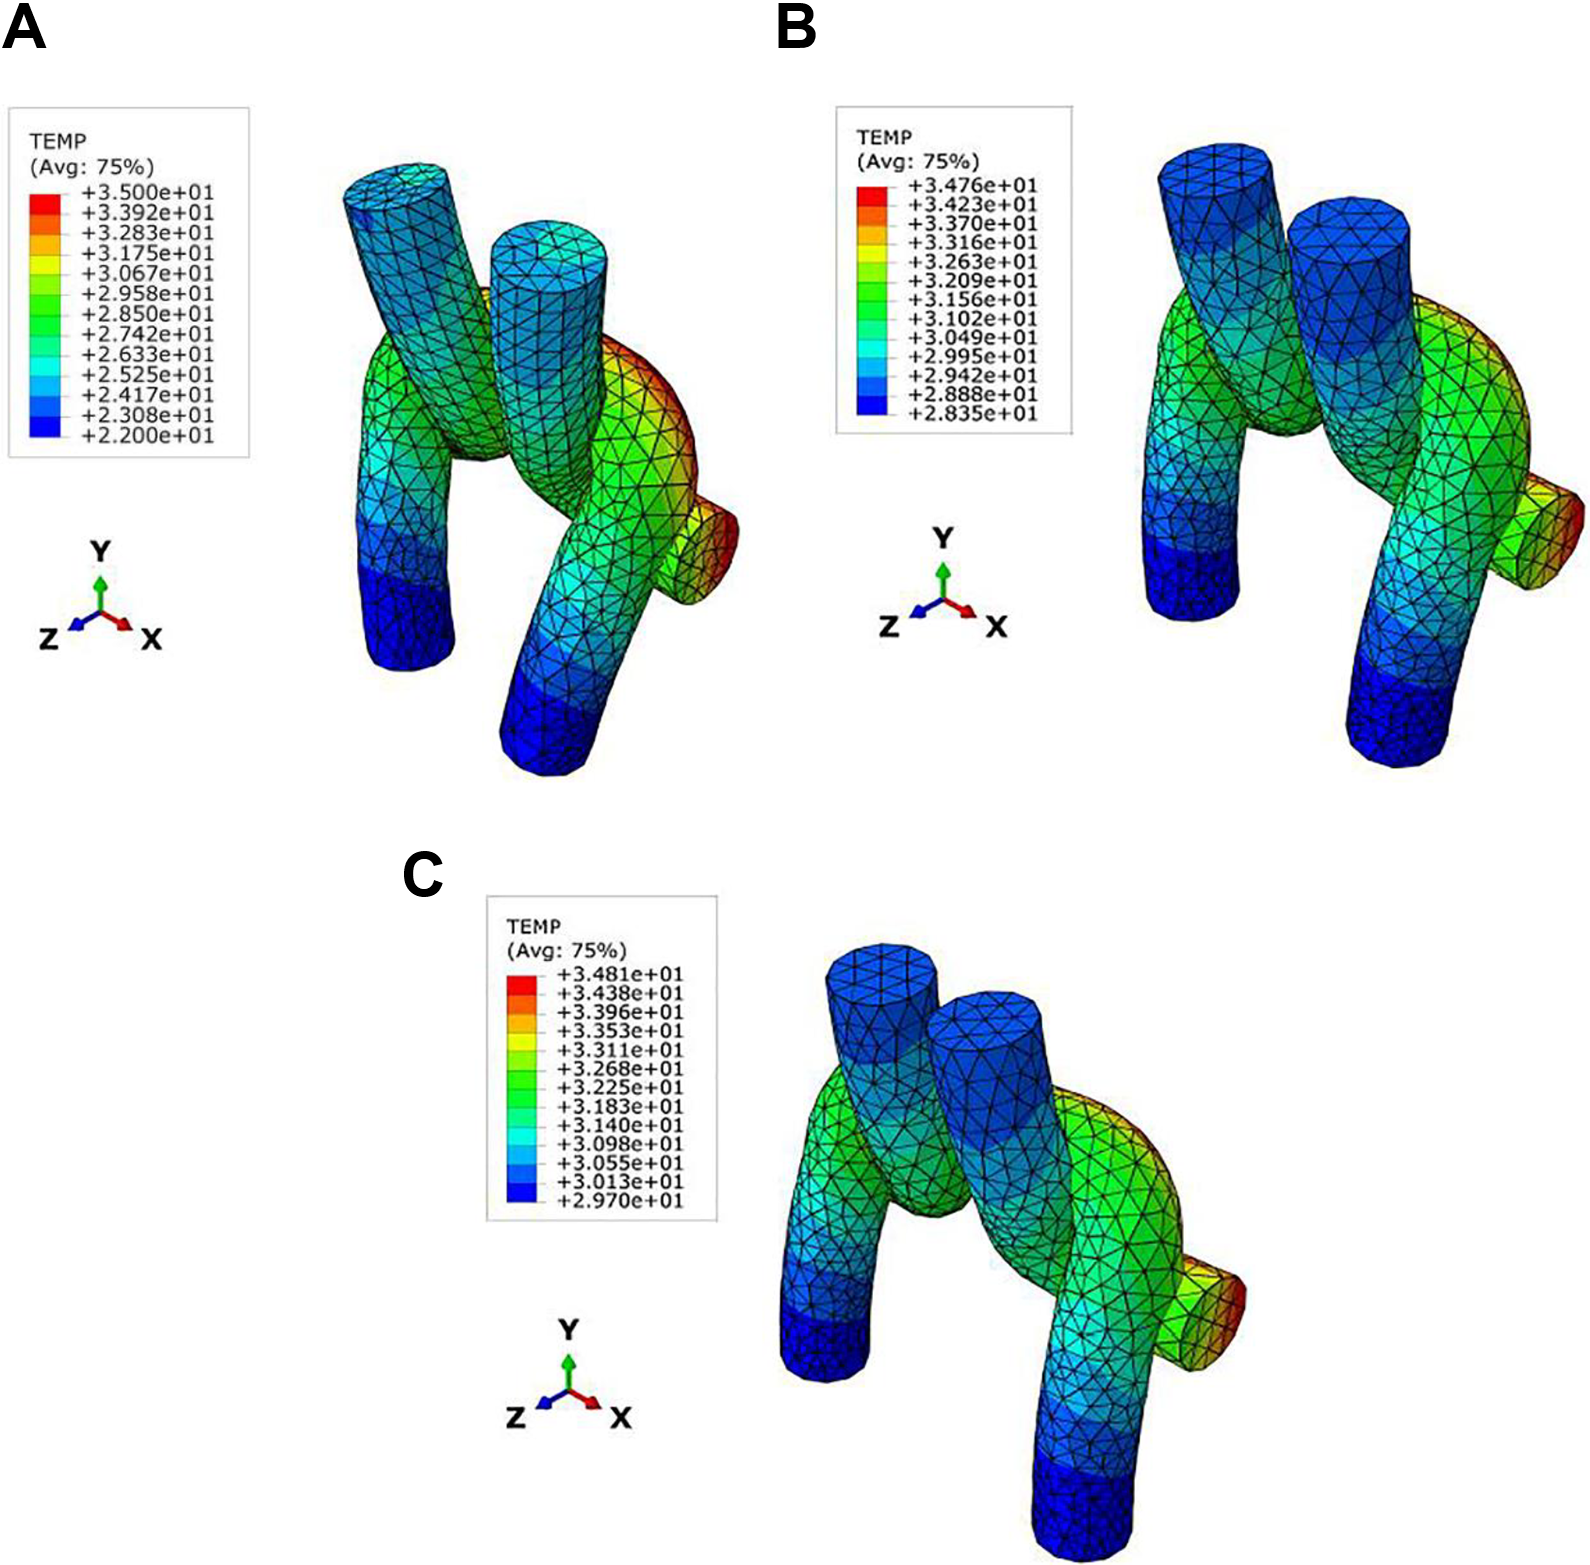
Temperature contour of plain single jersey unit cell in (A) 0%, (B) 15%, and (C) 30% extension in the course-wise direction.
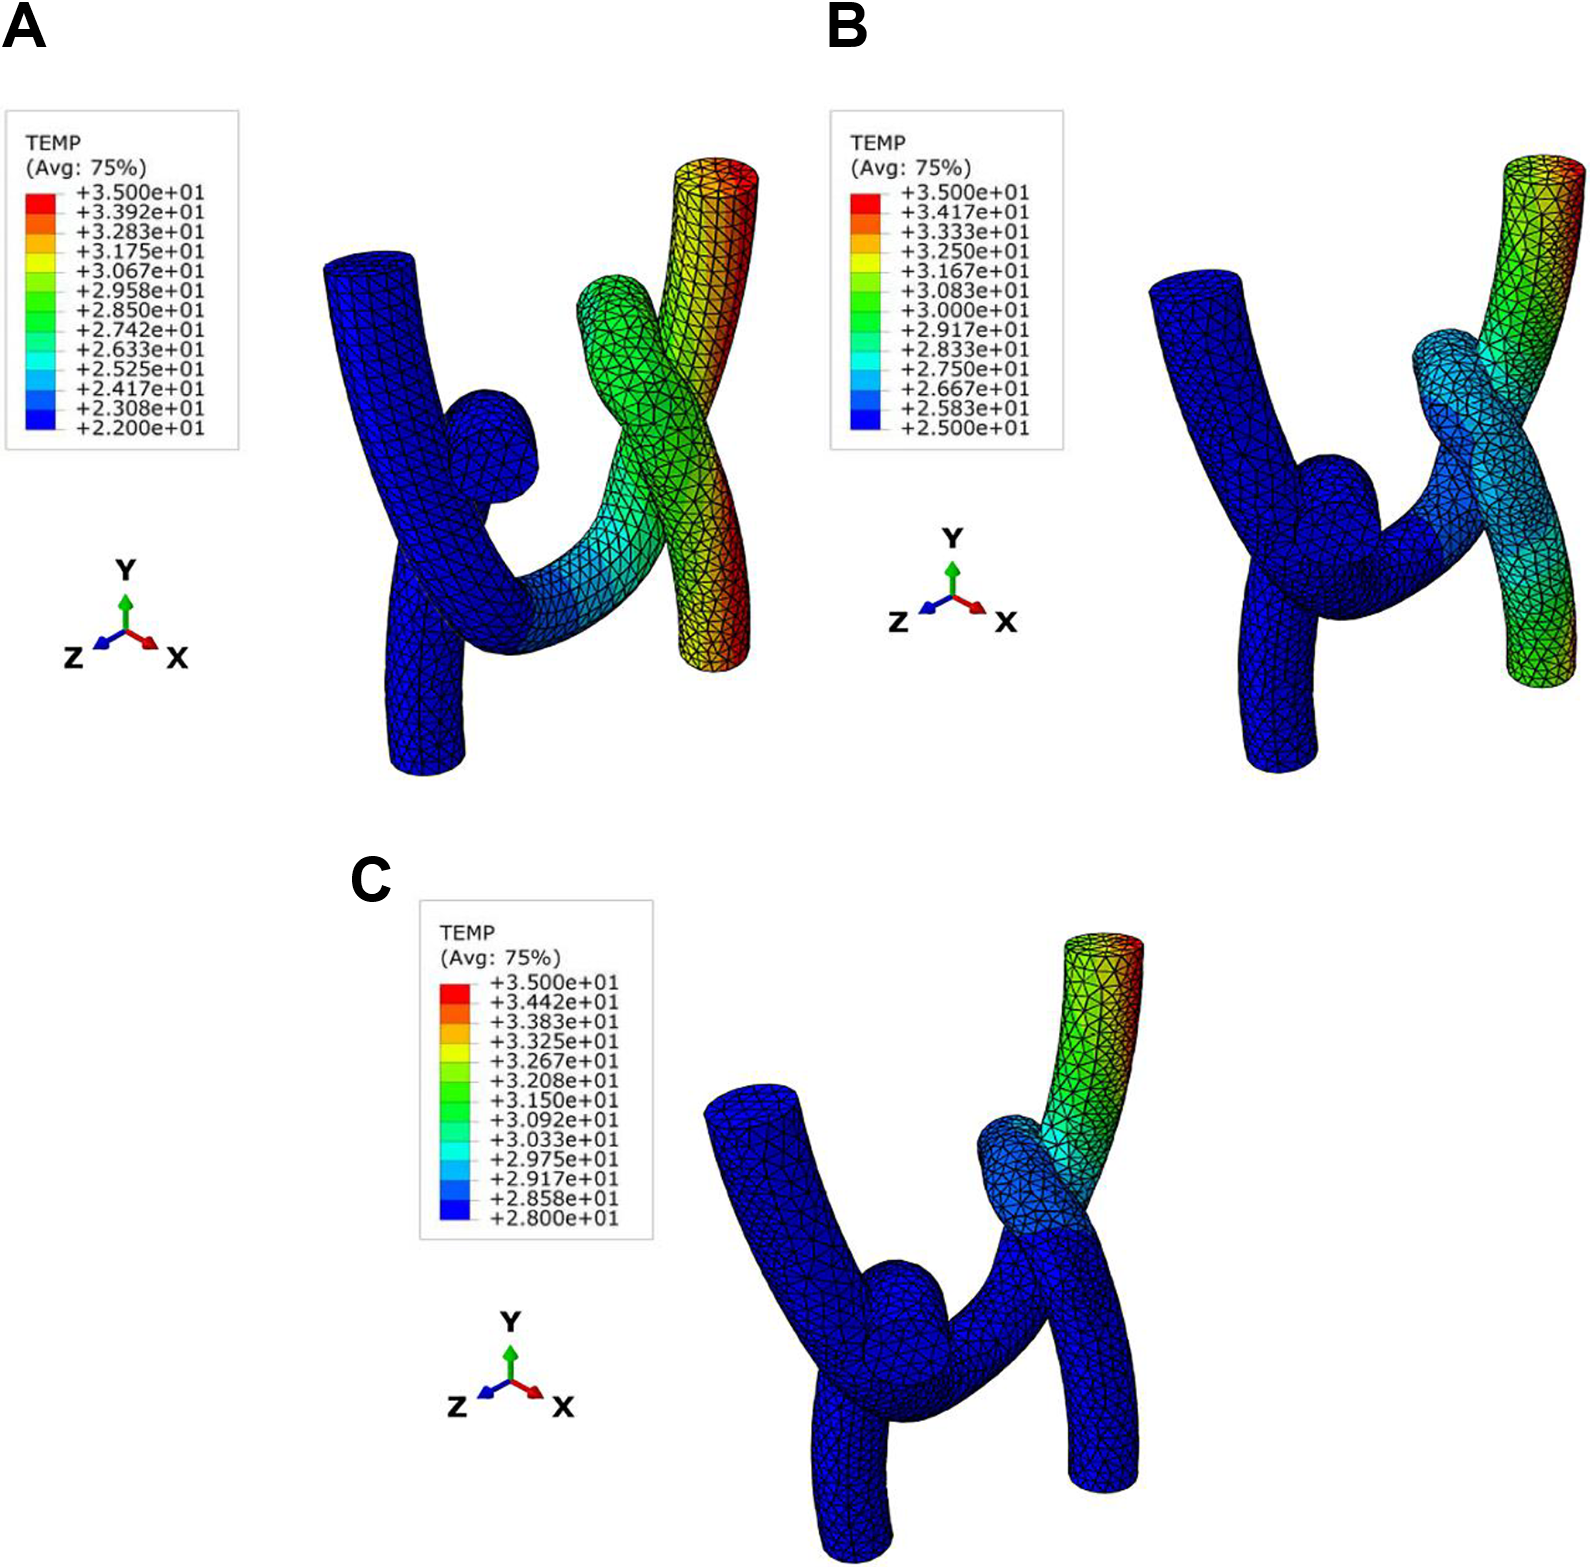
Temperature contour of rib unit cell in (A) 0%, (B) 15%, and (C) 30% extension in the course-wise direction.

Temperature contour of interlock unit cell in (A) 0%, (B) 15%, and (C) 30% extension in the course-wise direction.
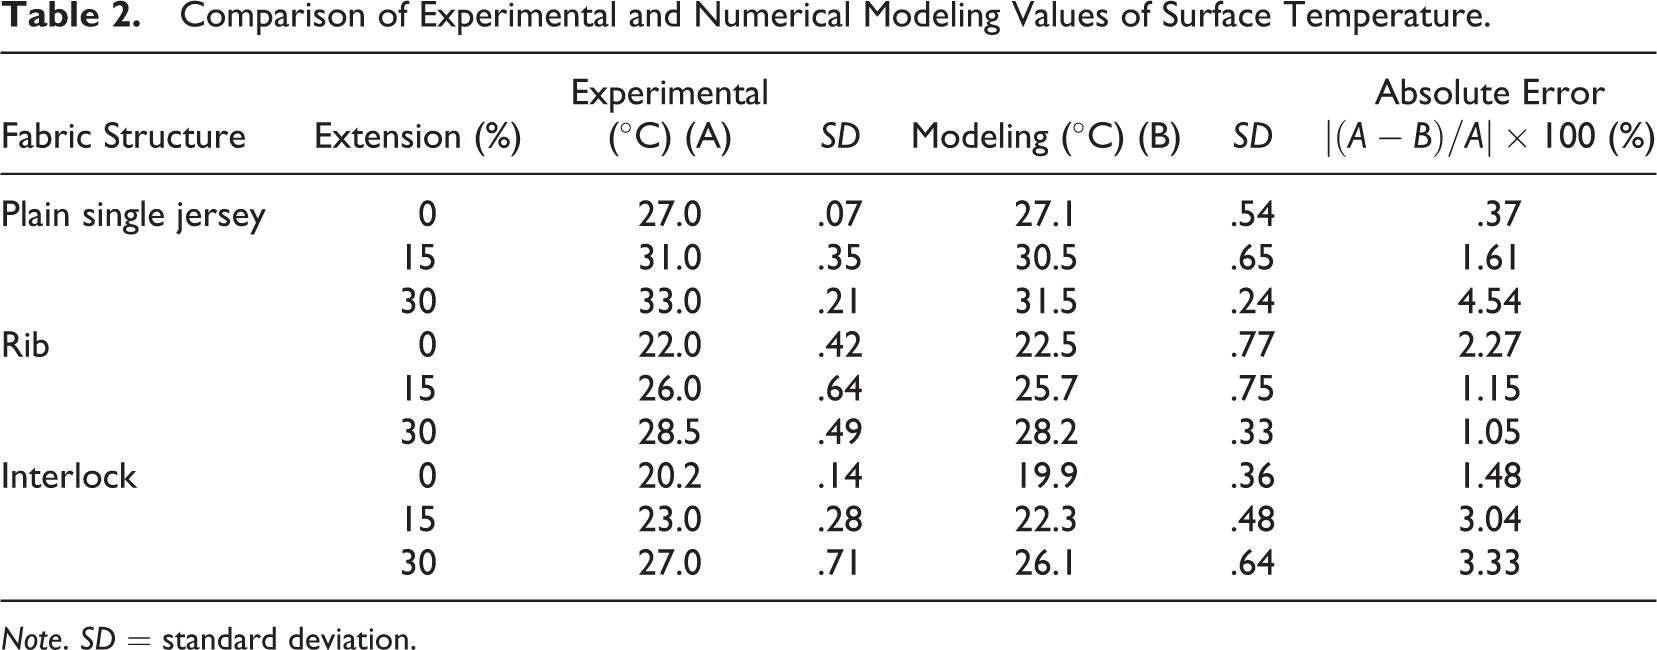
The surface temperature corresponding to three levels of extension, as shown in Figure 8, was measured precisely using the infrared thermal camera. Also, in order to report the surface temperature results obtained from computational modeling, average surface temperature related to different unit cells (plain single jersey, rib, and interlock) at different extension levels was considered and compared with the experimental results. The results are indicated in Table 2. The absolute error between the experimental and numerical modeling of surface temperature was also calculated.
Comparison of Experimental and Numerical Modeling Values of Surface Temperature.
Note. SD = standard deviation.
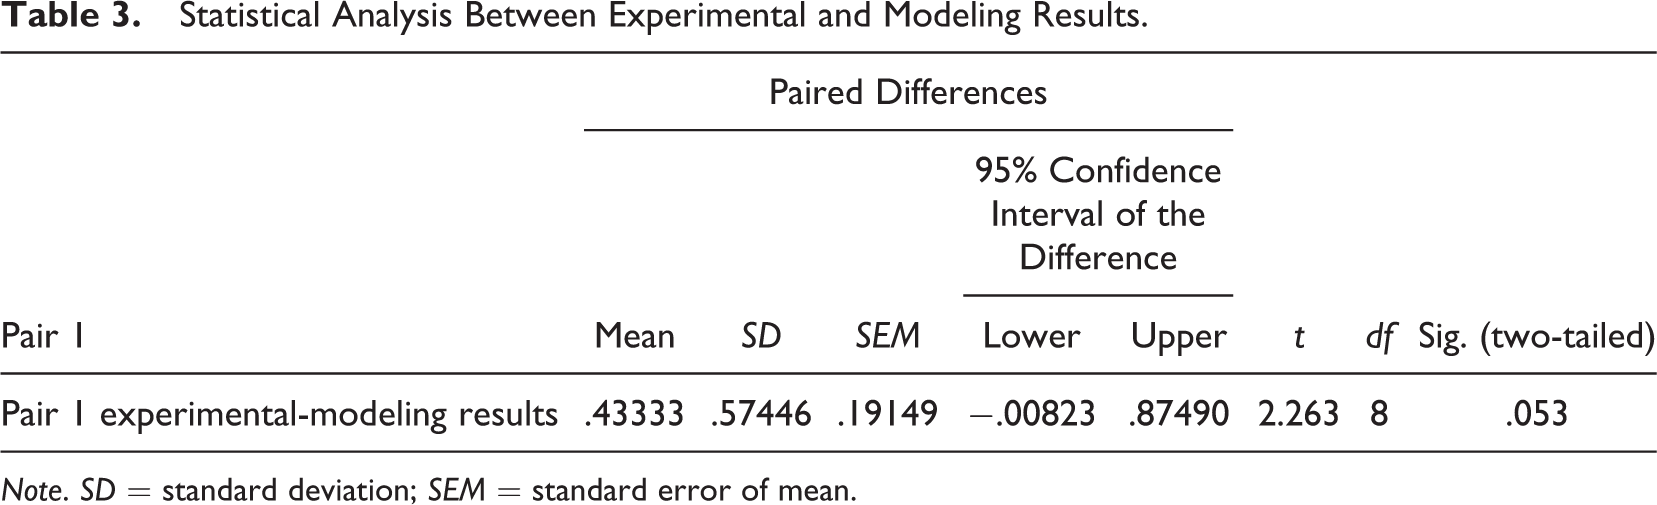
It was shown that the experimental and numerical modeling results were considerably close to each other, leading to an acceptable range of percentage error. It could be concluded that numerical modeling provided an acceptable prediction of surface temperature. In addition, in order to compare the modeling and experimental results, a paired t test was conducted and is shown in Table 3.
Statistical Analysis Between Experimental and Modeling Results.
Note. SD = standard deviation; SEM = standard error of mean.
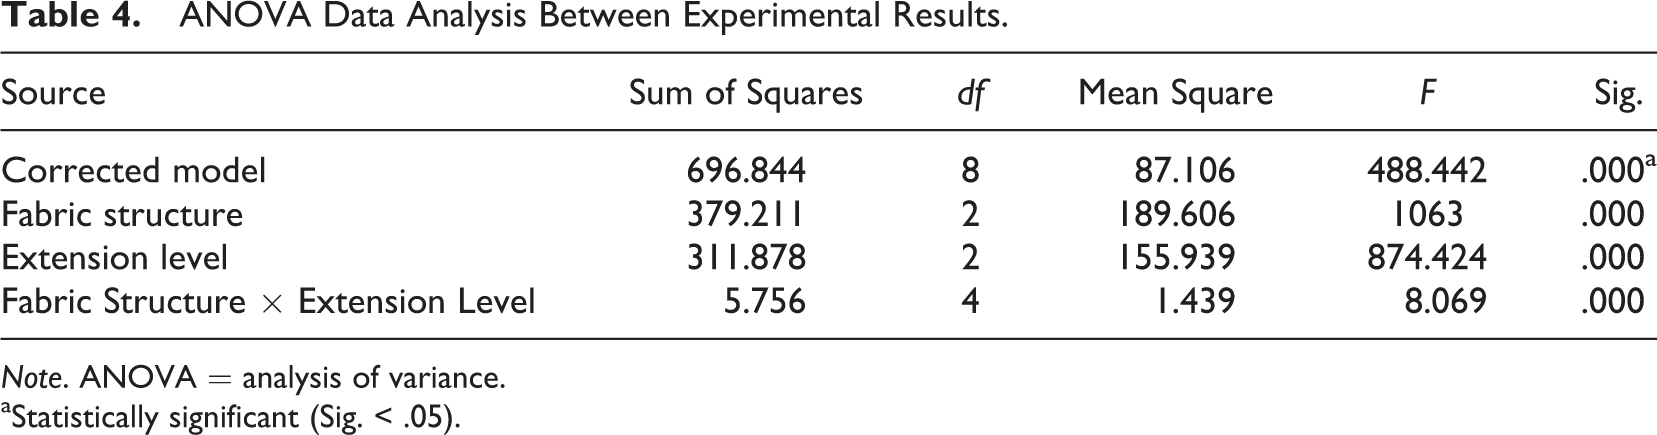
According to Table 3, since the amount of significance is not less than .05, it can be concluded that at a 95% confidence level, the test was not significant. Therefore, it could be concluded that numerical modeling provided an acceptable prediction of surface temperature for weft-knitted fabrics in the course-wise extended state. Differences in the surface temperature at different extension levels were analyzed to find whether they were statistically significant for each fabric structure. The two-way ANOVA test results at the .05 significance level using SPSS (version 16) statistical software are presented in Table 4.
ANOVA Data Analysis Between Experimental Results.
Note. ANOVA = analysis of variance.
aStatistically significant (Sig. < .05).
The statistical evaluation has been conducted according to tests of between-subjects effects. According to this test, since the amount of significance in all cases is less than .05, it can be concluded that at a 95% confidence level, the test was significant. In fact, fabric structure, extension level, and interaction of these two factors have significant effects on the surface temperature distribution within the fabrics. The effect of the fabric structure on the surface temperature was statistically significant, as shown in Table 4. The plain single jersey knitted structure consists of just one layer of knitted loops, whereas the rib and interlock knitted structures are double layered, capable of entrapping more insulating air throughout their structures, as compared with the plain single jersey knitted structure. Also, two series of loops arranged into two parallel lines in a course are forming a rib knitted fabric. Consequently, the thickness of rib fabric is higher than the plain single jersey knitted structure. Due to higher fabric thickness and insulating air within the rib structure, the heat loss of this structure is less than the plain single jersey knitted fabric.
Furthermore, it is necessary to mention that two separate 1 × 1 ribbed structures that are interknitted are forming an interlock structure. Therefore, the interlock fabric is heavier, thicker, and tighter than rib and plain single jersey knitted fabrics. So, in this study, the highest and lowest thermal conductivity is related to the plain single jersey and interlock knitted structures, respectively (Oglakcioglu & Marmarali, 2007; Ziaei, Ghane, Hasani, & Saboonchi, 2018). It has been determined that the level of extension applied to the weft-knitted fabrics could significantly affect their heat transfer features, as shown in Table 4.
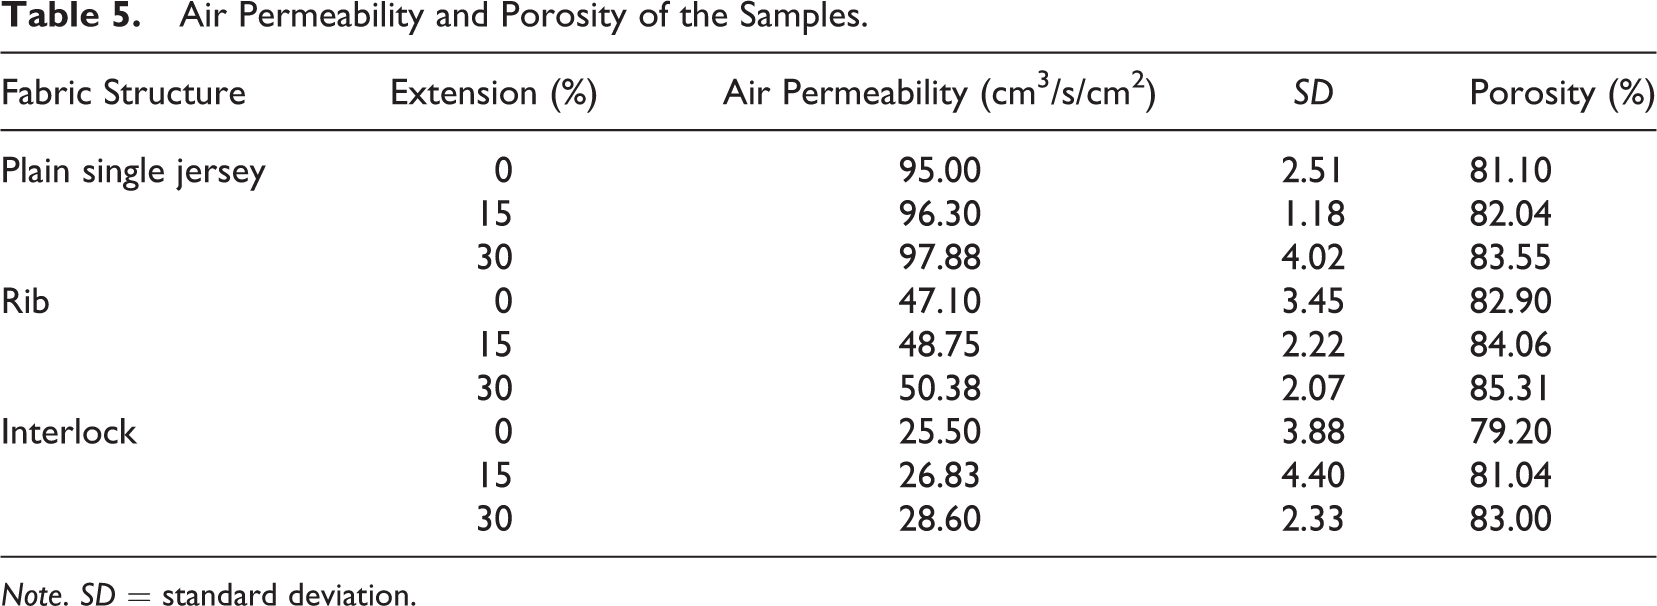
It should be mentioned that by applying extension, fabric structure becomes more open, and the porosity and air permeability of the fabric are increased (Ogulata & Mavruz, 2010). Therefore, course-wise extension of the knitted fabrics increases the air permeability as well as the fabric porosity. The air permeability and porosity of the fabrics under different extensions are presented in Table 5.
Air Permeability and Porosity of the Samples.
Note. SD = standard deviation.
Banks-Lee, Mohammadi, and Ghadimi (2004) concluded that air permeability significantly affects the thermal conductivity of fabrics. In fact, increasing the air permeability of fabrics by increasing porosity also causes the thermal conductivity of fabrics to increase. Therefore, course-wise extension of the knitted fabrics increases air permeability as well as thermal conductivity.
Conclusion
This research was aimed at simulating the temperature distribution in weft-knitted fabrics exposed to different course-wise extension levels. The corresponding geometrical unit cells of fabrics were established, and temperature distribution in the structural unit cells of weft-knitted fabrics was simulated by the finite element method. There was an acceptable agreement between the experimental and numerical modeling results. It has been concluded that surface temperature distribution in weft-knitted fabrics, induced by applying nonuniform lateral extension, could be properly simulated by computational modeling. Also, different extension levels of the weft-knitted fabrics significantly affected the temperature distribution in these structures. In addition, it could be stated that the highest thermal conductivity is related to the plain single jersey knitted structure in comparison to the rib and interlock knitted structures.
Footnotes
Acknowledgments
The authors would like to express their sincere thanks to the deputy of research at Isfahan University of Technology for the financial support.
Declaration of Conflicting Interests
The author(s) declared no potential conflicts of interest with respect to the research, authorship, and/or publication of this article.
Funding
The author(s) disclosed receipt of the following financial support for the research, authorship, and/or publication of this article: This research was financially supported by Isfahan University of Technology, Isfahan, Iran.