
Abstract
The textile and apparel industry have been fundamentally changed due to technology development. However, developing countries, such as China, are falling behind for adopting new technologies. The literature suggests firm managers’ perceived benefits and costs of new technology are key variables for their motivation to adopt new technology. However, no reliable and valid scales existed to measure these constructs within the developing country context—specifically in China. Thus, the study aimed to develop scales for measuring Chinese textile and apparel firm managers’ perceived benefits and costs of new technology adoption, using the psychometric method of item response theory. After item generation, item bank development, and psychometric evaluation tested by 599 Chinese textile and apparel firm managers, the two scales were created. These scales provide an opportunity to measure Chinese textile and apparel firm managers’ perceived benefits and costs of new technology adoption, offering tools for additional technology adoption motivation research.
Advances in technology are reshaping the textile and apparel (T&A) industry globally (Wang & Ha-Brookshire, 2018). T&A firms in developed countries have an advantage of quickly and easily adopting new technology-based activities as they are already built to support knowledge- and technology-intensive industrial activities, compared to those in developing countries, such as China, whose focus is still on labor-intensive, simple, and repetitive tasks (Stone & Farnan, 2018). Though China is the largest developing country and one of the largest manufacturers and exporters of T&A products in the world, for a long time, Chinese T&A firms were engaged in owner-equipment-manufacturing (OEM) activities with limited motivation for self-innovation or technical upgrades (Sun, 2017). Therefore, advancement in technology could further intensify the gap in the industry maturity between China and developed countries. In this situation, how can one encourage Chinese T&A firms to adopt and use new technologies?
Industry practitioners pointed out that Chinese T&A firm managers are more focused on seeking short-term financial profits than those in developed countries and they are dependent on low cost-driven activities (Sun, 2017). That is, if adopting new technology would gain quick profits and reduce the cost, then firm managers would be more likely to adopt the new technology in their firms. According to Eccles et al. (1983), if an individual’s perceived benefit of doing one action is high and perceived cost is low, then the individual would have a high motivation to perform that action. Similarly, in technology adoption literature, a high level of perceived benefit and a low level of perceived cost of one technology are found to have positive influences on technology adoption behaviors (Davis, 1989; Rogers, 2003).
Then, how can one measure firm managers’ perceived benefits and costs in new technology adoption? In technology adoption literature, the concepts of relative advantage or perceived usefulness are discussed as perceived benefits, while the concept of complexity is discussed as perceived cost or efforts given in new technology adoption. However, the measurement instruments for such concepts have been inconsistent across various organizational or technological contexts, generating inconsistent explanatory abilities (Baker, 2012; Zmud, 1982). Furthermore, these concepts and theories were developed and mostly applied in Western (or mostly developed) countries, posing additional questions for their effectiveness in developing and/or Eastern countries such as China. In fact, researchers argued that, due to the differences in organizational, technological, or cultural contexts between Western and Eastern countries, directly applying the scales developed in Western countries to measure firm managers’ perceptions of new technologies in Eastern countries would be inappropriate (Atherton, 2020; Baker, 2012; Zmud, 1982). Therefore, the purpose of this study is to develop measurement scales that are valid and reliable in measuring firm managers’ perceived benefits and perceived costs of new technology adoption in the broader scope of the Chinese T&A industry.
Literature Review
Motivation to Adopt New Technology by Chinese Textile and Apparel Firm Managers
China is the world’s largest T&A producer and exporter. However, as the cost of labor, land, raw materials, and energy continue to rise, China’s T&A industry, whose primary competitive focus has been the low cost, has been gradually losing its competitive advantage. Practitioners pointed out that low cost-driven development cannot sustain China’s T&A industry, and that an innovation-driven T&A industry must be planned for the future (Sun, 2017). However, due to historical and/or cultural reasons, the Chinese T&A industry may have inadequate motivation for innovation. Chinese T&A firms have a long history of engaging in OEM businesses, and many of the technologies used in current firms have been established to accommodate mass production. As the market became competitive, Chinese firm owners still use the low price to win orders or customers, rather than changing their business strategies or investing in technological upgrades (Sun, 2017). This tendency could also be explained by Confucianism of the Chinese traditional culture (Atherton, 2020). Confucianism encourages people to be conservative in their actions and use methods with which they are familiar rather than trying something new and taking risks (Atherton, 2020). Moreover, since the majority of current T&A industry activities are still labor dependent, a large number of workers are still engaged in basic spinning, marking, cutting, sewing, ironing, and packaging processes, creating a large gap in knowledge and skills between manual and technological operation. Given the vastly different cultural backgrounds and industrial developmental levels, it is important to assess Chinese T&A firm managers’ beliefs toward perceived benefits and perceived costs related to new technology adoption.
Perceived Benefits and Costs of New Technology
In the marketing literature, Zeithaml (1988) defined perceived benefit as a positive function of what is received and perceived cost as a negative function of what is sacrificed. From the psychological perspective, expectancy-value theory (EVT), one of the most long-standing views regarding humans’ attitude, choice, and behavior in the human psychology literature (Eccles & Wigfield, 1995), posits that the individual would be more likely to do the task if the individual perceives higher benefit and lower cost of the task. Thus, in this study, the perceived benefit of new technology is conceptualized as T&A firm managers’ beliefs about the desirable status received from adopting new technology, and the perceived cost as the loss and efforts that new technology adoption may create. These two concepts are viewed to be fundamental in understanding T&A firm managers’ motivation to adopt new technology.
Perceived benefits of new technology
Eccles et al. (1983) identified three constructs of positive perceived value (i.e., perceived benefit): attainment value, intrinsic value, and utility value. In their definitions, attainment value refers to the perceived importance of doing well on a given task. Intrinsic value refers to the enjoyment or the subjective interest the individual has in the subject, which is similar to the concept of intrinsic motivation (Deci & Ryan, 2013). Conversely, utility value refers to the desired gains from doing the task, emphasizing the extrinsic motivation. To measure attainment value, Eccles and Wigfield (1995) initially developed a three-item scale in their research of adolescents’ enrollment in math courses. Items such as “How important is it to you to get good grades in math?” were used to illustrate the extent of perceived importance. Empirical studies supported that attainment value plays an essential role in human behavior. For example, Battle and Wigfield (2003) found that attainment value is a significant predictor of intention for students to attend graduate school, and Lynd-Stevenson (1999) disclosed that attainment value substantially impacts employment motivation.
For intrinsic value, EVT research has focused on the settings of education and employment. For instance, Feather and Davenport (1981) found that perceived attractiveness of employment (i.e., intrinsic value) is significantly related to individuals’ motivation to work, and Trautwein et al. (2012) found that intrinsic value is a significant predictor of students’ academic course achievement. Because the concept of intrinsic value is similar to intrinsic motivation, researchers have interchangeably used them in different research contexts, such as technology adoption. For example, Chiu and Wang (2008) concluded that intrinsic value significantly impacts individuals’ intentions to use Web-based learning services, and Teo et al. (1999) argued that enjoyment (i.e., intrinsic value) would promote individuals’ internet usage. Finally, for utility value, Eccles and Wigfield’s (1995) scale was broadly used in EVT studies. Specifically, Wiklund et al. (2003) found the positive relationship between small business managers’ beliefs of the consequences of firm grow (i.e., utility value) and their motivations to expand their firms.
In terms of technology adoption behavior, utility value is also discussed in technology adoption literature, such as diffusion of innovation (DOI) studies and technology acceptance model (TAM) studies. DOI explains how, why, and at what rate new ideas and technologies spread through organizations (Rogers, 2003). Particularly, relative advantage, defined as the degree to which an innovation provides more benefits than its precursor (Rogers, 2003), is considered one of the key characteristics of new technology influencing one’s adoption behavior. DOI researchers suggested that new technologies with a clear advantage in increasing efficiency, economic benefits, convenience, and satisfaction are more easily adopted and implemented (Taylor & Todd, 1995). In comparison with perceived benefits discussed in EVT, relative advantage could be interpreted as the potential utility value from using new technology.
Similarly, TAM considers perceived usefulness (PU) of new technology as one of the key factors for individuals’ adoption behavior. Davis (1989) argued that people tend to use an application to the extent they believe it would help them perform a job better. PU refers to the subjective prospect that specific technology would increase job performance within the organization (Davis, 1989). That is, if individuals have a high expectancy that one new technology would help their performance, they would be more likely to use this technology. Therefore, PU is an important perceived benefit in the context of technology use, reflecting utility value in EVT literature.
Perceived costs of new technology
In EVT literature, perceived cost is regarded as having three key constructs: effort cost, opportunity cost, and psychological cost (Perez et al., 2014). Effort cost refers to the amount of effort given for being successful at a task. Opportunity cost refers to the loss that occurs when engaging in one activity prevents an individual from participating in other valued activities. Psychological cost refers to the mental suffering related to engaging in one activity, such as anxiety of performing the activity or fear of failure of the activity.
First, effort cost has been commonly discussed in the literature. For example, Flake et al. (2015) found that effort cost is an obstacle that impedes students’ motivation for college classes. Similarly, Battle and Wigfield (2003) found that effort cost would significantly and negatively predict college women’s intention to attend graduate school. Factors such as time and amount of work put forth to engage in the task were included in the measurement scales. In technology adoption research, TAM discusses part of effort cost by using the term perceived ease of use (PEOU). PEOU refers to the extent to which an individual considers that making use of a specific technology would be effortless (Davis, 1989). TAM explains that if new technology is perceived to be easy to use, the technology would be more likely accepted and utilized by the users (Davis, 1989). At the organizational level, DOI points out that the effort cost for new technology adoption can be assessed by complexity, the extent to which new technology would be relatively difficult to understand or use (Rogers, 2003). If the technology is perceived complex to use by new users, the intention to adopt the new technology decreases.
Next, Battle and Wigfield (2003) described opportunity cost as the perceptions of lost time for alternative activities. Later, Flake et al. (2015) described it as a missed chance for alternative activities. Their research showed that the loss of valuable alternatives is significantly correlated with humans’ motivation. Also, Spiller (2011) found that individuals would consider opportunity cost when they perceive resource (e.g., time, money, etc.) constraints. Therefore, opportunity cost should be considered if adopting one new technology takes up resources and impedes the firm to perform other valuable activities.
Finally, psychological cost, or mental effort, has been found significantly and negatively correlated with students’ motivation for class taking in the domain of education (Battle & Wigfield, 2003). The findings suggested that mental suffering would reduce individuals’ passion for activity engagement. This mental effort is also similar to the complexity that was discussed in DOI studies, as illustrated by Moore and Benbasat’s (1991) items to measure psychological cost, including “using a Personal Work Station requires a lot of mental effort” and “using a Personal Work Station is often frustrating.”
Figure 1 shows the conceptual model for the study as a result of the literature review. In this study, perceived benefits refer to Chinese T&A firm managers’ beliefs about the desirable status resulting from adopting new technology. Specifically, perceived benefit has three salient constructs—attainment, intrinsic, and utility values. Attainment value refers to the perceived importance of adopting the new technology. Intrinsic value refers to the enjoyment or subjective interest in adopting the new technology, and utility value refers to the extrinsic value or usefulness in practice. In addition, perceived costs refer to the loss, suffering, and efforts given due to the new technology adoption. Specifically, effort cost refers to the amount of effort given for adopting the new technology. Opportunity cost refers to the firm’s loss of participation in other valued activities as a result of adopting the new technology. Psychological cost refers to the mental suffering related to adopting the new technology.

Conceptual model generated from literature.
Scale Development: Item Response Theory Approach
Based on the conceptual model, the study followed the 3-step process of scale development suggested by item response theory (IRT): item generation, item bank development, and psychometric evaluation (Revicki et al., 2014). IRT is a research design and analysis paradigm that attempts to capture the relationship between an individual’s response to an item and the individual’s level of the latent trait being measured by the scale. Different from traditional factor analysis that has been broadly used in previous technology adoption literature, IRT provides a clear and robust picture of the performance of each item in the scale and how the scale functions overall for measuring the latent trait, which could help determine the scale’s adequacy as an instrument to measure the latent trait (Reeve & Fayers, 2005).
Step 1: Item Generation
To generate items, we reviewed the EVT, DOI, and TAM literature for items that have the potential to measure perceived benefits and perceived costs. Items that have been broadly used in the past to measure the salient constructs for perceived benefits and perceived costs, or similar concepts (e.g., relative advantage and complexity of technology), were identified and sorted within the item bank. This process resulted in 79 items for perceived benefits and 43 items for perceived costs. Second, considering the items were generated in various research domains, all of these items were reviewed again and modified to reflect the study’s research context. For example, the item “using a Personal Work Station improves my image within the organization” was modified to “using the new technology will improve my firm’s image within the industry” to capture the firm managers’ perceived attainment value of new technology. Likewise, the item “using a Personal Work Station requires a lot of mental effort” was modified to “using new technology will require a lot of mental effort” to measure their psychological cost of new technology. Items that have seemingly less connection with or are difficult to fit into the current study’s research context were removed. This process yielded 65 items for perceived benefits and 41 items for perceived costs. Item sources and distributions are shown in Table 1.
Item Source and Distribution.
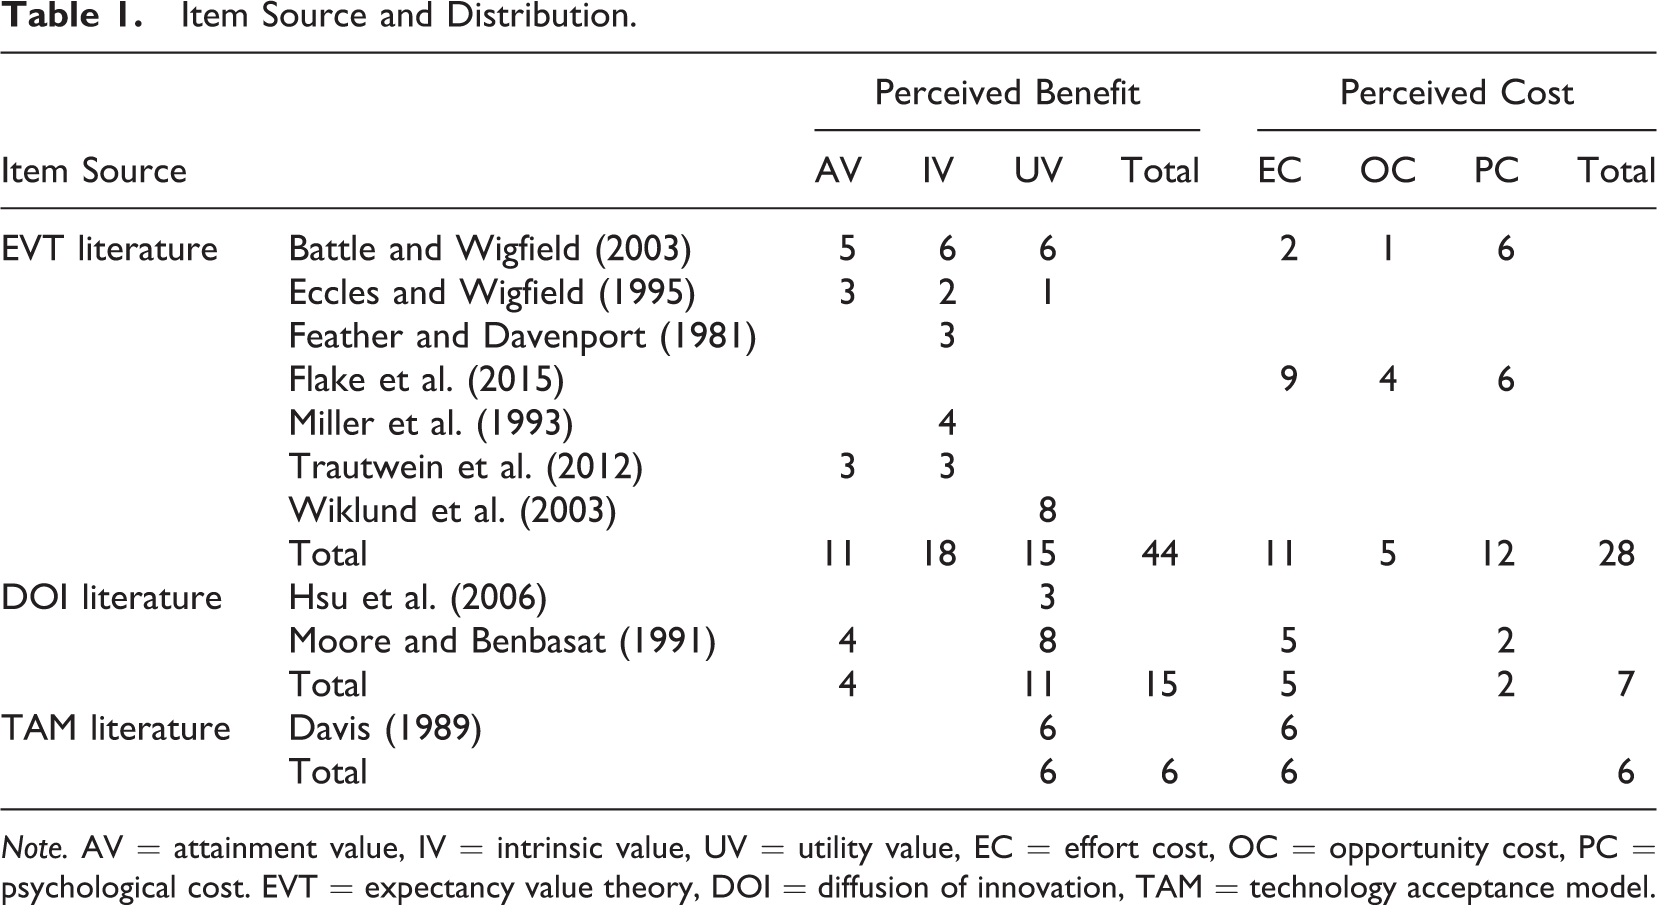
Note. AV = attainment value, IV = intrinsic value, UV = utility value, EC = effort cost, OC = opportunity cost, PC = psychological cost. EVT = expectancy value theory, DOI = diffusion of innovation, TAM = technology acceptance model.
At this point, all literature we consulted was printed in English, given all of the measures were developed and tested in English. Since Chinese T&A firm managers are the main research subject population, all the items generated in the previous steps were translated to Chinese by the lead author who is a native Chinese speaker. Back translation from Chinese to English was also performed by a professor in a major mid-Western university in the U.S., who is a Chinese-English speaking person, to ensure the accuracy of translation. There were no major revisions to be made. The rest of the steps were made with the items in Chinese.
Step 2: Item Bank Development
At the item bank development stage, a series of qualitative sub-phases, namely binning, winnowing, content expert validation, item revisions, and cognitive interviews, were conducted to organize and evaluate the items (DeWalt et al., 2007). First, during the binning phase, items were systematically grouped according to content similarity. Next, within each bin, redundant items or those that were confusing were removed from the item banks, following the protocol of winnowing (Revicki et al., 2014). For example, the item “因为其他活动,我的公司没有足够的时间采纳新技术 [Because of other activities, my firm does not have enough time for adopting new technology]” was deemed to be context specific and redundant with the item “采纳新技术需要大量的时间 [adopting new technology would demand too much of time],” and thus was deleted from the item bank. This process resulted in the deletion of 17 items from the perceived benefit bank and 12 items from the perceived cost bank.
Third, for content expert validation, nine Chinese T&A firm managers were recruited to conduct online interviews. They were asked to assess whether items in the item banks were comprehensive and adequately reflected the decision-making process of new technology adoption. All of the participants worked at the level of department manager or higher, such as director, business partner, or owner. They were required to have decision-making authority and have at least a year of working experience in the T&A industry. They were asked about [in Chinese]: (a) their opinions regarding each item and its connection with new technology adoption; (b) the extent to which the items represented their real-life experiences; (c) the wording and vocabulary of the items; and (d) any conceptually repetitive or missing items. As a result, a total of 11 items of perceived benefits and 12 items of perceived costs were further deleted from the item banks due to redundancy, limited association with the construct, and lack of clarity. In addition, two experts emphasized that, because following the government’s policy is especially important in firms’ operation in China, firm managers would perceive technology adoption (or attainment value) as important if it is suggested by the government. In this light, a new item, “采纳新技术符合政府的政策或建议 [Adopting new technology would fit with the government’s suggestion or guidance],” was added into the item bank of perceived benefits.
Fourth, item banks were further revised to provide a consistent set of response options within each item. A four-point or six-point Likert scale is recommended because it encourages the participants to avoid taking a neutral stand (e.g., central point) and helps the IRT model avoid misestimating the measured latent trait (Bode et al., 2003). Since four-point Likert scale has adequate measurement ability and requires a low sample size in IRT analysis (Gumpel et al., 1998), four response choices from “strongly disagree” to “strongly agree” were designed for each item. Finally, to ensure content validity of the two item banks and to make sure all the items were easy to understand, another 10 Chinese T&A firm managers were recruited for cognitive interviews. Each of them was asked to complete the survey that included items of perceived benefits and perceived costs. After that, a structured interview was conducted, asking each participant to reflect on each item as well as the whole survey. Feedback from participants suggested that the overall survey was clear and easy to understand.
Step 3: Psychometric Evaluation
The two item banks of perceived benefits and perceived costs were then empirically tested for their psychometric properties. To give the survey participants a clear understanding of what is meant by new technology, the following definition was given in the beginning of the survey: “The new application of scientific knowledge that can work for practical purposes and has not been used in the firm before, including hardware (i.e., machinery and equipment) and software.” This was intentionally done to avoid creating measurement scales that are specifically designated for a certain type of new technology. Rather, we wanted to create measurement scales that can be used in a broader context of technology.
Empirical data for this stage were collected from December 2018 to January 2019 via Wenjuanxing, a China-based market research firm that has its own panel of survey respondents representing a general sample of the Chinese population. Survey participants were recruited from diverse textile and apparel firms whose main business types fall within one or more supply chain functions of T&A product design, product development, manufacturing, retailing, etc. This was done to ensure the scales developed from this study could be applied to various types of T&A businesses within the sector. Participants were required to work at the level of department manager or higher for at least one year to ensure that they have adequate knowledge and a role in the decision-making process of new technology adoption. A total of 2,147 participants were invited to participate in the online research survey and 599 completed and returned it within 4 weeks. A sample size of 10 participants for every item was considered a general rule of thumb to determine the overall sample size in IRT research (Revicki et al., 2014). Since each item bank had no more than 60 items, a total of 599 participants seemed to be acceptable for this study.
Statistical analyses were then conducted in R-Studio by using analysis packages of multidimensional item response theory (mirt) and procedures for psychological, psychometric, and personality research (psych). The graded response model was selected to estimate items’ psychometric properties, as it allows discrimination to vary by item and can offer a flexible framework for modeling the participants’ responses (Revicki et al., 2014).
Sample description
The ages of all participants ranged from 21 to 60 years, including 311 males and 275 females (see Table 2). More than half (53.1%) were aged 31-40, and 35.9% aged 21-30. The largest group of the participants (47.1%) had 1-5 years of working experience in the T&A industry, followed by 6-10 years (39.7%). All participants acknowledged that they had a role in the decision-making process if their firms or departments considered adopting new technologies. In terms of the firm type, a total of 277 (46.2%) participants reported they came from textile firms and 322 (53.8%) from apparel firms. According to China’s National Bureau of Statistics’ standards of firm size, the majority of firms were mid-sized (45.3%) and small-sized firms (40.9%), while 8.3% of firms were large-sized firms and 5.5% were micro-sized firms.
Sample Description of Psychometric Evaluation.
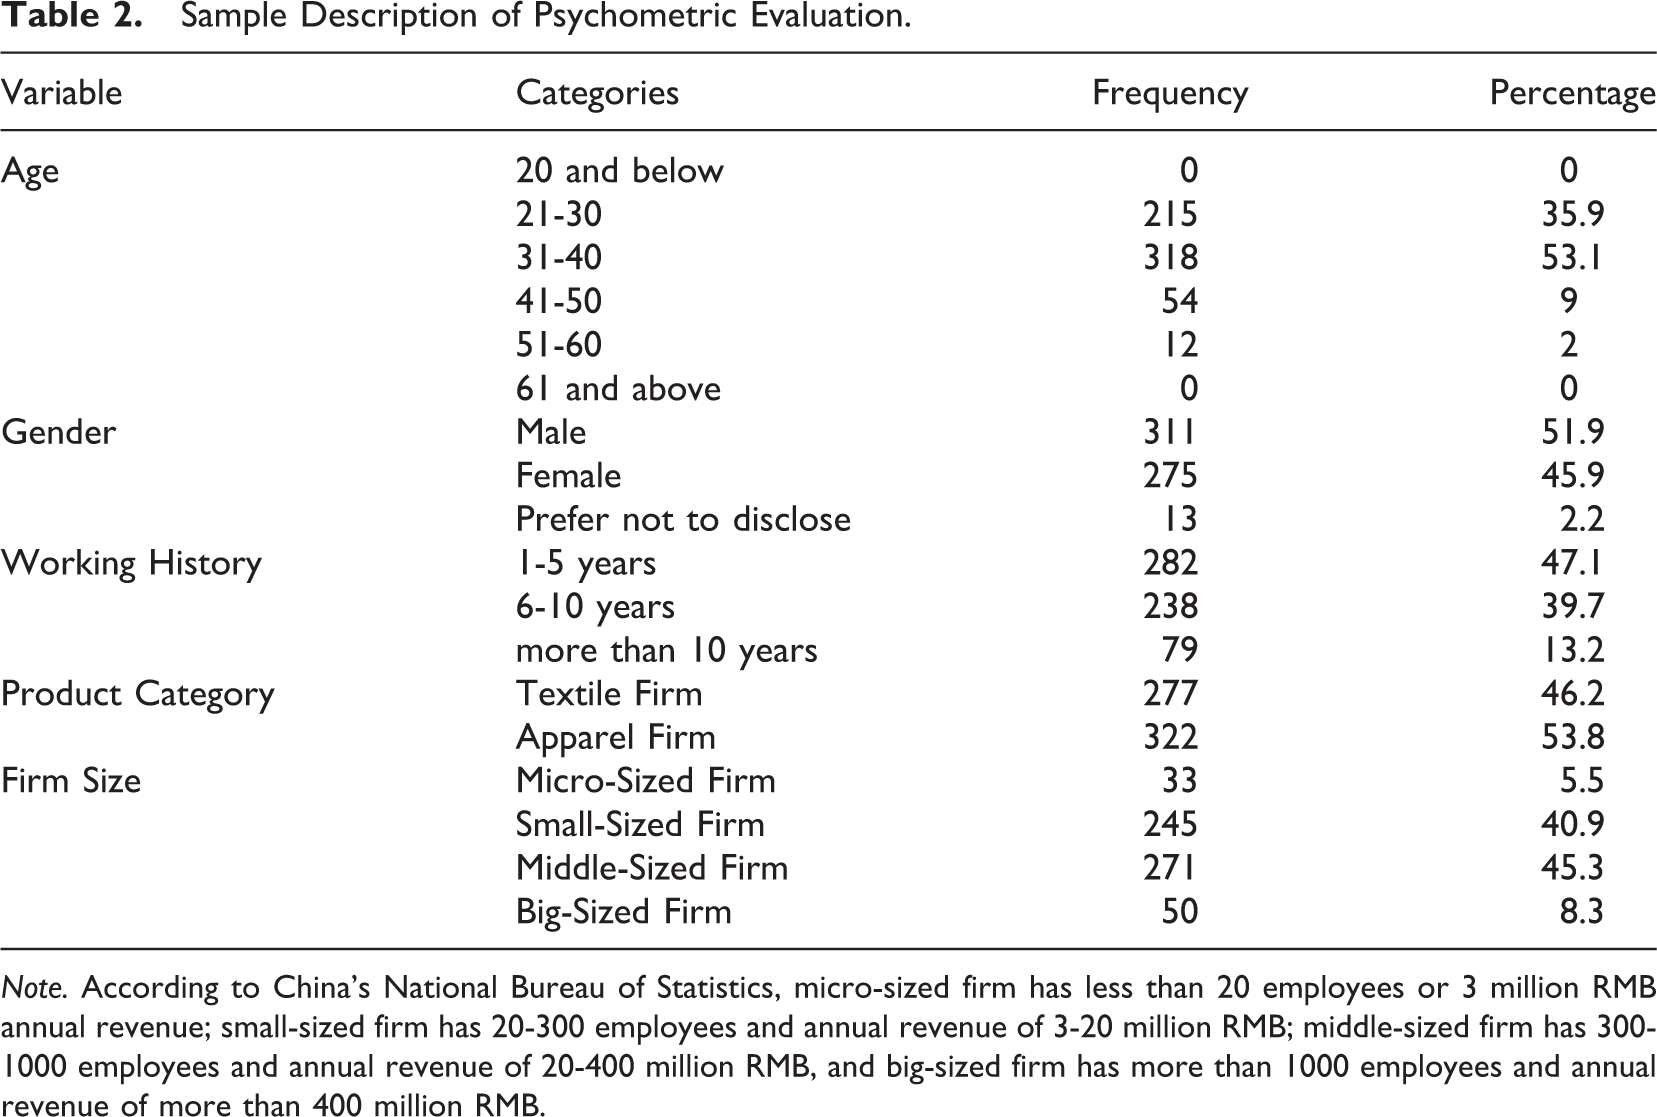
Note. According to China’s National Bureau of Statistics, micro-sized firm has less than 20 employees or 3 million RMB annual revenue; small-sized firm has 20-300 employees and annual revenue of 3-20 million RMB; middle-sized firm has 300-1000 employees and annual revenue of 20-400 million RMB, and big-sized firm has more than 1000 employees and annual revenue of more than 400 million RMB.
Initial item bank analysis
The initial item bank of perceived benefits consisted of 37 items, represented by 6 items for attainment value, 10 items for intrinsic value, and 21 items for utility value. The item bank of perceived costs consisted of 18 items, represented by 9 items for effort cost, 1 item for opportunity cost, and 8 items for psychological cost. As the first step, the three critical IRT assumptions—monotonicity, unidimensionality, and local independence—were tested within each of the two item banks (De Ayala, 2013). First, monotonicity suggests that the probability of endorsing an item measuring a particular latent trait (i.e., perceived benefit or perceived cost) should increase as the underlying level of the dominant factor increases (Revicki et al., 2014). It can be assessed from a nonparametric item response modeling process called Mokken Scaling (Mokken, 2011). The results indicated that participants with high perceived benefits or perceived costs tend to choose a high score response category in each benefit or cost item, confirming the assumption of monotonicity.
Second, unidimensionality requires that items should represent a single underlying construct or latent trait (i.e., a perceived benefit or a perceived cost) in each item bank (De Ayala, 2013). It is often determined by using principal component analysis (PCA) (Revicki et al., 2014). Using the criterion of eigenvalue greater than 1, PCA yielded ten principal dimensions for the item bank of perceived benefit, accounting for 52.77% of the total variance, while three principal dimensions were detected in the item bank of perceived cost, accounting for 52.93% of the total variance. The initial results showed the violation of unidimensionality assumption. Finally, the assumption of independence asks that all the item responses are uncorrelated after controlling for the latent trait (De Ayala, 2013). LD X2 is a commonly used testing index (Revicki et al., 2014). According to Choi et al. (2014), if the LD X2 index is above 10, the item pairs need to be further examined for possible local dependence. In this study, out of 703 item pairs in the item bank of perceived benefits, only 57 pairs’ LD X2 indexes were less than 10; out of 171 item pairs in the item bank of perceived costs, only 8 pairs’ LD X2 indexes were less than 10, indicating the existence of local dependence among items in the two item banks.
Item reduction
Given the violation of the unidimensionality and local independence assumption from the previous procedure, additional item reduction was performed. IRT researchers suggested that item pairs with local dependence need to be flagged and stepwise dropped during the item reduction process (Reeve & Fayers, 2005; Revicki et al., 2014). Thus, item pairs with the highest LD X2 index were first flagged. The items with general or ambiguous meaning, or had cross-loading on multiple dimensions, were deleted from the item pairs. After the item reduction, the IRT assumptions for the altered item banks were assessed again. We repeated this process until all the assumptions were met. This process yielded a total of 29 iterations performed in the item bank of perceived benefits and 10 iterations performed in the item bank of perceived costs. By meeting all of the assumptions, especially the unidimensionality, all items in the scales developed in this study were integrated as one overall construct, perceived benefit or perceived cost and each construct had one principal dimension.
Final item bank assessment
All of the previous processes yielded the final scales of perceived benefits and perceived costs. The scale for perceived benefits consisted of a total of 8 items, represented by 1 item for attainment value, 3 items for intrinsic value, and 4 items for utility value. The final scale of perceived costs consisted of a total of 8 items, represented by 4 items for effort cost, 1 item for opportunity cost, and 3 items for psychological cost. See detailed information in Tables 3 and 4.
Final Scale of Perceived Benefits and Parameter Estimation.

Final Scale of Perceived Costs and Parameter Estimation.

The IRT model fit was assessed by using M2 statistics. The result indicated a good fit of the data to the model, suggesting that the model well replicated the observed reality in each item bank. At the item level, S-X2 was used to assess the fit of each item (Revicki et al., 2014), and all in both item banks were acceptable. The discrimination parameter of the final item bank of perceived benefits ranged from 0.87 to 1.47, and the item bank of perceived costs ranged from 1.31 to 2.07. Considering that the suggested value for discrimination was from 0.8 to 2.5 (De Ayala, 2013), all 8 items in each item bank were deemed to have acceptable discriminating power to measure participants’ perceived benefits and perceived costs of new technology.
Reliabilities of the final scales were assessed by checking the amount of information available from the item banks derived from item information function (IIF) (De Ayala, 2013). Higher information denotes more precision (or reliability) a scale has in discriminating individuals among the latent traits. In Figure 2, the amount of information generated from the scale of perceived benefits reached the high position and stayed within the range of about −3 to +2, which means the perceived benefit scale was more reliable to assess participants’ perceived benefit (from approximately 3 standard deviations below to 1 standard deviation above average level). Similarly, the amount of information was high from the range of approximately −2 to +2 in the perceived cost scale, meaning the perceived cost scale was more reliable to assess participants’ perceived cost (from approximately 2 standard deviations below to 2 standard deviations above average level). From the classical test theory perspective, the Cronbach’s α of the perceived benefit scale was .74 and that of perceived cost scale was .91. In addition, to gauge the impact of demographic variables on the final scales’ measurement ability, a test-fairness test was conducted on both scales by using the TSW likelihood ratio (Revicki et al., 2014). The findings disclosed that both scales generate same or similar results when testing participants from different groups of age, gender, product category of firm, and size of firm, which fits the goal of the study—creating the measurement scales that fit in a broader industry context of the Chinese T&A industry, rather than focusing on a specific technology or a specific industry sector.
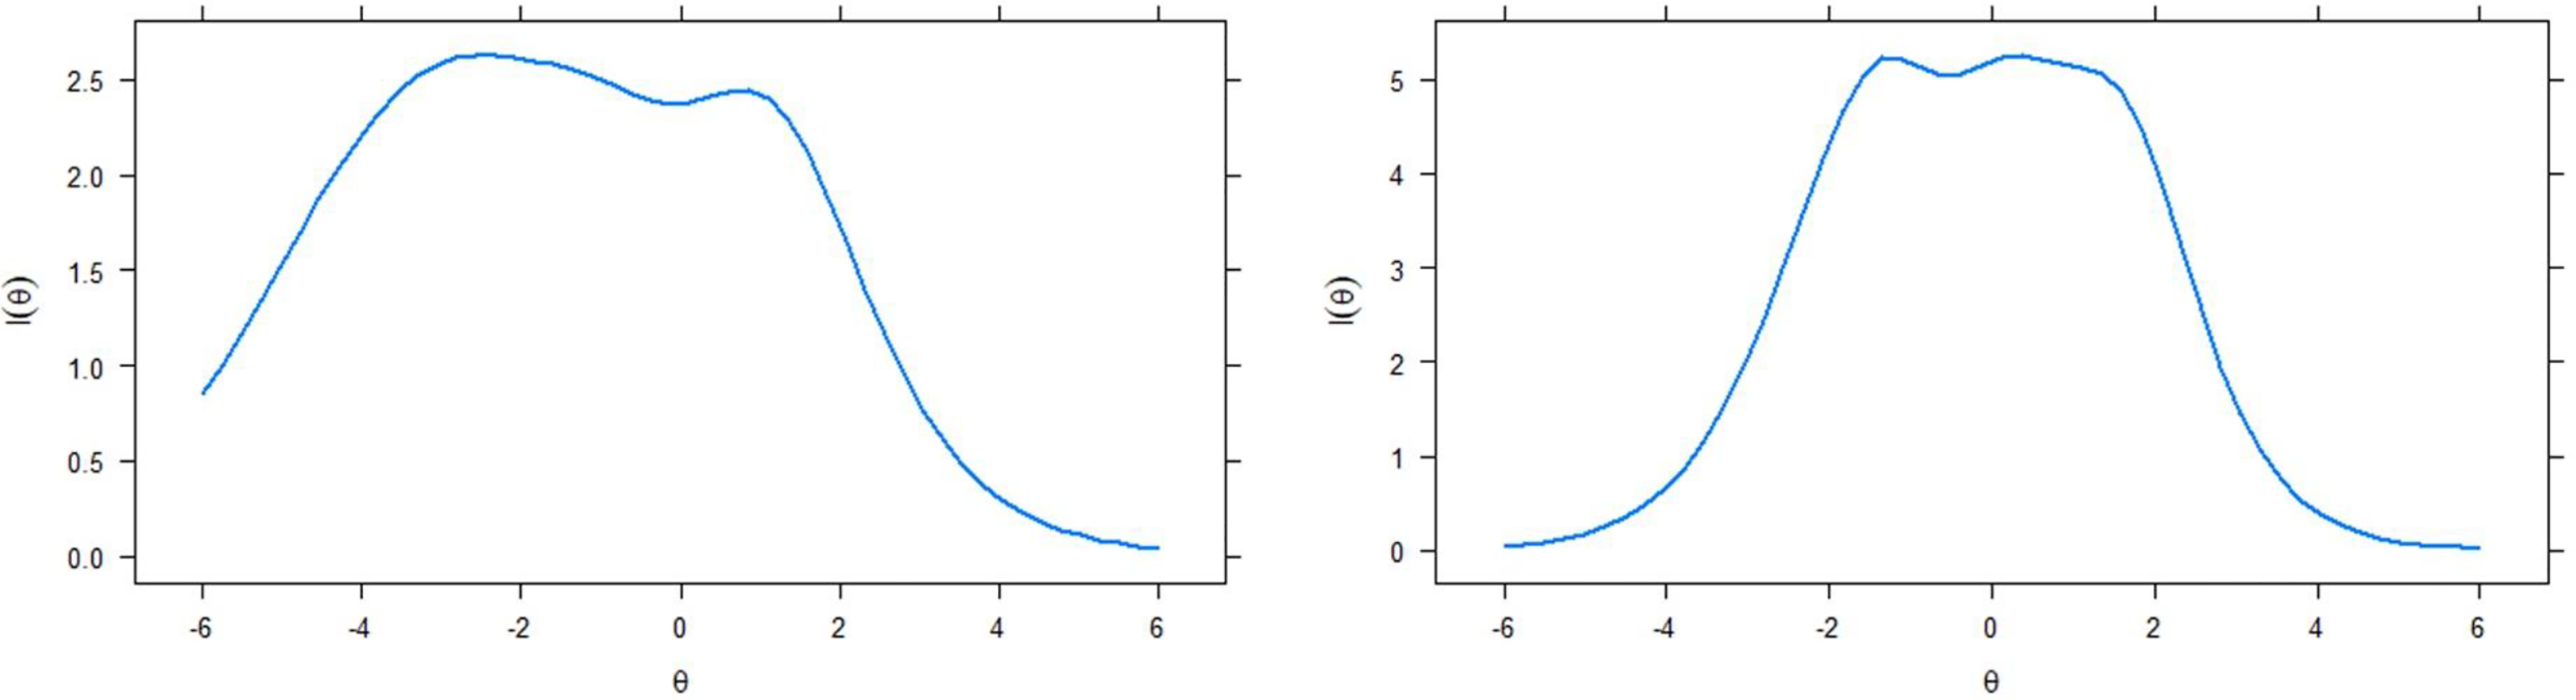
Item information function of the scale of perceived benefits (left) and perceived costs.
Finally, convergent validity was assessed and confirmed by checking the correlation between the final scale of perceived benefits (or perceived costs) and firm managers’ motivation to adopt the new technology. As suggested by EVT, a high score in a perceived benefit toward one new technology would lead to a high score of motivation to adopt this technology, and a high score in a perceived cost would lead to a low score of motivation. The Gu et al. (2009) scale (α = .89) was borrowed to measure the score of motivation in this research. The coefficient of Pearson correlation showed significant association between the overall scores of perceived benefit items and motivation scores (r = .51, p < .01) and between the overall scores of perceived cost items and motivation scores (r = − .18, p < .01). The results suggested that the final scales are valid to assess perceived benefits and perceived costs.
Conclusions
This study created the scales of benefits and costs of new technology adoption perceived by Chinese T&A firm managers within the Chinese T&A industry context. Guided by the psychometric method of IRT, the study was conducted in three key steps: (a) item generation, (b) item bank development, and (c) psychometric evaluation. The result reveals that the scale of perceived benefits had 8 measurement items with Cronbach’s α of .74, and the scale of perceived costs had 8 measurement items with Cronbach’s α of .91.
More specifically, the scale of perceived benefits developed from this study had three salient constructs, which were attainment value, intrinsic value, and utility value. Unlike the perceived benefit scales used in DOI and TAM literature, this scale reflected China’s unique context in which strong government policy influences firm managers’ behavior (Yusuf, 1994) by including an item that asks about following the government’s guidance as an attainment value. The scale also contained the intrinsic value, or specifically psychological needs, of new technology, which was limited in previous technology adoption literature. Rather than gaining financial benefits or increasing job efficiency (Reeve, 2014), improving work quality, increasing the ability to have control over work, and building external networks were captured in this study as the utility value of perceived benefits. Because China is the largest T&A product producer in the global T&A supply chain, it seems legitimate for Chinese T&A firm managers to highlight quality improvement in new technology. In addition, reflecting the Chinese culture of relationship building, or guanxi (Blair & Chareunsy, 2018), network building was captured as one of the perceived benefits for new technology adoption.
Consistent with DOI and TAM literature, the perceived cost scale created in this study highlighted the three latent constructs— effort cost, opportunity cost, and psychological cost—yet, with unique Chinese contexts. Specifically, effort cost was described in terms of time, workload, and money in this study, while previous studies discussed ease of use in their discussion of effort cost (Moore & Benbasat, 1991). This suggests the low cost-driven nature of the T&A industry in China. Furthermore, firm managers in China are more sensitive to what they spend on adopting new technology than those in developed countries. Time spent on adopting new technology was also highlighted in opportunity cost, because adopting new technology would take time away from other activities, while previous literature had limited discussion on that topic. Psychological cost was described by items such as worries about wasting money in new technology adoption and pressure generated by adopting new technology. Interestingly, mental suffering was captured as a perceived cost, which is consistent with the finding of Kiefer (2005).
The study findings have several important contributions and implications. First, the study creates reliable and valid scales for measuring Chinese T&A firm managers’ perceived benefits and perceived costs of new technology, filling a critical gap in the literature. While the existing measurement instruments for such concepts have been inconsistent across various organizational or technological contexts (Baker, 2012; Zmud, 1982), test-fairness assessment showed that age, gender, product category of firm, and the size of firm have no significant impact on the scales’ measurement ability. Thus, the two scales are deemed to have consistent measurement abilities and be suitable to measure Chinese T&A firm managers’ perceived benefits and perceived costs of new technology in various industry contexts.
Second, the two scales could help assess Chinese T&A firm managers’ motivations to adopt new technology in the future. Currently, limited research is available on Chinese T&A firm managers’ motivation to adopt new technology, probably because most of the technology adoption theories and scales were rooted and developed in the developed country context. This research first created scales that were developed and tested based on the perceptions of China’s T&A firm managers. Using these scales, future researchers can explore the ways on how to improve firm mangers’ perception of new technology adoption in terms of benefits and costs.
Third, the research supports the usefulness of IRT and provides insights for scale development in the literature on technology adoption. Different from traditional factor analysis, IRT can provide a clear picture of the performance of each item in the scale and how the scale functions overall for measuring the latent trait. For example, the reliability test of perceived benefit scale indicated the scale would be more suitable to be used by Chinese firm managers who have a low perceived benefit of new technology. In fact, China’s T&A industry is still at the infancy stage for adopting new technology, which may have influenced the firm managers to score low on perceived benefits of new technology. Methodologically, this study enables researchers in other developing countries to apply the new approach (i.e., IRT) to examine T&A firm managers’ perceived benefits and costs of new technology in the local context.
Fourth, the scale items developed in this study could also provide insights to technology providers. In order to promote new technology distribution, technology providers need to address the concerns identified in the technology development process. For example, firm managers showed their interests in the new technology’s functions of improving work quality [e.g., “使用新技术能够提升工作质量 (Using new technology would improve the quality of work)”], enhancing job control [e.g., “使用新技术能够提高对工作的控制力 (Using new technology would give control over work)”], and building business network [e.g., “使用新技术能够增进公司与商业伙伴的关系 (Using new technology would enhance the relationship between my firm and its business partners)”]. Thus, technology providers need to consider having these functions in their new technology product.
Finally, the scale items could help the government make policies or plans to promote new technology adoption in the Chinese T&A industry and hasten the industrial upgrade processes. For example, financial cost and human mental suffering were highlighted in firm managers’ concerns about new technology adoption. To relieve T&A firms’ financial burden and reduce the shortage of qualified new technology users, the government may be able to make policies such as remitting taxes for new technology adopters and offering public service or training programs to unskilled industry workers.
The study also has several limitations. First, the study developed scales only within the context of the Chinese T&A industry, which may lead to an external validity concern for generalizing these scales into other countries or non-T&A industries. Future new technology adoption research involving firm managers from other countries or industries should take caution in applying the item development process and psychometric evaluation process for specific research contexts. Second, items developed in this research were tested only in Chinese, which may have caused changes in meanings or dropping of relevant items in the translation process. Third, because each scale shows one dimension of perceived benefits or costs, employing partial items to measure latent construct alone is not recommended. Fourth, further research can examine firm managers’ perceived benefits and costs in the context of one specific type of firms or technologies, which may have particular concerns in new technology adoption. Fifth, a test-retest reliability was not assessed in this study. Therefore, a longitudinal research is recommended to retest scales’ psychometric properties with the same participants, which could provide further evidence of the scales’ reliabilities and validities.
Footnotes
Declaration of Conflicting Interests
The author(s) declared no potential conflicts of interest with respect to the research, authorship, and/or publication of this article.
Funding
The author(s) received no financial support for the research, authorship, and/or publication of this article.