
Abstract
Fashion color trends are an essential marketing element that directly affect brand sales. Organizations such as Pantone have global authority over professional color standards by annually forecasting color palettes. However, the question remains whether fashion designers apply these colors in fashion shows that guide seasonal fashion trends. This study analyzed image data from fashion collections through machine learning to obtain measurable results by web-scraping catwalk images, separating body and clothing elements via machine learning, defining a selection of color chips using k-means algorithms, and analyzing the similarity between the Pantone color palette (16 colors) and the analysis color chips. The gap between the Pantone trends and the colors used in fashion collections were quantitatively analyzed and found to be significant. This study indicates the potential of machine learning within the fashion industry to guide production and suggests further research expand on other design variables.
Color trends are an essential tool and important factor affecting consumers’ purchasing decisions in the fashion business (Cassidy, 2012; Choi et al., 2012; Eckman et al., 1990). Color-related keywords have become increasingly critical for marketing with the growing influence of Social Network Services (SNSs; Shin et al., 2018), and consumers are becoming more sensitive to keywords and hashtags associated with color trends. Companies with fashion brands, therefore, seek to apply this interaction to increase merchandise sales (Wong et al., 2016). Traditionally, fashion color trends have been influenced in a top-down manner as trends are set within the industry and then showcased by the collections presented in major fashion hub cities such as Paris, New York, Milan, and London (Jackson, 2012; Kim et al., 2013).
According to the book Fashion Forecasting by Divita (2019), most fashion companies often utilize consultants or subscribe to color trend analysis reports. For color analysis, color experts observe events that form the spirit of a particular period and analyze the media to determine consumers’ interests. They examine new and unique ideas about social, economic, fashion, interior, and entertainment magazines, as well as the runways in Paris, New York, Milan, and London, in particular, as essential analytical factors (Divita, 2019). Considering all these factors has allowed researchers to identify new color trends (Hope & Walch, 1990).
The new color trends work 18–24 months before the season to inspire the creative process of fashion designers. To begin work in advance, the color experts rely on their knowledge of color theory. Furthermore, they use observation techniques to track trends and recognize new directions by combining various elements of human behavioral culture, museum exhibits, popular music, movies, and art. Numerous information is needed to predict and analyze color trends (Divita, 2019). Color trend analysis scans the media and discovers trends through observation. Trend analysis depends on the ability to determine trends in a given period. For the trend analysis, the experts search for changes in the population structure, industrial and market structure, consumer interests, values and motivations, innovations in technology and science, and economic conditions. Expanding these efforts and using a more systematic approach for observation and analysis is the first step in trend analysis.
In the digital age, where information is generated infinitely, there are more elements to grasp. In particular, processing and analyzing overflowing fashion image data can help analyze trends. While previous color analysis studies have applied diverse variables, such as culture, economy, and environment, this study quantitatively defines color trends through a methodology that uses 2D fashion images, which are easily accessible and offer extensive data.
Quantifying and objectively measuring trends that are announced by a few top designers and color experts is a complicated task (Kindred, 2015). However, machine learning has influenced many aspects of the fashion industry. Trend cycles in fashion are very short, but with the assistance of machine learning technology, trends can be analyzed quickly and quantitatively with reliable results (Choi et al., 2012). Therefore, the use of big data or machine learning has become essential for analyzing fashion trends.
In summary, the main research objective is to provide more accurate color trend information for the fashion industry through a quantitative method using machine learning. The following research steps were taken. The study objective is to (a) confirm the potential of machine learning in fashion research based on the literature review of existing color analysis studies within the fashion industry, (b) find a machine learning library that can efficiently analyze large amounts of 2D fashion image data, and (c) extract new trend color chips from fashion collections using quantitative methodology. Subsequently, this research aims to establish trend analysis guidelines that can be applied in the fashion industry.
Literature Review
Color Trend Analysis and Fashion
When designers showcase a “special color” on the runway, magazines may subsequently introduce the “special color” as a trend, and apparel retailers begin to sell products incorporating this “special color.” This cycle in the fashion industry is commonly known as a color trend (Stephens, 2002). When fashion designers plan products, their reliance on intuition has its limitations. Therefore, it is necessary for designers to have access to quality research and interpretation of color trend analysis. In the past, color trend analysis has been controversial in the retailing community because it relies on an analyst’s subjective and emotionally oriented evaluation. However, color analysis has become increasingly important due to its influence in fashion marketing and forecasting. Hilliker and Rogers (1988) noted that color analysis is a useful selling tool and has a significant impact on sales. Trends are general directions and movements that occur at certain times and have a pivotal impact on the fashion industry (Stone & Farnan, 2018). Therefore, fashion brands preferentially analyze trend information when preparing fashion collections (Brannon, 2010), and color is one of the important factors in this process (Kim et al., 2013).
Color forecasting helps manufacturers and retailers introduce new product lines while avoiding revenue losses resulting from products that consumers are not ready to purchase. Color trends represent the direction of such color palettes. When creating a trend, changing color saturation or creating a new color is called the “direction.” Color forecasting has a strong directional signal when several identical trends are seen during the same period (Eiseman, 2006). Customers of color forecasting services include clothing supply chain companies (fiber manufacturers, factories that produce yarn and textiles, brand product manufacturers, retailers) that sell in the private sector and manufacturers with high clothing production. These customers require information regarding color trends to determine consumers’ tastes and preferences long before the sales season (Divita, 2019; Eisman, 2006).
How then are the color trends decided? First, companies such as Pantone forecast which color palettes will be in trend by considering various current factors such as social issues, weather, and the environment (Cunningham, 1996; Kim et al., 2013). In 1963, Pantone developed the PANTONE® MATCHING SYSTEM® by Lawrence Herbert and began producing standard color books to avoid the tendency to perceive colors differently. Since 2000, Pantone has annually released a “Color of the Year.” The PANTONE VIEW Color Planner is published 2 years before each season to introduce its new color trend forecast. Pantone’s forecasts are used not only in the fashion industry but also in graphic design, cosmetics, and interior design. Sample books, provided to companies in advance, present forecasted colors with their associated converted color codes (RGB, HTML, and CMYK) and specific names (Pressman, 2019).
Yarn companies then apply this color palette in the manufacturing of raw materials and fabrics. This in-trend fabric is used by fashion brands to design fashion products and collections that will be presented to journalists and those employed in the industry. Fashion magazines and media subsequently introduce these colors to a wider audience, mainly formalizing the colors that have been featured on the runway that season (Wickett et al., 1999). Finally, pre-production brands design products that are based on the color trend, which eventually reach the general consumer (Bhardwaj & Fairhurst, 2010; Choi et al., 2012).
When industry-leading brands present their collections at fashion shows, the collections are usually announced in two seasons: spring/summer (s/s) and fall/winter (f/w; Kim et al., 2013). Most leading brands follow a 24-month cycle, in which the color trends are set 2 years ahead of each season. This 2-year lead-time is essential to allow for the dyeing and manufacturing of a collection’s primary fabrics before the collection can be designed. Color trends are delivered to fashion designers and fashion houses 6 months prior to the season (Keiser et al., 2017), and designers select fabrics and colors according to these pre-defined trends before planning and designing. After the fashion shows, the in-trend colors are introduced by fashion magazines and related media to the wider industry and consumers using collections from the fashion shows as a reference (Stephens, 2002).
Color trend analysis is essential for retailers and has become a huge business as brands need a basis for color trends to sell fashion products in the latest colors. During the design process, color plays an important role in product planning, as it is also vital to marketing (Jones, 2005). Color trend analysis is a crucial part of the process because the release of consumer-desired products at the right time directly affects brand sales (Kim et al., 2013). Over the years, the acceptance period for fashion products and the pace of trend changes have become shorter and faster, making trend analysis much more challenging (Najjar, 2019).
In the following section, we discuss the possibility of developing analysis models using sales data or historical data, and how fashion companies have been using machine learning methods to investigate data patterns.
Fashion Data Analysis and Machine Learning
Fashion data analysis is an upcoming topic that is being actively discussed in the academic field and fashion industry. As significant data-based decision-making is conducive to efficient management, global fashion companies are racing to introduce the active use of big data (Acharya et al., 2018; Jain et al., 2017). Overall, analysis companies maintain the most significant volume of fashion data in the world (Thomassey et al., 2005). For instance, Stylumia gathers data about how consumers perceive a specific brand from social media networks, including Facebook and Instagram, regarding the brand’s retail status, and analyze the data through machine learning to inform the brand’s business strategy. Stylumia operates subscription access to the analysis software, which provides a summary of market trends and forecasts a product’s life cycle. “GoFind.AI” is another fashion data service that searches products in photos provided by consumers (and similar item results) and in online catalogs using an image data analysis application. Furthermore, one study used data collected from the image-sharing platform Instagram to predict the success of fashion models using machine learning frameworks (Park et al., 2016). These companies collect online data in real time, inform fashion brands of the latest trends, help them stand out from their competitors, and analyze appropriate pricing structures for their clients’ products.
With this in mind, a new interdisciplinary field of “fashion informatics” has emerged, which refers to machine learning, social network analysis, and using computer vision in the fashion industry. Fashion informatics requires the analysis of large amounts of fashion-related text and image data using computer technology (Zhao & Min, 2019). For example, fashion brands can analyze big data from consumer posts and comments on social media to plan sales strategies, forecast trends, and recommend personalized products.
Image data analysis using computer vision is being actively researched in the fashion informatics field (Zhao & Min, 2019). In the fashion industry, content based on visual images from blogs, social networking sites, and advertising images are generated repeatedly, accumulating vast amounts of potential data for image analysis. Researchers in the field of computer vision are becoming more interested in the application of image data analysis to the fashion industry. Previous studies have demonstrated the potential of fashion image analysis using computer vision (Berg et al., 2010; Parikh & Grauman, 2011). Specifically, Berg et al. categorized clothing items using machine learning. Parikh and Grauman went a step further by not only analyzing the clothes people wore, but also automatically interpreting and categorizing their jobs. Through analyzing colors in photographs, one computer vision library captured differentiated information and estimated the age of historical color photographs (Palermo et al., 2012). Cyril Diagne’s Business of Fashion project, which was introduced by Experiments with Google in November 2018, used machine learning to extract and visualize color palettes based on 70,000 pieces of data taken from fashion collections between 2013 and 2017 (Vittayakorn et al., 2015).
Human parsing aims to divide human images into parts as accurately as possible and is one of the main topics in the field of computer vision. It is a pixel-level predictive operation that requires an understanding of individual images at both global and local levels (Luo et al., 2018). Human parsing is available in a variety of areas, and some related research has been conducted in the fashion sector (Zhu et al., 2017). In this study, we adopted a machine learning algorithm from the Macro-Micro Adversarial Network (MMAN), which was developed by Ywayi Luo and his research team (Luo et al., 2018). MMAN is one of the machine learning algorithms designed using the Generative Adversarial Network. Using MMAN, the research team (Luo et al., 2018) improved the localization, semantics, and consistency of the label map, which allowed the separation of clothes, backgrounds, and model from one image. Based on what we learned from MMAN, we were able to analyze our datasets using 30,462 pre-trained models to produce meaningful results (Luo et al., 2018). MMAN divides images that are entered as input data into elements such as hat, hair, gloves, sunglasses, upper clothes, dress, coat, socks, pants, jumpsuits, scarf, skirt, face, left-arm, right-arm, left-leg, right-leg, left-shoe, right-shoe, and background. The segmented images are mapped to a specific color for each element.
Through this literature review, we examined the analysis result of fashion image data using machine learning to define color trends in fashion. Although fashion informatics has many possibilities, many of the studies we examined took an engineering approach. The engineering approach involves studying only technical issues—how much data can be analyzed, how quickly, and how accurately—without interpretation of why fashion images are essential in the fashion industry and how data can be used in the industry. The fashion approach is necessary to analyze what information is needed based on fashion design and industries. Now that the fashion industry is at the forefront, further research on fashion informatics is needed using a fashion approach.
Method
For this study’s analysis, we conducted the following processes: (a) obtained large-scale image data by web scraping 2019 s/s collection images, (b) automatically parsed the garment component of each image using machine learning, (c) clustered the representative colors of the garment to extract color chips, and (d) compared similarities between these color chips and those specified by Pantone in its Color Planner.
Web Scraping Image Data
Runway images of the 2019 s/s ready-to-wear collections were collected using Python from the official Vogue magazine website (vogue.com). This particular site was used because it contains images of collections that later influenced consumer fashion trends. We web scraped 8,403 runway images from 212 brands and used 8,338 images. Images were selected after two screening processes. First, only the images taken on the runway were chosen. Next, images containing other subject matters, such as the crowd and designers, were filtered out.
Human Parsing and Machine Learning
In this study, human parsing was used to automatically separate the human body and clothing from web scraped images, and to analyze the clothing colors. After separating test data into individual elements using MMAN, we were able to remove unnecessary components (face, hands, legs, etc.) while leaving only the necessary clothing-related items. The MMAN source code devised by the Ywayi Luo research team is open to the public. This algorithm used PyTorch and Look into Person (LIP) datasets to conduct learning and process our data. The algorithm that learned the published LIP data allowed us to easily separate the clothing elements of images from big volume data. Clothing was separated from the body by excluding the skin area using MMAN. The background of the image, exposed arms or legs of the model, and non-essential clothing were removed using algorithms. The hat element was also removed, because it was not always distinguishable from the model’s hair and would therefore reduce accuracy. The background was made transparent for accurate color clustering.
Color Chip Extraction
For color chip extraction, we used k-means from a powerful machine learning library called scikit-learn. The scikit-learn library provides a variety of classification, regression, and cluster algorithms, including supported vector machine, random forest, gradient boosting, k-means, and DBSCAN (Density-Based Spatial Clustering of Applications with Noise; Arthur & Vassilvitskii, 2007).
K-means was chosen to allow automatic determination of clusters of similar colors in the human-parsed clothing images. We used k-means clustering because most previous studies that separated colors also used this method. Although Kohonen Network Clustering performs classification using a primary neural network, the algorithm’s fundamental operating method is similar to k-means. Also, when used in general situations, k-means is faster and considered appropriate for researchers with lower equipment specifications (Hidayati et al., 2014; Maheshwari et al., 2009). Two-step clustering is an algorithm that uses the associations between input data to proceed with optimization. The pixel value within the image is independent. For RGB values, the two-step algorithm is judged to be less useful because it acts as a basic factor in the color field. In addition, the random initialization of k-means was performed, and the new color chip extracted using k-means, but the results did not change. Since the randomness of k-means has only a small impact on the results, it was considered reasonable to use this method. To find the optimal number of clusters, we randomly selected 100 images and determined how many colors were used in each image. Up to four colors were used, and the test changed the number of clusters to 4–8. The results showed the highest accuracy when using four clusters. Research from the Business of Fashion project also set the number of clusters at four (Diagne, 2019). The k-means algorithm repeatedly finds the central location of the cluster and the cluster to which each piece of data belongs. K-means determines an arbitrary number of points set by the user as “k.” The cluster is then updated by calculating the distance from the center to each piece of sample data and assigning each data point to the nearest center point. The center point is then moved back to the average position of the selected data points at each center point, which is repeated until there is no change in the center point. When the center of the ith cluster is u i , and the set of points belonging to the cluster is s i , the overall variance is calculated using the following process. Finding s i that minimizes this value is the goal of the algorithm (Wagstaff & Cardie, 2001).
The initial u i was randomly set (Step 1). This step is often performed several times by changing the value of u i . Depending on the initial value, the performance of k-means varies. Therefore, to optimize the initial value, k-means++ was used (Arthur & Vassilvitskii, 2007). One drawback of k-means is the problem of “selecting random points” when the algorithm is first executed. For example, if any point is too densely clustered, the cluster will not update correctly. K-means++ is an algorithm that complements this problem and finds a set of center values that are distant to make the initial point selection. Once k-means++ was in use, the following steps (Steps 2 and 3) were repeated. The algorithm calculated the Euclidean distance from the data to the u i of each cluster, finding the nearest cluster and allocating the data (Step 2). Finally, it calculated and reset the u i by calculating the mean value of the data in each cluster (Step 3). The repeated process ends when there is no change in the cluster. In addition to using the cluster color chips, we added an accurate visual representation of the color proportions from each image.
With k-means, the main colors present in the image with RGB values converge primarily with the dominant RGB values. For example, if the dominant color is black, dark gray will be absorbed into a cluster that is most similar to the figure in the RGB. If the dominant color is black, and the color is white, the difference in the RGB value is large, so colors are then divided into different groups. Therefore, a color may or may not be extracted depending on the similarity of the color’s RGB value. For fashion collections, pre-learning of data has shown that the color range does not particularly vary; on average, four colors are used. Based on this information, the dominant group (= k value) was set to 4, and the value was automatically collected using k-means. The proportion of color chips depends on the cluster range of colors. The steps involved in human parsing and color chip extraction are shown in Figure 1.

(1) Using human parsing to segment elements in the image, (2) separating clothing from segmentation, and (3) clustering color chips according to ratio.
Measurement of Similarity With Pantone Trend Colors
The CIEDE2000 color-difference formula was applied through the Python-colormath library to calculate Delta E values (CIE, 2001). CIEDE2000 is an advanced algorithm that solves problems related to the inadequate perceptual uniformity issue found in CIE94 (Sharma et al., 2005). Delta E values are often used as an industrial standard to calculate color similarity. Before programming, the RGB value was changed to CIELAB color space. The standard of Delta E for human perception is provided in Table 1 (Mokrzycki & Tatol, 2011).
Standard on Color Similarity.
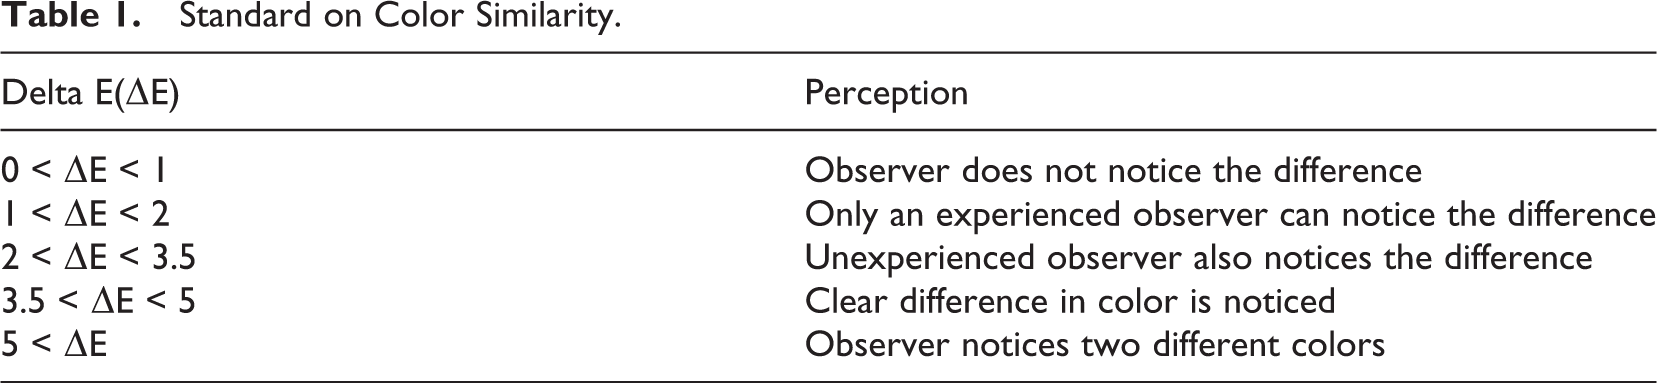
The most frequent color was Brown Granite, given that the similarity of colors using Delta E was less than two. An example of calculating similarity is shown in Figure 2.

Similarity calculation of color chip #1848.
Results
Out of 8,403 total pieces of data, we used 8,338 images. As noted previously, the removal of 64 images was necessary due to incorrect element segmentation. Most removed images presented problems with distinguishing clothes from background due to similar color tones (white on white) or intricate clothing details (print).
Successful human parsing images were accurately separated from the clothing elements. From 8,338 pieces of parsed data, the garment colors were divided into four clusters, which produced a total of 33,352 color chips (Figure 3). The visual ratio in the color chips is consistent with the garment colors from the image data.
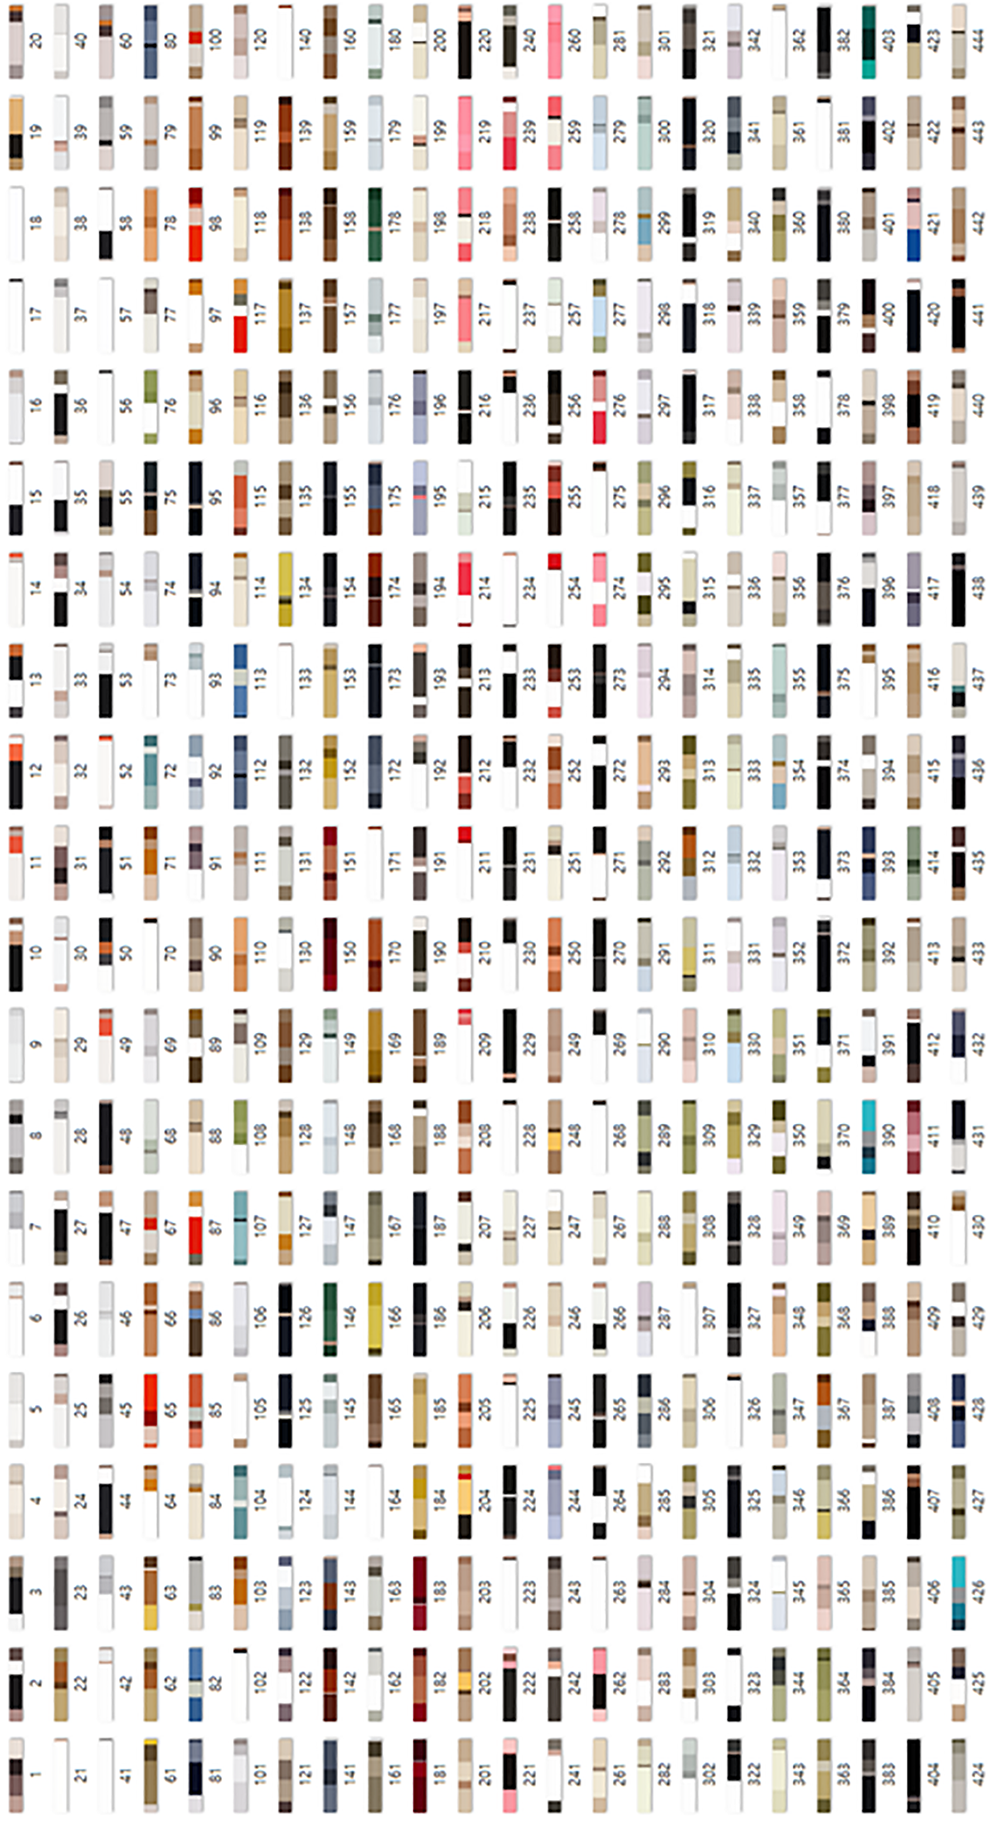
Examples of extracted color chips.
We compared the extracted color chips (33,352) to Pantone’s 2019 s/s trend color palette: Fiesta, Jester Red, Turmeric, Living Coral, Pink Peacock, Pepper Stem, Aspen Gold, Princess Blue, Toffee, Mango Mojito, Terrarium Moss, Sweet Lilac, Soybean, Eclipse, Sweet Corn, and Brown Granite. Based on the color information provided by Pantone, the FHI Cotton TCX RGB or FHI Polyester TSX RGB value was used for the analysis (color name and value used are copyrighted by Pantone).
According to the standard established by the CIE (International Commission on Illumination), if the value of Delta E was less than two, the color was considered similar. The colors Living Coral, Pink Peacock, Aspen Gold, and Mango Mojito were not used at all based on the standards defined by this study. The results are provided in Figure 4.
Percentage of pantone colors used in the 2019 s/s collections.
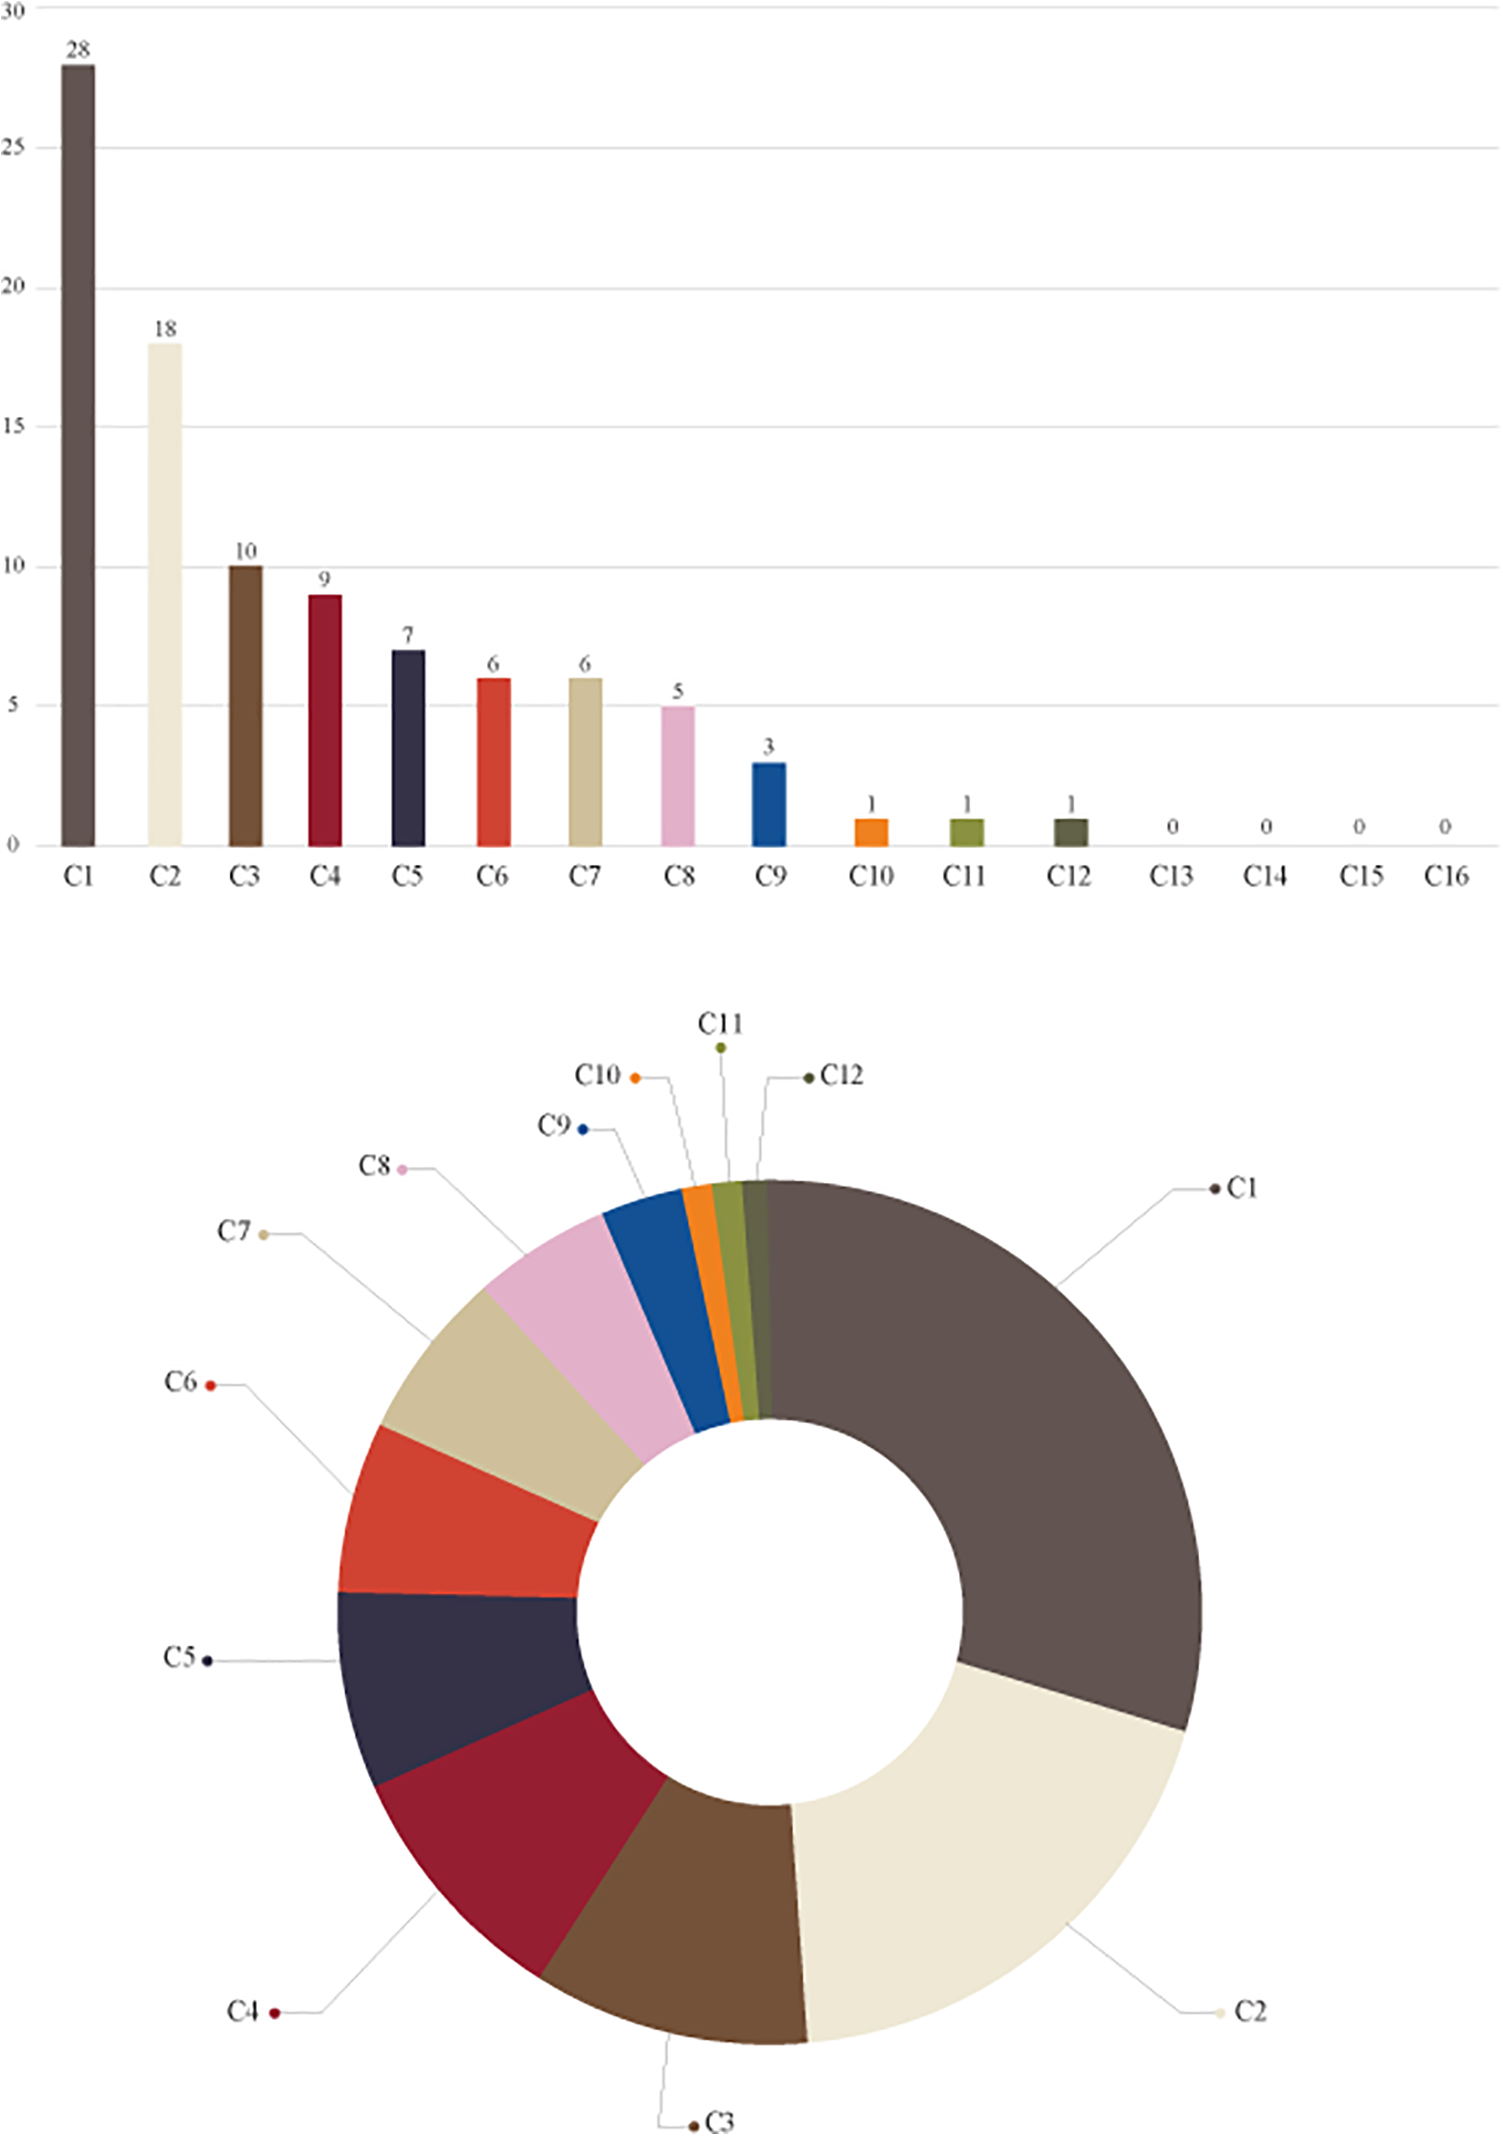
To derive the ranking of colors that are commonly used in fashion collections, color chip data were re-clustered using the k-means algorithm to form clusters of similar colors. Frequently used color chips were extracted in ranked clusters of 10, 20, and 30. The method for selecting the rankings followed the same process used for the k-means algorithm extraction of the 33,352 color chips previously described in the Methods section. The color ratio shown in Figure 5 is proportional to the colors used in the fashion collections. The smallest cluster set extracted the primary colors such as black, dark gray, white, and beige, so we defined clusters of 10, 20, and 30 to present a variety of results. Although the inclusion of more clusters could identify different colors, the present research drew only 10–30 rankings, because this number was sufficient to compare color similarities with Pantone color chips.

Color ranking frequently used in the 2019 s/s collections (from top to 10, 20, and 30 clusters).
In-Depth Interviews With Fashion Designers
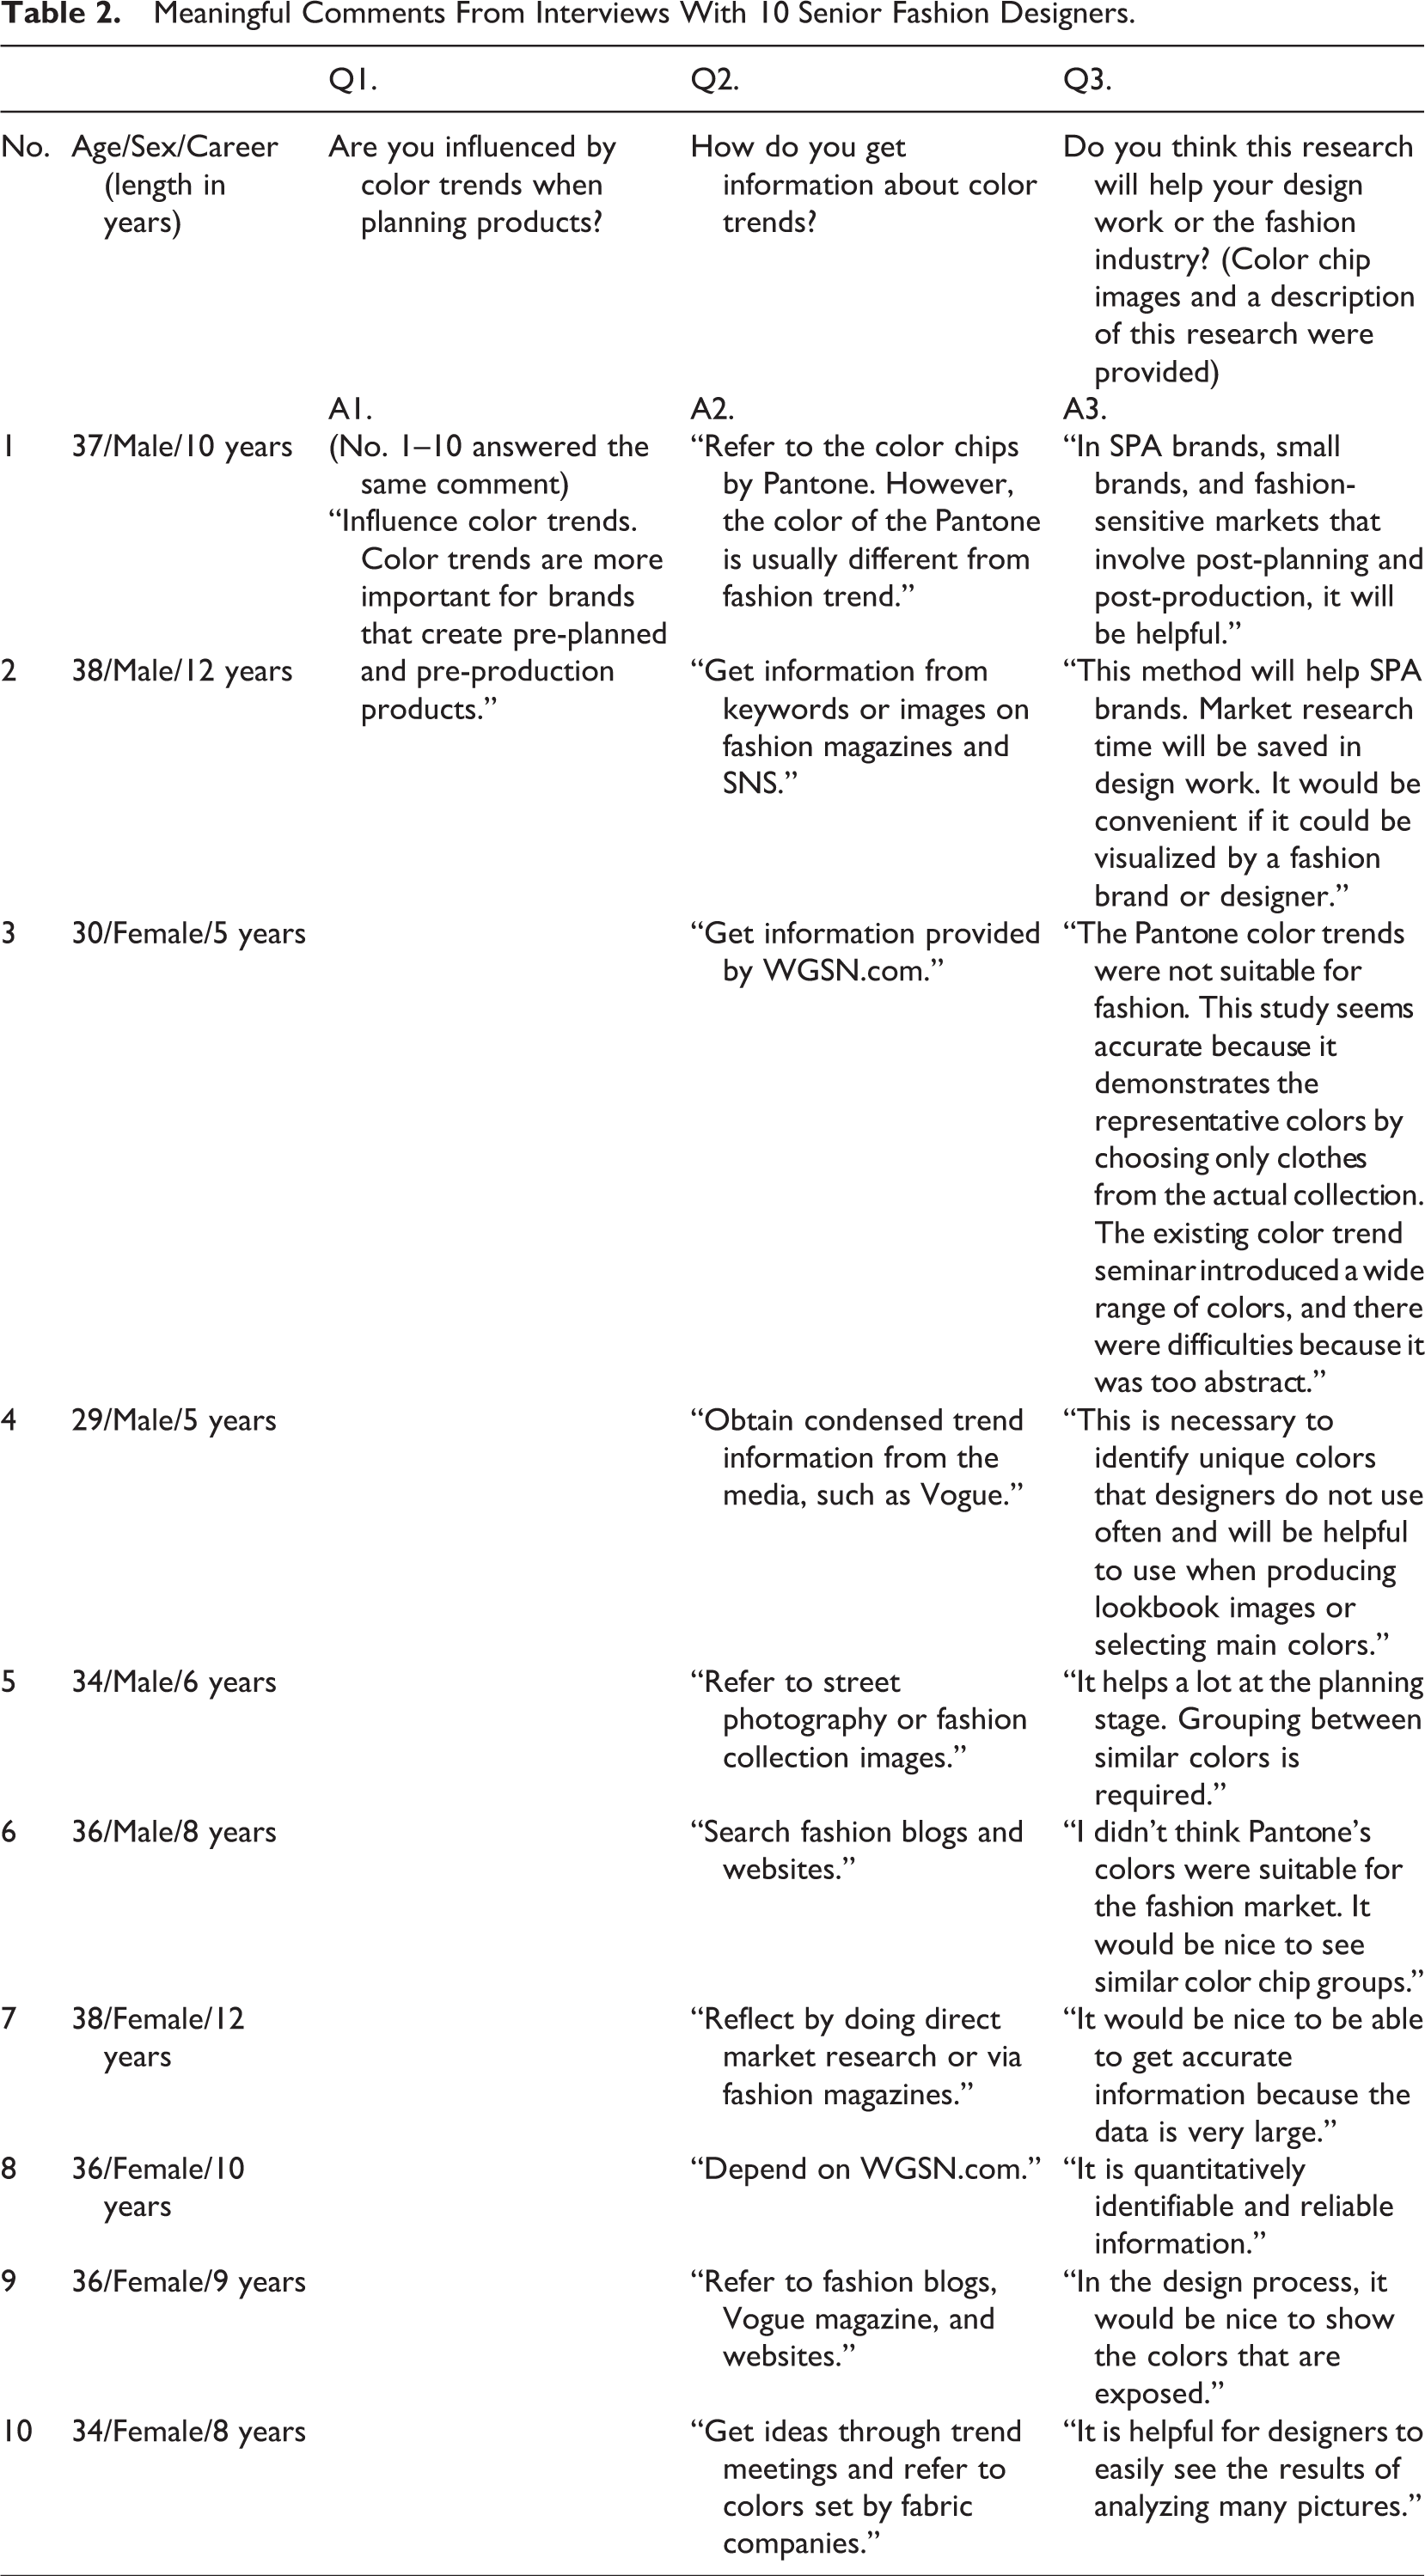
We interviewed 10 senior fashion designers to confirm the novelty and contribution of this research for the fashion industry and design process. The goal of the interviews was to discover how designers use color trends and might apply the research findings in a practical situation. The interviews were conducted in an open-ended process; each participant had 20 min to freely answer three questions (Table 2). Based on the interview results, we confirmed that our research is helpful in the fashion design process. Fashion designers said they could save time by using our methods, especially during the market research process. During post-production for fashion brands, the product planning schedule is tight; thus, quantitative results based on the analysis of enormous amounts of data can be beneficial. The designers’ meaningful comments were extracted from the interviews, and the conversation was reconstructed, as shown in Table 2.
Meaningful Comments From Interviews With 10 Senior Fashion Designers.
Discussion
The theoretical contribution of this study is that it presented a new methodology in color trend research. In the fashion sector, color trend studies have been related to significant color marketing aspects of top designers’ color preferences or cultural differences in various countries. In particular, the existing color trend analysis and color prediction studies discussed ways to subjectively suggest color palettes based on various variables or factors. The present study contributes to the existing literature by quantitatively analyzing and visualizing a large amount of data using a new approach.
We quantitatively analyzed the color trends of the 2019 s/s season ready-to-wear collections using human parsing and machine learning technologies. This research notably indicated that major fashion designers did not use the 16 color trends specified by Pantone as frequently as had been expected. That is to say, the color trend results from the fashion collections did not reflect many of the trend colors introduced by Pantone. For example, fashion magazines and other fashion media had introduced Living Coral as one of the in-trend colors for s/s 2019, but similar colors were rarely used in the actual fashion collections.
In the fashion industry, color trends have been subjectively determined by experts. Under the standard top-down approach, color trends are introduced to consumers through media such as fashion magazines. With the Pantone-appointed color palette in mind, editors select specific clothes from fashion shows in Paris, New York, Milan, and London that are congruent with this palette and introduce them in trend-related articles. However, in this study, we were able to automatically analyze a large volume of clothing images from all four major fashion shows to analyze the most frequently used and in-trend colors. Of course, expert opinion plays a vital role in the fashion sector, but trends have a direct impact on business, and therefore, need to be approached in a more objective manner. Quantitative analysis is becoming more critical because of the growth of social media. Consumers are generating massive amounts of image data, and with the growing number of influencers on social media, the “authorities” who dictate what is trendy have become more diverse. Top designers or institutions previously had the strongest mandate to lead fashion trends; however, influencers and consumers are gaining more power to express their preferences through diverse and representative channels. Therefore, it is necessary to introduce a data analysis method to the fashion business that can respond in a variety of ways by using machine learning.
In-depth interviews with senior fashion designers confirmed that this type of data analysis could provide valuable assistance to fast fashion or high-street fashion brands. These businesses are heavily influenced by fashion collections, as opposed to fashion brands with the capacity to pre-plan production. In particular, adding information related to materials and patterns would increase the usefulness of such data in fashion product planning.
The findings of this research can contribute to the use of fashion images in market trend analysis. In particular, the method of automatically extracting and clustering features from images is useful in the fashion business. Our methodology can analyze color trends from a new perspective and includes a similarity analysis. By changing the color similarity setting, we were able to cluster pink tones (such as coral pink and hot pink); fashion designers could use this method when grouping color variations. We also suggested the potential use of machine learning in fashion research. Machine learning technology provides researchers with the opportunity to utilize image data for quantitatively analyzing vast amounts of fashion image data. As our research methods are neither costly nor time-consuming, they are suitable for fast-changing fashion environments and can adapt to rapidly changing trends. Lastly, if fashion companies take advantage of this approach, it could benefit their sales strategies. The interviewees commented that our program could be used as a sales strategy to decide the quantity of predicted popular items and respond more quickly to changes in market trends. This research undoubtedly offers useful insights for the fashion business and its marketing tactics.
Conclusion and Future Work
This paper suggested a scientific process, in which 2D image data can be parsed using machine learning and the colors used in fashion collections can be confirmed. In particular, we discussed the gap between Pantone’s color trends, which are often mentioned in the media, and the colors used in fashion collections. However, there are two technical limitations in this study. First, this study overlooked the potential that color differences between the actual garments and the images are influenced by the photographic environment, such as light and shade. Second, there was a lack of data pre-processing to increase accuracy in component segmentation of clothing images. The preceding models developed from the MMAN team mostly used mundane photographs from daily life. Specifically, data were often misrepresented in this study when designs deviated from the standard category of general clothing. Moreover, it was challenging to categorize items of clothing due to countless variations in design and the pose of the model. For example, a long, unstructured jacket was incorrectly categorized as wide pants. Since the MMAN team developed additional data to enable users to create and learn, further research will allow greater accuracy by learning the fashion shows images in large quantities and performing image data pre-processing. Nevertheless, the present research results remain useful for the fashion industry.
The method used in this study can be expanded in three ways in future work. First, it is possible to analyze fabric patterns and fashion silhouettes. Even if specific colors are in trend, patterns can also play an essential part as variables of fashion design. For example, if leopard patterns are considered trendy following the season’s collections, leopard-print items should be rapidly produced by fast fashion brands. Therefore, a detailed analysis of patterns is required; it is possible to analyze images to extract and classify similar patterns using computer vision and machine learning. Automatically defining fashion styles and silhouettes may also be possible using machine learning methods. Second, it is possible to study algorithms that recommend color chips according to regions and cultures by analyzing color marketing data using machine learning. Understanding the color preferences of each region and culture through historical sales data can provide customized fashion colors that are expected to be in high demand. Third, information visualization utilizing the color chips should be investigated. The design process could be shortened if designers visualized color chips to more easily deliver trend information. The results of this research provide the groundwork to further expand the trend analysis process in the fashion industry.
Footnotes
Author’s Note
Ahyoung Han is now affiliated with SANGMYUNG University.
Declaration of Conflicting Interests
The author(s) declared no potential conflicts of interest with respect to the research, authorship, and/or publication of this article.
Funding
The author(s) received no financial support for the research, authorship, and/or publication of this article.