
Abstract
The Affordable Homes Program (AHP) is a prison work crew program managed by the Minnesota Department of Corrections (MNDOC). To examine whether AHP has increased postrelease employment, lowered recidivism, and reduced costs to the State of Minnesota, this study uses a retrospective, quasi-experimental design in which propensity score matching was used to control for observable selection bias. The results show that during the 1998-2008 period, AHP (a) built 285 affordable homes, (b) significantly increased offenders’ odds of obtaining postrelease employment in the construction field, and (c) produced US$13.1 million in costs avoided. It did not, however, significantly reduce recidivism.
Introduction
The Affordable Homes Program (AHP) is a prison work crew program managed by the Minnesota Department of Corrections (MNDOC). AHP trains offenders in the construction trade while they are serving time in prison. Working in coordination with local nonprofit agencies, teams of offenders build or remodel low-income homes in Minnesota. There are two key objectives to the program. First, the program is designed to increase affordable housing in Minnesota. Second, it provides inmates with occupational skills to help them secure employment following their release from prison.
A review of the literature suggests that at least two other states have state-run prison work programs that operate similarly to AHP. Michigan’s Prison Build program and the Texas Department of Criminal Justice’s partnership with Habitat for Humanity provide offenders with opportunities to gain construction skills by building homes for low-income families. Although both are similar in scope to AHP, currently no published evaluations have been completed.
Evaluations have been published, however, on programs that are broadly similar to AHP. Prison industry programs often provide an experience similar to working on a factory line (e.g., sewing uniforms, manufacturing license plates, or assembling a variety of products). Because the main objective is to produce a product, helping offenders gain mastery (or certification) in a trade is seldom given much emphasis in prison industry programs or is, at best, a secondary focus. In contrast, the main objective of prison-based vocational programs is to assist inmates to earn certification in a specific trade (e.g., carpentry or computer repair). The goal of prison-based vocational programs is to provide training that prepares individuals for employment in specific jobs or industries (Lawrence, Mears, Dubin, & Travis, 2002).
AHP is similar to a prison industry program in that participants produce a product—newly built or remodeled homes. Yet, unlike prison industry programs, AHP participants receive training designed to help them find postrelease employment in a specific industry (construction), which is more akin to a prison-based vocational program. Still, despite this similarity, AHP is different from prison-based vocational programs in several ways. For example, in helping offenders achieve trade or industry certification, prison-based vocational programs often provide in-depth classroom-based training in a broader range of vocational skills (e.g., electrical, painting, cosmetology, carpentry, computer repair, welding, and so on). AHP, however, has a narrower focus because it provides experiential, hands-on training in the community, exclusively in the construction trade, but does not focus on helping offenders achieve certification. Moreover, whereas vocational programs are housed wholly in the prison or jail from which they operate, offenders in AHP are housed in county jails where they can travel more easily to the communities in which they will be working for the day. Last, AHP serves only felony-level offenders who have been sentenced to prison, whereas many of the vocational programs evaluated nationwide have incorporated lower-risk offenders who were on probation or serving jail sentences for less severe offenses.
Previous Research on Prison Industry and Prison-Based Vocational Programs
Because AHP shares some similarities with prison industry and prison-based vocational programs, we will concentrate on evaluations of these types of programs in our review of the literature. As noted by Wilson, Gallagher, and MacKenzie (2000) in their meta-analysis of corrections-based education, vocation, and work programs for adult offenders, most evaluations have focused on vocational programs whereas few have examined the effectiveness of prison industry programs. Of the existing studies, almost all have examined recidivism, several have examined legitimate labor market participation and wages, and at least one has conducted a cost–benefit analysis (Aos, Miller, & Drake, 2006). Although plagued by methodological limitations, most notably a scarcity of randomized or strong quasi-experimental designs (Wilson et al., 2000), the results from this body of research have been promising. Indeed, the evidence generally suggests that vocational and industry programs increase employment, reduce recidivism, and provide monetary benefits to crime victims and taxpayers (Aos et al., 2006; MacKenzie, 2000; Seiter & Kadela, 2003; Wilson et al., 2000).
In their meta-analysis, Wilson and colleagues (2000) reviewed 17 studies examining the effectiveness of vocational training programs. Altogether, these programs reduced recidivism by 22%. Moreover, of the eight studies that included employment as an outcome measure, Wilson et al. (2000) reported that program participants were twice as likely to find postrelease employment. In their meta-analysis of correctional programming, Aos et al. (2006) reported a recidivism reduction of 9% among the four prison-based vocational programs they reviewed. In addition, they found that these programs collectively produced a benefit of US$13,378 per each participant. Furthermore, in their reviews of existing program evaluations, both MacKenzie (2000) and Seiter and Kadela (2003) concluded that vocational programs reduce recidivism.
As noted above, fewer evaluations have been completed on prison industry programs. For example, Wilson and colleagues (2000) were able to identify only four comparisons between offenders who participated in a correctional work/industry program and offenders who did not participate in this type of programming. Although the odds ratio for these four contrasts was 1.48, which amounts to a recidivism reduction of 20%, the effect was not statistically significant. In their review of four correctional industry program evaluations, Aos and colleagues (2006) reported that these programs reduced recidivism by 6%, resulting in a benefit of US$9,439 per participant. And in a study of the Federal Bureau of Prison’s Post Release Employment Project (PREP), Saylor and Gaes (1997) found that prison employment significantly lowered recidivism, increased employment, and reduced prison misconduct.
Tempering these encouraging findings, however, is the fact that prior evaluations of prison industry and prison-based vocational programs have generally been limited in several ways. First, because most evaluations have used naturally occurring nonparticipants from the program of interest as a comparison group, selection bias is an issue that plagues much of the research. Therefore, although previous evaluations have found that recidivism rates are generally lower for offenders who participate in programming, this effect may not necessarily be due to the programming itself but rather to other differences between treated and untreated offenders. Second, MacKenzie (2008) argues that the majority of studies have evaluated programs that were too comprehensive (i.e., they incorporated chemical dependency treatment or employment-assistance programs in addition to the vocational training). Because the components of each program varied greatly, it is difficult to isolate the effects of prison industry or vocational training on postrelease employment or recidivism.
Present Study
Using a retrospective, quasi-experimental design, this study evaluates AHP along several outcome measures. As noted earlier, AHP was designed to increase affordable housing in Minnesota and help offenders gain postrelease employment by providing them with vocational skills. Because no benchmarks were established for how many homes should be built annually, this study simply reports the number of affordable homes that have been constructed or remodeled in Minnesota to date. Therefore, the main focus of the present study is whether the program has had a significant impact on postrelease employment. At the time AHP was created, reducing recidivism and costs to the State of Minnesota were not identified as program objectives. Yet, recidivism is, for better or worse, the main criterion by which correctional program effectiveness is typically measured (Wilson et al., 2000). Moreover, due to the growing emphasis on evidence-based practices, a number of correctional program evaluations now include cost–benefit analyses (Cowell, Lattimore, & Krebs, 2010; Duwe & Kerschner, 2008; Lauria, 2007). As a result, we also examine whether AHP has had an impact on offender recidivism and whether it has reduced costs.
In evaluating AHP, this study contributes to the literature in several ways. First, previous studies have examined multicomponent programs that have provided several services to offenders and, as a result, have been unable to isolate the independent effect of the vocational program being evaluated. AHP is a unique vocational program in that it provides construction training skills to offenders apart from other types of programming found in vocational programs previously evaluated. This allowed the independent effect of the AHP program to be isolated.
Second, in an effort to control for observable selection bias, we used propensity score matching (PSM) to create a comparison group of offenders who were similar to the AHP participants. Unlike previous studies that have used previously existing groups for comparison groups, the groups in this study were matched on a relatively large set of covariates.
Third, the comprehensive nature of this evaluation is unlike previous studies which have been greatly reduced, by comparison, in their scope. For example, most previous studies have examined either postrelease employment or recidivism. This study included both, as well as a third, skill-specific outcome measure: construction-related employment. In addition to identifying the number of affordable homes built by the program, this study includes a cost–benefit analysis, which is lacking in all but one previous systematic review (Aos et al., 2006).
In the following section, we provide a more detailed description of AHP, including the number of affordable homes the program has built. Following a discussion of the data and methods that were used in this study, we present findings from the postrelease employment, recidivism, and cost–benefit analyses. We conclude by discussing the implications of these findings for correctional policy and practice.
The Affordable Homes Program: A Description
In 1998, AHP was established with a US$700,000 legislative appropriation to build affordable houses for low-income families. Newly built homes were targeted to sell to households earning 80% or less of the statewide median income, adjusted for family size, in an effort to address the low-income housing shortage. AHP formed partnerships with several community-action agencies, housing and redevelopment authorities, and economic development agencies that made it possible to build homes at affordable costs. Together, the agencies developed projects, found construction sites, marketed the homes, and assisted buyers in qualifying to purchase the homes. The hands-on training provided in AHP is designed to help offenders develop positive work habits and marketable job skills intended to aid offenders in obtaining employment in the construction industry on release from prison.
To be eligible for AHP, adult male offenders must (a) be minimum security, (b) have no untried misdemeanor, gross misdemeanor or felony detainers, (c) have no escapes in the past 5 years, (d) have no current or prior criminal sexual conduct offenses, (e) have no discipline violations in the past 6 months resulting in segregation and/or extended incarceration, (f) not be considered a risk to the community, (g) demonstrate a positive attitude, and (h) be physically capable of performing the work. Eligible offenders who are selected to participate are then placed in a work crew with up to nine other offenders. These crews are housed in minimum-security units at local correctional facilities, for example, county jails. Work crews typically work four 10-hr days per week and are supervised by a MNDOC employee who is a master tradesman. Each crew is supplied with a van for transportation and a trailer that contains their tools.
Participating in the program is not rewarded with a shortened prison sentence or reduction in time served. Instead, offenders are paid an hourly wage that ranges from US$1 to US$1.50. Monies earned are used to pay restitution, applied toward gate (release) money, or saved in an account to assist offenders when they are released to the community.
Approximately 350 offenders participated in AHP during its first 10 years. In its earlier years, there were up to 10 crews running simultaneously. However, in response to the recent slowdown in the housing market, today the MNDOC operates a smaller number. For example, as of July 1, 2010, there were 39 AHP participants (five crews) working on construction of single family homes and extensive remodeling of substandard and foreclosed existing homes.
As shown in Table 1, during the 1998-2007 period, AHP financed and/or constructed 285 new homes, renovated at least 60 existing homes, and repaired approximately 60 homes for senior citizens and flood victims after the 1997-1998 Red River Flood season. The average cost of newly constructed homes was US$102,231. Each year, on average, 29 of these homes were sold to families comprised of two to three members whose income was US$30,353 on average. These figures suggest that AHP has, and continues to, increase the number of affordable homes in Minnesota.
Summary Information for Homes Built by the Affordable Homes Program, 1998- 2007

Data and Method
The present study used a retrospective quasi-experimental design to compare the AHP participants with a comparison group of similar offenders who did not participate in AHP. We examined all offenders who participated in AHP from 1998 to 2005 and were released to the community prior to January 1, 2006. Given that we followed up on the offenders examined here through 2008, the 1998-2008 period was the timeframe for this evaluation. The population from which the comparison group was selected consisted of offenders who did not participate in AHP but were released from Minnesota prisons during the 1998-2005 period. To make the comparison between the AHP and comparison groups as even as possible, releases for both groups were defined as the first instance in which they exited prison and were placed on some form of supervision such as supervised release or work release. The final sample selection of 224 AHP participants and 224 similar comparison group members was achieved using PSM, which we describe later.
Data for this study were gathered from several sources. Each source will be discussed in conjunction with the measures it provided.
Outcome Measures
Postrelease employment
This study used the following three measures of postrelease employment: (a) whether the offender obtained employment, (b) the total number of hours an offender was employed, and (c) the amount of money an offender earned during employment. Data on postrelease employment were obtained from the Minnesota Department of Employee and Economic Development (DEED). Any labor (or compensation for that labor) not reported to DEED will not be captured in the analyses. Although we are not aware of any industry estimates regarding the prevalence of “off the books” compensation for Minnesota, it is worth noting that some industries, especially construction and food service, have a reputation for being more likely to pay employees under the table.
The time period for this study ran from April 1998 to December 2008, although the postrelease employment data did not become available until January 2005. Because 371 of the 448 offenders in the sample were released from prison prior to this time (i.e., April 1998-December, 2004), complete work histories were not available for all offenders. To compensate for these limitations and to gain as thorough a work history as possible, all employment data available after January 2005 were utilized. Therefore, the time frame for the postrelease employment portion of the study began in January 2005 and ran through the end of March 2009—instead of terminating in December, 2008, as was the case with the recidivism portion of this study.
To ensure that the work histories for each offender could be accurately compared to each other, the following steps were taken. The employment history for each offender began on the latter of two dates, either January 1, 2005 or the offender’s release date, and ended on March 31, 2009. In this manner, a maximum of 17 quarters of employment history was examined for each offender—less time if the offender spent any time in prison for supervision revocations or reincarceration events. Because it was possible that each offender spent a different number of days in the community, the amount of time he worked was divided by the amount of time he was in the community to create a “proportion of time employed” measure. In this way, an offender who spent 5 years in the community and was employed for 3 years could be compared to an offender who was in the community only 2 years and employed the whole time. Two of the three postrelease employment variables were calculated as described above: hours worked and wages earned. The third measure—whether an offender obtained employment—was not calculated to take “time in community” into consideration. However, in the analyses in which this variable was the outcome variable, a control variable was used that measured the amount of time an offender was in the community prior to 2005.
Recidivism
In this study, we operationalize recidivism as a rearrest for a new offense, a felony reconviction, and a return to prison for a new crime. Data on rearrests and reconvictions were obtained electronically from the Minnesota Bureau of Criminal Apprehension (BCA), whereas reincarceration data were derived from the MNDOC’s Correctional Operations Management System (COMS) database. The main limitation with using these data was that they measured only arrests, convictions, or incarcerations that occurred in Minnesota. Because neither source included arrests, convictions, or incarcerations occurring in other states, the findings presented later likely underestimated the true recidivism rates for the offenders examined.
To accurately measure the amount of time that offenders were actually at risk to recidivate (i.e., their “street time”), it was necessary to account for supervised release violators in the recidivism analyses by deducting the amount of time spent in prison from their total at-risk period. Failure to deduct time spent in prison as a supervised release violator would artificially increase the length of the at-risk periods for these offenders. Therefore, the time that an offender spent in prison as a supervised release violator was subtracted from his at-risk period, but only if it preceded a recidivism event (e.g., rearrest, reconviction, or reincarceration), or if the offender did not recidivate. As the study ran from April 1998 through December 2008, the average follow-up period was 5.9 years, with a minimum of 3 years and a maximum of 10.
Independent variables
The principal variable of interest was AHP participation because the central purpose of these analyses was to determine whether AHP had a significant impact on postrelease employment and recidivism. This study provided two different measures of AHP participation. The first measure distinguished between offenders who entered AHP (i.e., the treatment group) and those who did not (i.e., the comparison group). The second measure divided AHP participants into two discrete categories: Program Completers (n = 146; 65%) and Program Terminations (n = 78). Detailed explanations for why offenders were terminated were not available in the data. However, in general, the most common reasons for program termination included discipline problems (n = 53 or 67.9%) and, “program termination” (n = 11 or 14.1%). The remaining 14 offenders (17.9%) were terminated for other reasons (e.g., medical termination). For both participation measures (completion and termination), the comparison group variable served as the reference in the statistical analyses.
The control variables included in the statistical models consisted of those that might theoretically have impacted whether an offender recidivated and, thus, might be considered a rival causal factor. The following lists the control variables used in this study and describes how they were created:
Offender race: dichotomized as White (1) or minority (0).
Age at release: the age of the offender in years at the time of release.
County of commit: this variable measured an offender’s county of commitment, dichotomizing it into either metro area (1) or Greater Minnesota (0). The seven Metro-area counties include Anoka, Carver, Dakota, Hennepin, Ramsey, Scott, and Washington. The remaining 80 counties were coded as nonmetro area or Greater Minnesota counties.
Prior criminal history: the number of prior prison commitments, excluding the offender’s current prison incarceration.
Institution disciplinary history: the number of discipline convictions received during the term of imprisonment for which the offender was released, but only for convictions occurring after the admission date and within 18 months of the release date.
Length of stay (LOS): the number of months between admission and release dates.
Offense type: four dichotomous dummy variables were created to quantify offense type; that is, the governing offense at the time of release. The four variables were person offense (1 = person offense, 0 = nonperson offense), property offense (1 = property offense, 0 = nonproperty offense), drug offense (1 = drug offense, 0 = nondrug offense), and other offense (1 = other offense, 0 = nonother offenses). The “other” offense variable included methamphetamine-related offenses, driving while intoxicated, and other miscellaneous offenses. The “person” offense variable served as the reference in the statistical analyses.
Chemical dependency treatment history: two dichotomous variables were used. The first variable was chemical dependency diagnosis (1 = offender received a chemical dependency diagnosis prior to 18 months before release, or during a prior admission to prison, 0 = no). The second variable was successful completion of treatment (1 = successfully completed treatment or participated until release, 0 = no).
Length of postrelease supervision: the number of months between release date for current incarceration and expiration of sentence.
Intensity of postrelease supervision: four dichotomous dummy variables were created to measure the level of postrelease supervision to which offenders were released. The four variables were supervised release (1 = supervised release, 0 = all other types), work release (1 = work release, 0 = all other types), CIP or intensive supervised release (1 = release to CIP or intensive supervised release, 0 = all other types of release), and discharge (1 = released at expiration of sentence, 0 = all other types of release).
Prior supervised release revocations: number of supervised release revocations that occurred prior to current incarceration.
Release year: measured the calendar year in which offenders were first released from prison for the current offense; this variable was included to control for any unobserved differences between the different release-year cohorts.
Sample Selection
Sample selection bias results when characteristics of the offenders (e.g., motivation or self-control) influence whether offenders are assigned to either the treatment group or to the comparison group. When sample selection bias occurs, researchers cannot be confident that any changes observed in the outcome variable are the result of the introduction of the treatment itself or whether the observed changes could be related to other extraneous factors (e.g., age, race, motivation) that could theoretically impact the research outcomes. To minimize selection bias, we used PSM to carefully select a comparison group as similar as possible to the AHP group.
PSM provides a means of adjusting for selection bias in observational studies of causal effects. Once background (covariate) information has been collected on the treated and untreated offenders, the probability of having been selected into the treatment group given one’s background information (i.e., covariate pattern) can be calculated. The propensity score, then, is each offender’s unique numerical probability of being selected into the treatment group. Offenders from the treatment group were matched one-to-one with offenders from the pool of comparison group members on the basis of having similar propensity scores. As with any nonrandomized design, the main limitation of this technique was that it could control only for the background factors that were measured (i.e., omitted variable bias), and then only as well as the instruments that measured those factors. However, this is mainly a concern when the omitted variables are associated with the treatment selection or the outcome measures.
In conducting the PSM analyses, we first identified the treatment group, which consisted of 414 male offenders who entered AHP between April 1998 and December 2008. Of the 414, only 229 exited the program and were released from prison prior to the cut-off date of December 31, 2005. Utilizing this cut-off date ensured a sufficient follow-up period of at least 3 years for all members of the sample. The treatment group was further reduced to 224 offenders due to five who were missing vital data.
Next, we began assembling the comparison group by isolating eligible nonparticipants who were released to the community during the 1998-2005 period. Because some of the eligibility criteria (e.g., a positive attitude, physically capable of work, a low security status at the time of application, discipline-free for 6 months, and no prior criminal sexual conduct offenses) were difficult to operationalize using available data, we focused only on the requirements that were measurable. After reducing the comparison group pool on the basis of the measurable eligibility criteria, we identified 4,540 individual offenders who did not participate in AHP. From this group, the PSM technique was used to select the 224 comparison group members who most closely matched the 224 AHP group members based on the control variables used in the postrelease employment and recidivism analyses.
Results
As shown in Table 2, the results from independent samples t tests revealed that, prior to the use of PSM, there were significant differences between the two groups on almost all of the control variables. Subsequent to the matching process, significant differences between the two groups were eliminated.
Descriptives, Before and After Propensity Score Matching
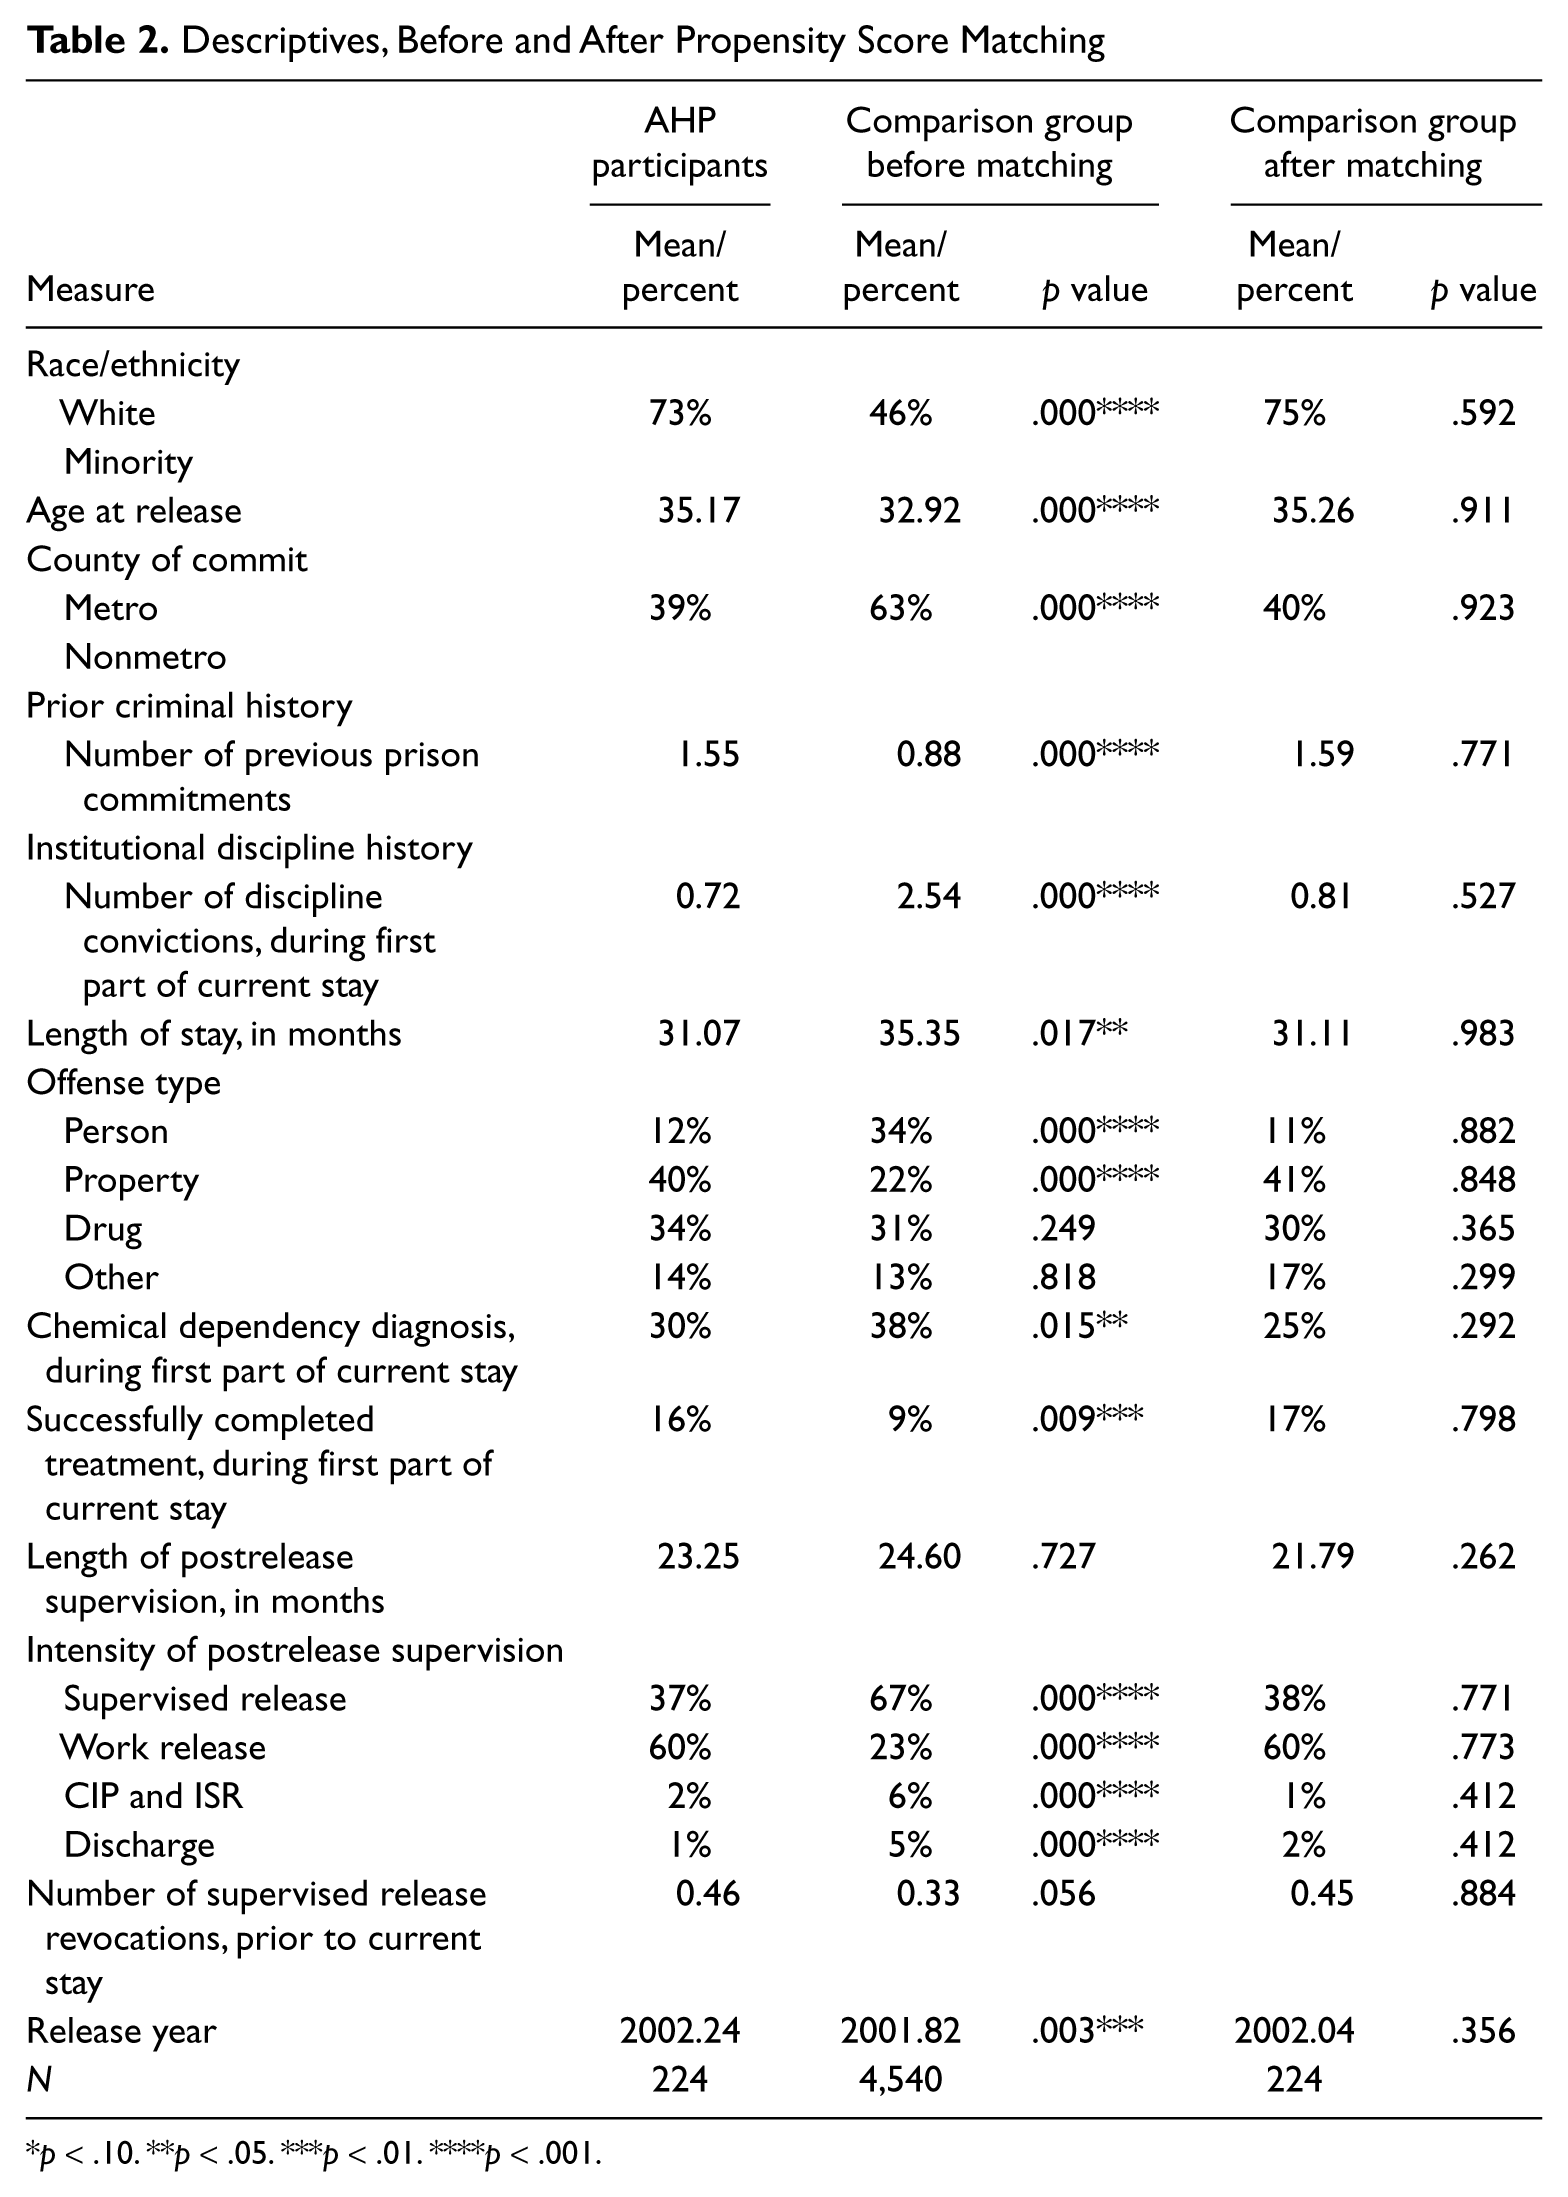
p < .10. **p < .05. ***p < .01. ****p < .001.
Postrelease Employment and Recidivism Outcomes
The findings presented in Table 3 show that, although AHP participants had better employment outcomes than the comparison group across all four employment outcome measures, only two of these differences were statistically significant. AHP participants had significantly higher rates of employment in the construction field (32.1% vs. 16.9%), and reported more hours worked compared to those in the comparison group. Focusing on the subset of program completers, their rate of postrelease employment was 14.7% higher than the comparison group. Likewise, this group worked 228.63 hr more, on average, and earned US$3,351.15 more, on average, than the comparison group. However, among program terminations, the rate of postrelease employment, average hours worked, and averages wages earned were not only lower than the program completers, but also lower than the comparison group members.
Postrelease Employment and Recidivism Outcomes, by Group Type

Note: Results starred are significantly different than the comparison group.
p < .10. **p < .05. ***p < .01. ****p < .001.
Looking at recidivism measures, a similar pattern emerges. The findings presented in Table 3 reveal that AHP participants had lower recidivism rates than the comparison group for all four measures (i.e., rearrest, reconviction, reincarceration, and any return to prison), although these differences were not statistically significant. Breaking out the AHP group into program completers and program terminations revealed more distinct differences among the groups. For all four measures of recidivism, program completers had significantly lower recidivism rates than the comparison group, whereas program terminations had significantly higher recidivism rates. For example, the rate of reconviction for program completers was 10.9 percentage points lower than the comparison group, whereas the reconviction rate for the program terminations was 10.1 percentage points higher than the comparison group.
Data analysis
Because the employment data are compiled on a quarterly basis, we did not have information on the specific date when offenders began working. As a result, it was not possible to use a survival analytical technique, such as Cox regression, to determine whether AHP had an impact on the likelihood and timing of gaining employment. We therefore used multivariate logistic regression because it is well suited to address dichotomous outcome measures.
For the recidivism analyses, however, we used Cox regression considering that the recidivism data contained the specific date when offenders were rearrested, reconvicted, or reincarcerated for a new offense. As a type of survival analysis, Cox regression is preferable in that it utilizes time-dependent data, which are important in determining not only whether offenders recidivate, but also when they recidivate. To incorporate the time element with the event information, Cox regression utilizes both “time” and “status” variables in estimating the impact of the independent variables on recidivism outcomes. The “time” variable measures the amount of time from the date of release until the date of first rearrest, reconviction, reincarceration, or December 31, 2008 for those who did not recidivate. The “status” variable, however, is a dichotomous variable that measured whether one of the three recidivism variables mentioned above had occurred (i.e., rearrest, reconviction, reincarceration).
Postrelease employment
AHP was designed to provide a specific set of skills to offenders—construction skills. Therefore, there was reason to believe that offenders who have participated in AHP, and who had gained construction experience, should have had greater odds of securing employment in construction-related fields such as plumbing, masonry, highway, bridge or street construction, installing drywall, or electrical work. Yet, given that prior research suggests that prison industry and vocational programs significantly increase employment for participants (MacKenzie, 2008), we anticipated that participation in AHP would increase postrelease employment in “any field.”
To investigate both hypotheses, we generated multivariate logistic regression models that estimated the effects of AHP on postrelease employment in the construction field, specifically, or in “any field” (1 = yes, 0 = no). Although the dependent variables captured whether an offender was able to obtain employment, they omitted the amount of time an offender had to pursue employment and, thus, were able to pursue employment. Therefore, more sophisticated measures were also included in the analyses. For example, it was necessary to include control variables that captured the events that likely removed an offender from his community, thereby impacting his opportunities to gain employment, such as a reincarceration for a new offense or for a technical violation revocation. Furthermore, a simple measure of how many months offenders had lived in the community was included. Similarly, because postrelease employment data were available only after January 2005, the 371 offenders released prior to this date had missing employment data compared to those who were released from prison closer to, or after, January 2005. In response, a variable measuring the number of months an offender lived in the community prior to January 2005 was included to control for the disparity in time spent in the community and, thus, available for employment.
Only the significant effects of the postrelease employment analyses are shown in Table 4. The results revealed that offenders who participated in the AHP program were 2.41 times more likely to gain construction-related employment than comparison group members. The odds (not shown) were slightly better for program completers (odds ratio = 2.65; p < .001) and were worse for program terminations (odds ratio = 1.842; p = .126). The findings also showed that the odds of securing construction-related employment were significantly greater for offenders who were White, were younger, had a shorter prison stay, were not property offenders, and had a longer period of supervised release.
Logistic Regression Models Predicting Postrelease Employment, Significant Effects Shown

p < .10. **p < .05. ***p < .01. ****p < .001.
When focusing on “any field,” while also controlling for all other variables in the model, the results indicated that AHP did not significantly impact the odds of obtaining postrelease employment in “any field.” Offenders who had the greatest odds of obtaining employment in “any field” were those who were younger and had longer periods of postrelease supervision.
Recidivism
The results from the Cox regression models, which are shown in Table 5, suggest that participation in AHP did not have a statistically significant impact on the hazard of recidivism. The results further indicate that offenders who were younger, had more previous prison commitments, were property offenders, were chemically dependent, or had a greater number of prior supervised release revocations experienced a significantly increased risk of recidivism (for at least one of the three measures). In contrast, White offenders and those released to supervision (versus released to no supervision) had a significantly lower risk of recidivism for at least one of the three measures.
Cox Proportional Hazards Model: Time Until Three Recidivism Events, Significant Effects Presented

p < .10. **p < .05. ***p < .01. ****p < .001.
Additional analyses were conducted to see whether outcome of AHP participation (i.e., program completion vs. program termination) was associated with recidivism. It was not. We also estimated interaction models for each recidivism measure to determine whether AHP was significantly more, or less, effective under certain circumstances (e.g., type of postrelease supervision) or for specific types of offenders (e.g., White, younger, and so on). None of the interaction terms, however, were significant at the .05 level in the models we estimated.
Cost–Benefit Analyses
There is very little information about how much money it costs to operate prison vocational programs (Crayton & Neusteter, 2008). In line with the one systematic review that has been published (Aos et al., 2006), it was expected that AHP could potentially reduce costs in five areas. Each of these areas was examined.
Housing AHP participants in local correctional facilities
To examine whether moving AHP participants from prison to local correctional facilities may have provided the State with a less costly housing option for offenders, housing costs were calculated. During the 1998-2008 period, the 224 AHP offenders spent an average of 312.02 days housed in local correctional facilities (mostly county jails).
Consistent with other cost–benefit analyses conducted by the MNDOC (Duwe & Kerschner, 2008), we used marginal costs, rather than fixed costs, so as to avoid inflating the magnitude of costs avoided. Fixed costs contain start-up costs associated with the construction and staffing of a prison, whereas marginal costs include only food, clothing, medical, and other expenses that vary with the size of the inmate population. The findings presented here, utilizing the marginal costs, represent the most conservative cost avoidance estimates available. Furthermore, the marginal per diem used is an average of each yearly per diem over the 11-year period.
The results showed that it cost less to house offenders in county facilities (an average per diem of US$50.50) than in MNDOC prisons (an average of US$65.25). Therefore, each day an offender participated in AHP resulted in US$14.75 of costs avoided to the state. Because each AHP offender spent 312.02 days, on average, in the program, at a savings of US$14.75 per day, the State of Minnesota avoided a little more than US$1 million (see Table 6) in housing costs due to housing AHP participants in local correctional facilities.
Cost–Benefit Analysis Results

Labor costs for AHP contracts
In 1998, when the Minnesota Legislature appropriated US$700,000 to the MNDOC to initiate AHP, the commissioner of corrections was directed to develop a program that would generate income and be self-supporting. To accomplish these goals, the program decided to place the entire US$700,000 into a special account and finance the program, instead, by charging nonprofit agencies for the use of MNDOC inmate labor.
Program administrators reported that AHP work crews contracted for 763,316 hr from 1998-2009. Over this time, crews worked between 3,530 to 98,828 hr per year—resulting in an average of 63,609 hr per year. The contract for the services of the AHP crew provided for the cost of the crew leader’s salary and benefits, vehicle expenses, some equipment, and inmate wages (US$1 to US$1.50 per hour).
When AHP crews were unavailable, these nonprofit agencies often contracted with other work crews for general labor and, when they did, they generally paid considerably more money for these crews. However, estimating the precise amount of money saved by these nonprofit agencies by utilizing AHP work crew labor was challenging for two reasons. First, it was unknown what other agencies would have charged non-AHP crews to do the same work. And, second, it was unknown whether the labor performed by AHP crews was as efficient and of the same quality as work performed by other crews.
With respect to the first reason, although it was known what agencies actually paid for AHP labor, these contracts do not elucidate what agencies would have paid for the same labor to be performed by a non-AHP crew. To obtain this information, we contacted the four nonprofit agencies that currently have contracts for AHP crews, as it was not possible to contact each nonprofit agency with whom the MNDOC has had a contract. All four agencies responded with information that shaped the estimates presented, but only one agency was able to provide hourly rates. This agency reported that the average hourly cost for an AHP inmate in 2008 was US$6.73, whereas the average hourly cost for other workers was US$22.28. The three other nonprofits estimated they would likely have paid between US$30 and US$50 per hour for comparable non-AHP general labor. Although an hourly wage of US$22.28 for non-AHP labor is likely a conservative estimate of the actual value contractors would have to pay, we use this figure for the cost–benefit analysis because it is the most precise estimate available.
Regarding the second reason, it was possible that AHP crews were less efficient or produced lower quality work, eventually resulting in higher costs, than a non-AHP crew. According to all agencies contacted, the efficiency and quality of AHP crew members varied. Some produced work equivalent in quality and efficiency as noninmate crew members, whereas others were slower or produced lower quality work. Nevertheless, three of the four agencies agreed that, because there is a common standard in construction, there was not a final quality difference between what the AHP crew produced in comparison to what another noninmate crew could produce. The fourth contractor explained that, while he had concerns about his AHP crew who had produced lower quality work, he was working closely with program administrators and believed these issues would be resolved. Because there was not agreement between the agencies, and no one was able to quantify to what extent workers may be more, or less, productive per hour, this limitation was not figured into the savings estimate.
Given that AHP offenders worked 763,613 hr for US$15.55 less per hour (US$22.28-US$6.73) than non-AHP labor, AHP produced a benefit of US$11,869,563.80 to local nonprofit agencies by offering construction labor at a reduced rate. For reasons noted above, however, it is difficult to state whether the size of this benefit is either an underestimate or overestimate of the true savings to local nonprofit agencies. In addition to a greater level of imprecision for this particular cost measure, we realize some may not consider underpaying inmates for their labor to be a benefit. As such, we later report total costs avoided both with and without this measure.
No-interest loans issued to nonprofit agencies
In the interest of generating a greater number of affordable housing projects, AHP program administrators resolved to lend money to nonprofit agencies in the form of interest-free loans. As a result, this action may have saved local nonprofit agencies money.
In 1998, program administrators used the full legislative appropriation of US$700,000 to establish the AHP revolving loan fund and, over the years, program administrators have added US$240,000 to the fund. Although only US$940,000 has ever been available at one time, more than 3.1 million dollars have been allotted from this fund for the financing of construction projects.
Six nonprofit agencies have been the recipients of these no-interest loans. If these agencies had financed their projects through other lenders, it is estimated that they would have been charged at least 2% interest on their loans. Accounting for the amount of time agencies took to pay back their loans, collectively, they would have paid US$71,170.00 in interest for the loans they received from AHP. Therefore, these agencies avoided paying more than US$71,000 in interest because of the AHP revolving loan fund.
Postrelease employment earnings
To examine whether AHP participants, using their newly acquired construction skills to obtain employment, contributed more money to state income tax revenue than comparison group members, DEED data were utilized. During the 17 quarters (January 2005-March 2009) in which DEED information was available, the 161 AHP participants who were employed earned an annual income of US$12,203.29. Collectively, AHP participants earned a total of US$8,350,101.10, whereas the 142 employed comparison group members earned US$6,834,764.10. Therefore, AHP participants earned US$1,515,337.00 more than the comparison group members during the time in which data were available.
Although it was beyond the scope of this project to obtain actual tax records to determine what percentage of these funds that was contributed to municipal and state tax bases each year, an estimate was calculated using the State of Minnesota’s Individual Income Tax Tables for the years 2005-2008. According to the tax tables, individuals earning US$12,203.29 would have paid US$655 each year to the State of Minnesota, or 5.3% of their annual income. Therefore, it is expected that AHP participants paid US$80,312.86 to the State of Minnesota in excess of what the comparison group was able to contribute (i.e., 5.3% of US$1,515,337.00).
A few caveats should be noted, however. First, it is likely that AHP participants claimed deductions and, as a result, paid less than US$655 per year in taxes, which would have lowered the estimate provided. Second, actual incomes may have varied from year to year, placing offenders into a higher or lower tax bracket in a given year. Finally, because financial data were not available from 1998 to 2004, taxes paid on income earned during that time period were not included in the above estimate.
Costs of recidivism
Offender recidivism exacts a cost to society that results not only from the money required to reincarcerate inmates, but also from the tangible and intangible costs associated with the new criminal offense(s) committed. Below we discuss each area—reincarceration and the cost of crime—in more detail.
Estimation of reincarceration costs
When an offender is reincarcerated, either for a supervision revocation or to serve a sentence for a new crime, the housing, clothing and food costs for that incarceration must be calculated. To examine whether AHP reduced reincarceration costs to the state, it is important to examine not only the reincarceration rates but also to calculate the length of stay for each reincarceration to determine which group spent fewer days in a MNDOC facility. The follow-up period for each offender began the day of his release from prison and ended on December 31, 2008. Although the exact length of the follow-up periods varied among offenders, AHP participants had, on average, a follow-up period of 5.76 years in comparison to 5.96 years for the comparison group.
Table 3 shows that, during this time, a total of 120 offenders from the comparison group were reincarcerated after their initial release from prison. By comparison, a total of 113 AHP participants returned to prison for any reason. Although fewer AHP participants returned to prison, those who did return stayed for a greater number of days (667.63 days, on average) than comparison group members (601.19 days, on average), after their initial release from prison.
To calculate the cost of reincarceration-related housing, using the average marginal per diem of US$65.25, the AHP group cost the state US$4,922,602.90 in reincarceration-related housing costs. By contrast, the comparison group inmates who returned to prison spent a total of 72,142.80 days in prison at a cost of US$4,707,317.70. Therefore, following the initial release from prison, AHP participants cost the State of Minnesota approximately US$215,285.20 more to house than comparison group members.
“Cost of crimes committed” estimates
In calculating the costs and benefits associated with reconvictions, another consideration is that when offenders commit a new crime there are additional costs to the state. Researchers have estimated the “bottom up” costs of crimes to society in terms of victim costs, risk of homicide costs, mental health care costs, criminal justice system costs, and criminal career costs for a broad range of crime categories (French, McCollister, & Fang, 2010; Rajkumar & French, 1997). Researchers have also surveyed citizens regarding what they would be willing to pay (WTP) for crime reductions in certain crime categories (Cohen, Rust, Steen, & Tidd, 2004). Cohen and Piquero (2009) estimated both “bottom up costs” and WTP estimates, in 2007 dollars, based on the actual offending behavior of a 1958 cohort comprised of more than 27,000 individuals. Using their calculations, Table 7 illustrates the estimated cost to Minnesota communities for crimes committed by participants in the study (n = 448) from the time after their release from prison until the end of the follow-up period on December 31, 2008.
Frequency and Cost of Reconvictions, by Group

Note: Source for estimates is Cohen and Piquero (2009).
Only convictions for crimes (felony, gross misdemeanor, and misdemeanor) occurring in Minnesota were included in these calculations. AHP participants accounted for 276 convictions, whereas comparison group offenders were responsible for the remaining 354. Because 158 (88 for the comparison group and 70 for AHP) of these convictions were for unknown offenses, costs for these crimes were unable to be estimated. The remaining 472 convictions were placed into the crime categories estimated by Cohen and Piquero (2009). Note that because the authors did not provide a cost estimate for drug crimes, these crimes were grouped into the “other” category.
As shown in Table 7, AHP participants were convicted of 206 crimes totaling an estimated US$2,045,000 in “bottom up” costs. Comparison group members were convicted for 266 crimes totaling an estimated US$2,310,400 in “bottom up” costs. Because the offenses committed by the AHP group totaled to a lesser amount of money, the tangible cost of crime for this group was US$265,400 of avoided costs. Combining the two areas of recidivism-related costs, the costs incurred by reincarceration (US$215, 285) were offset by the benefit of committing less costly crimes against society (US$265,400) to produce US$50,115 in costs avoided.
Summary of benefits and costs
After totaling the figures from the five areas that were analyzed, the results show that AHP has produced an estimated US$13.1 million in costs avoided to the state. Given that this estimate was based on a sample of 224 AHP participants, the results suggest the program produced a reduction of US$58,491 in costs to the state per each participant. Moreover, the program produced a benefit of US$61.86 for every dollar spent. Furthermore, the benefits AHP produced are nearly four times greater than that reported by Aos et al. (2006) who found that their program produced a benefit of US$13,738 for each offender who participated.
Due to the aforementioned issues with estimating the reduced cost of inmate labor, we also calculated total costs avoided without this measure. These calculations show AHP produced US$1.2 million in costs avoided, at a rate of US$5,502 per participant. Thus, after excluding the reduced inmate labor cost measure, the results show that for every dollar spent on AHP, the program produced a benefit of US$6.73.
Limitations of the cost–benefit analysis
There are additional costs and benefits that could have been discussed and included in this section but were unable to be incorporated. First, program operating costs were not included because, according to program administrators, they are largely covered by the contracts with local non-profit agencies. Costs not calculated include portions of program administrators’ salaries and start-up costs for work crew equipment. The MNDOC does not employ full-time AHP staff. Instead, there are four program administrator positions that support the program with approximately 5%-10% of their time annually. For the purposes of this study, it was not possible to calculate these costs but they are included as limitations of the cost–benefit analysis. It should be noted, however, that the program was able to increase its legislative endowment of US$700,000 to more than US$900,000 because of money collected in contracts. Therefore, it is unlikely that the inclusion of operating costs would significantly diminish AHP’s “costs avoided.”
Although the realized costs of the AHP program were easier to calculate, its programmatic benefits to the community were more difficult to quantify and, thus, to calculate. For example, communities profited economically from the presence of affordable housing in their neighborhoods (e.g., through increased property tax revenue paid on new or improved properties), employment for their subcontractors (e.g., electricians and plumbers), materials purchased from their home-improvement retail stores, and increased revenue at local jail facilities (e.g., payments made to local jail facilities for housing AHP participants). Ultimately, it is likely that AHP produced even greater benefits than are represented in this analysis.
Conclusion
The results shown here suggest that participation in AHP significantly increased the chances of obtaining employment in a construction-related field but did not significantly increase the odds of obtaining postrelease employment in general. Although AHP participants had lower rates of recidivism, the program did not significantly reduce the risk of recidivism. During its first 10 years of operation, however, AHP provided benefits in terms of reduced housing costs for offenders who participated in the program (US$1,030,914), reduced cost of construction labor to nonprofit agencies (US$11,869,564), no-interest financing for the construction of affordable homes (US$71,170), generated tax revenue from postrelease employment earnings (US$80,313), and lowered costs of recidivism (US$50,115). Altogether, the findings suggest that AHP offenders produced more than US$13.1 million worth of costs avoided to the State of Minnesota. As such, AHP has accomplished what it was legislatively designed to do—increase affordable housing, increase the extent to which offenders find employment in the construction field, and produce a cost-reduction benefit. By these measures, AHP has been an effective correctional program.
The results presented here deviate from previous findings in several ways. First, AHP participants earned substantially more than the comparison group (US$1,515,337) and were more likely to gain employment in the construction field, but they were not more likely to gain employment in general. The apparent marginal impact on employment, however, could be tied to the lack of preincarceration employment data available from DEED. This is a potentially important control variable, and it may be the most important predictor of postrelease employment. If the comparison group had greater preincarceration work experience than the AHP group, then the employment results, after controlling for prior work history, could show that AHP had a stronger impact on postrelease employment than was presented here. However, if the opposite were the case, then the results could show no impact. The lack of work history data simply points to the tentative nature of the conclusions about the impact on postrelease employment. Still, it is worth noting that the average hourly wage of those in the comparison group (US$16.00) was higher than that for AHP participants (US$15.37), which suggests the level or quality of preincarceration work experience was, if anything, better for offenders in the comparison group.
As discussed earlier, AHP was not necessarily designed to increase employment in the general sector. To increase AHP participants’ odds of securing general, postrelease employment in the future, employment counselors could be hired to help AHP participants develop resumes, practice interviewing skills, and pursue certification in construction-related courses. These activities could be expected to translate into increased employment, and the implementation of these components could be empirically examined. Yet changes such as these would most certainly increase the cost of the program. The return (offenders working, paying taxes, and so on) could potentially exceed the investment (hiring employment counselors), however.
The second way this study deviates from previous findings is that the cost–benefit findings are larger than those reported in Aos et al. (2006). This could be attributed to the methods used to calculate the costs and benefits. Aos and colleagues used projected recidivism and crime rates to estimate whether implementing programs described as “alternatives to prison” could, in the future, reduce costs to the State of Washington. In the present study, however, we calculated actual costs spent and costs avoided. These calculations were not based on the likelihood of future crimes occurring; rather, the estimated costs were calculated based on what crimes were actually committed and what it actually cost to house offenders in prisons for the time period examined. Aos et al. admit to using an extremely conservative calculation, and this may be the best explanation for why the benefit calculated in this study far exceeded (i.e., 325% higher) the projections calculated in their study.
Finally, unlike the findings from evaluations of similar programs (Aos et al., 2006; MacKenzie, 2000; Seiter & Kadela, 2003), we did not find that AHP did not have an impact on recidivism. One explanation for why AHP did not (significantly) impact the recidivism outcomes could be that previously evaluated industry and vocational programs have been comprehensive in nature (i.e., the programs have offered a number of services simultaneously). Several previous studies (MacKenzie, 2000; Wilson et al., 2000) have shown that programs that provide several prison-based and postrelease services to offenders (e.g., chemical dependency treatment, education, vocational training, employment assistance, and so on) have significantly reduced recidivism. However, when evaluators attempted to review these multicomponent programs, they found it difficult to isolate the effect of any one component (MacKenzie, 2008). This study, however, was able to isolate the impact of correctional employment and vocational training, which turned out not to be a significant predictor of recidivism. This finding could reinforce the belief that a continuum of care is what matters most in reducing recidivism. Stand-alone services may not be enough to change an offender’s trajectory; rather, a confluence of programs is what makes the (statistical) difference.
Another explanation for why AHP was not found to significantly impact recidivism is because the program was not designed for this purpose. Because lowering recidivism was never a stated goal of AHP, no therapeutic components have been implemented—aside from acquiring construction-related skills and experience—that specifically target criminogenic behavior. In general, with any program evaluation, correctional program administrators and evaluators should consider whether the programs they evaluate were designed to achieve the aims they were testing, for example, reductions in recidivism. Should the reduction of recidivism become one of the goals of the program, several adjustments could be made to the program to help achieve this goal. Perhaps most notably, AHP does not provide any aftercare programming for program completers after their release from prison. Because research has shown that providing a continuum of care from the institution to the community is critical in reducing recidivism, efforts to redesign AHP so that it produces a decrease in reoffending could include the provision of postrelease assistance relating to housing, chemical dependency, and education.
Footnotes
Author’s Note
Miriam Northcutt Bohmert is now at Michigan State University, School of Criminal Justice, East Lansing, Michigan.
Declaration of Conflicting Interests
The authors declared no potential conflicts of interest with respect to the research, authorship, and/or publication of this article.
Funding
The authors received no financial support for the research, authorship, and/or publication of this article.