



Abstract
The economic collapse of 2008 has forced states to reconsider their priorities in punishment and corrections. States have exhibited a wide range of responses to the fiscal crisis. Using data from the National Conference of State Legislatures (NCSL), this article reviews briefly the types of correctional policies enacted by states in 2009. This research then evaluates quantitatively the relationships between state-level economic, political, and crime control conditions in 2009 and variable rates of state-level policy enactments in that same year that reduce reliance on incarceration. Findings from a cross-sectional negative binomial model suggest that three factors were associated with state enactments in 2009 that reduce reliance on incarceration: percentage of seats held by the Republican Party in state legislatures, amount of state revenue, and percentage of federal funds used for corrections expenditures.
In the aftermath of the economic collapse of 2008, states have been forced to adjust their correctional policies and priorities. California, Kansas, Michigan, and New York are closing prisons (Kaplan, 2011). New Jersey is requiring community programs instead of jail time for parole violators. Kentucky is expanding early release (Steinhauer, 2009). Judges in Missouri are now encouraged to consider the price tags for sentences they impose (Davey, 2010). Across the country, it appears that the “political monopoly” (Baumgartner & Jones, 2009) of incarceration as the dominant solution to perceived crime control threats has been undermined, at least temporarily, by acute economic conditions.
Corrections spending makes up the fourth largest state expenditure (behind only transportation, education, and health), and the largest portion of state spending on corrections comes from states themselves (National Association of State Budget Officers, 2009, p. 62; The Pew Charitable Trusts, 2007, p. 25). It now appears the Great Recession has put states in the position of having to rethink punishment, in some cases accelerating a process of corrections policy revision that began in the early 2000s (Greene & Mauer, 2010).
This research considers descriptively the types of correctional policies enacted by states in 2009 and then evaluates quantitatively the relationships between economic, political, and crime control conditions and variable rates of state level correctional policy enactments that reduce reliance on incarceration. It is important to note that this research is cross sectional and not longitudinal. Although state-level shifts in correctional policy are continuous, and there is evidence that some states began shifts in the direction of reducing reliance on incarceration around the turn of the century (Austin, 2010), 1 this work deals only with policy enactments that took place in 2009. The critical question here is how states responded immediately to the acute effects of the Great Recession and what associations can be drawn between substantive policy enactments and state-level economic, political, and crime control conditions in what was a remarkably difficult fiscal year for states.
Research on this topic is both timely and important. Although the Great Recession was declared over in the summer of 2009, effects of the economic downturn continue to be felt profoundly across states. The extent to which the recession will produce lasting impacts on corrections is certainly unclear (Gottschalk, 2010), but attention to contemporary policy movements, which seem to be featuring increasing leniency in punishment, or even decarceration, can help extend and develop knowledge about the nature and contexts of correctional policy. Research has investigated the “punitive turn” of the early 1970s (Garland, 2001; Tonry, 2004), but scholars have yet to engage fully with the dynamics of what might be seen as the punitive downturn (or at least leveling off) of the 2000s. In addition, research on economic conditions and corrections has tended to focus on national trends (Caldeira & Cowart, 1980; Jacobs & Helms, 1999) while overlooking important state-level issues. The present study is rooted in the assumption that attention to state-level variations in punishment and corrections is important, given the overt power states have in corrections and the substantial fiscal costs they bear.
This article is organized into two parts. The first presents a brief descriptive analysis of data from the National Conference of State Legislatures (NCSL) on the types of correctional policies enacted by states in 2009. The NCSL data indicate that 57% of the 223 correctional policy enactments by states in 2009 were focused on largely bureaucratic and intra-institutional issues, whereas 43% of enactments were policies that moved states in the direction of reducing reliance on incarceration.
The second part of the article considers the relationships between economic, political, and crime control factors and rates of state correctional policy revision which reduce reliance on incarceration. After controlling for other factors, the findings suggest that party strength in state legislatures, state revenues, and federal funding enhanced by the American Recovery and Reinvestment Act (ARRA) of 2009 were associated with the number of policy enactments by states in 2009 that reduce reliance on incarceration.
Literature Review
In the fall of 2008, the bottom seemed to drop out of the U.S. economy. Fallout from subprime lending pushed banks to the brink of insolvency as early as August 2007 (Kirk, 2009). By September 2008, the worldwide economic picture was dire: The failure of Lehman Brothers contributed to a global credit freeze, and the U.S. stock market went into a freefall reminiscent of the Great Depression (Kirk, 2009). By 2009, states began experiencing acutely the effects of the economic collapse. Unemployment rates rose, foreclosures surged, and state budget deficits ballooned. Some states were hit harder than others. Foreclosures hit particularly hard states that had experienced housing booms in the mid-2000s: Florida, Nevada, and California. In the face of the crisis, crime control and punishment agenda at the state level began featuring policy options rarely considered prior to the recession: lifting limitations on parole, reducing probation violations, and even closing prisons (The Pew Charitable Trusts, 2010, pp. 11, 32).
Long-term consequences and implications of recent revisions to state correctional policies are unclear. Recent movements toward decarceration in the face of economic insecurity were not inevitable and may not mark a fundamental shift in correctional outlooks. As Marie Gottschalk has noted, economic downturns in the past have not led to sustained decarceration movements (Gottschalk, 2010, p. 344). In fact, the Great Depression of the 1930s led to substantial increases in the scope of law enforcement, and the economic downturn of the early 1970s coincided with the rise of Garland’s so-called “culture of control” (Garland, 2001; Gottschalk, 2010, p. 349). In the subsequent decades, state correctional populations expanded dramatically but unevenly (Barker, 2009). Although it is not at all clear what recent trends mean for the future of punishment, this research argues that it is important to consider contemporary correctional policy changes, as economic crises offer opportunities for potential shifts in political agenda with wide-reaching implications (Baumgartner & Jones, 2009).
In 2009, states spent 52.3 billion dollars (95% of which came from state funds, 2.6% from federal funds, and 2.4% from bonds) on corrections, including prisons, probation, parole, and other sanctions. This is an increase of more than 300% from the late 1980s (National Association of State Budget Officers, 2010, p. 54; The Pew Charitable Trusts, 2008, pp. 11-12). Within corrections, incarceration is expensive when compared with the costs of probation or parole. The estimated average cost to house an inmate in prison for a year is US$29,000 versus US$2,000 for a year of supervision on probation or parole (Moore, 2009a). 2 Corrections policies and their associated costs are a critical component of state legislative landscapes, and they require careful prioritizing (Caldeira & Cowart, 1980). While states are responsible for enacting and paying for correctional policies, scholarly accounts of correctional trends and economics tend to focus on the national picture (Caldeira & Cowart, 1980; Jacobs & Helms, 1999), overlooking substantial variations across states (Jacobs & Helms, 1996; The Pew Charitable Trusts, 2008, p. 7).
An emerging body of literature has begun to examine the determinants of state-level variation in punishment policies and outlooks (Barker, 2006, 2009; Davies & Worden, 2009; Frost, 2006; Percival, 2010). This work has refocused attention from broad national trends to state-level approaches to punishment (Barker, 2009). Much of this recent literature, however, has examined state correctional spending as the dependent variable rather than as an independent variable affecting policy action (Stucky, Heimer, & Lang, 2005, 2007).
The next section considers types of corrections legislation enacted by states in 2009, the year in which the Great Recession became most acutely felt. An analysis is then presented about the relationships between political, economic, and crime control factors and legislative enactments that reduce reliance on incarceration.
Types of Correctional Policies Enacted by States in 2009
The NCSL is an important and underused source for information on state policy activity. The NCSL Legislative Action Listings for 2009, for example, contain a review of corrections-related legislation enacted at the state level (NCSL, 2010a). 3 The listings were drawn from a state legislation database, StateNet, in collaboration with the Pew Center on the States. They give a comprehensive picture of state corrections legislation (A. Lawrence, personal communication, November 1, 2010). It should be noted that the policies included in the listings reflect only enacted, and not simply proposed, legislation. These data are useful in surveying the correctional policy terrain of states in the wake of the Great Recession.
The NCSL correctional policy listings for 2009 include a total of 182 separate pieces of legislation and 223 major legislative enactments across states. There are more significant legislative enactments than there are individual pieces of legislation because multiple policy revisions are sometimes bundled together into larger bills. NCSL organizes the legislative enactments into four policy categories presented here with their relative proportions of the total: (b) sentencing policy and options (49/223 or 22%), (b) community supervision (68/223 or 31%), (c) facility administration and programming (36/223 or 16%), and (d) release and transition (70/223 or 31%).
Although the four categories provided by NCSL are useful, they do not contain enough detail to provide a rich picture of state correctional enactments in 2009. To produce a more descriptively nuanced picture, the policy listings needed to be coded inductively. Using an “open-coding” process (Strauss & Corbin, 1998), the listings were read carefully and 13 general categories of policies were identified. These categories or codes provide a combination of depth and descriptive parsimony.
The researcher and an assistant then independently coded the 223 legislative enactments to quantify the relative frequency of types of policies. The intercoder reliability for this coding process was 86%. For the items on which discrepancies in coding appeared, some additional investigation into the policies was undertaken before assigning the appropriate code. Table 1 includes the categories created and the relative frequency of each type of policy enactment.
Coding of State-Level Corrections Policy Enactments in 2009.

As the frequencies in Table 1 indicate, corrections policies enacted by states in 2009 included a number of bureaucratic or institutional adjustments (see codes 1 through 6). These policies included minor sentencing adjustments (a greater proportion, 12.1% of the total compared with 4.5%, focused on reducing the severity of penalties rather than on increasing them), contractual shifts, in-facility treatment program adjustments, and development of task forces and other bodies to study policies. Taken together, these sorts of bureaucracy-related policies made up 57% of all correctional policy enactments at the state level.
The remaining policies (see codes 7 through 13) represented more substantive policy shifts. These policies—expanding reentry programs, increasing use of risk assessment programs, limiting probation/parole violations or removing incarceration as a consequence of violations, expanding diversion, specialized courts, release opportunities and funds for community programming—all could be seen as state-level action with the consequence of reducing reliance on incarceration. These policies make up 43% of all correctional policy enactments. The next section considers the relationships between state economic, political, and crime control conditions and the rate of state policy enactments in 2009 that reduce reliance on incarceration.
Economic, Political, and Crime Control Conditions and Policy Enactments that Reduce Reliance on Incarceration
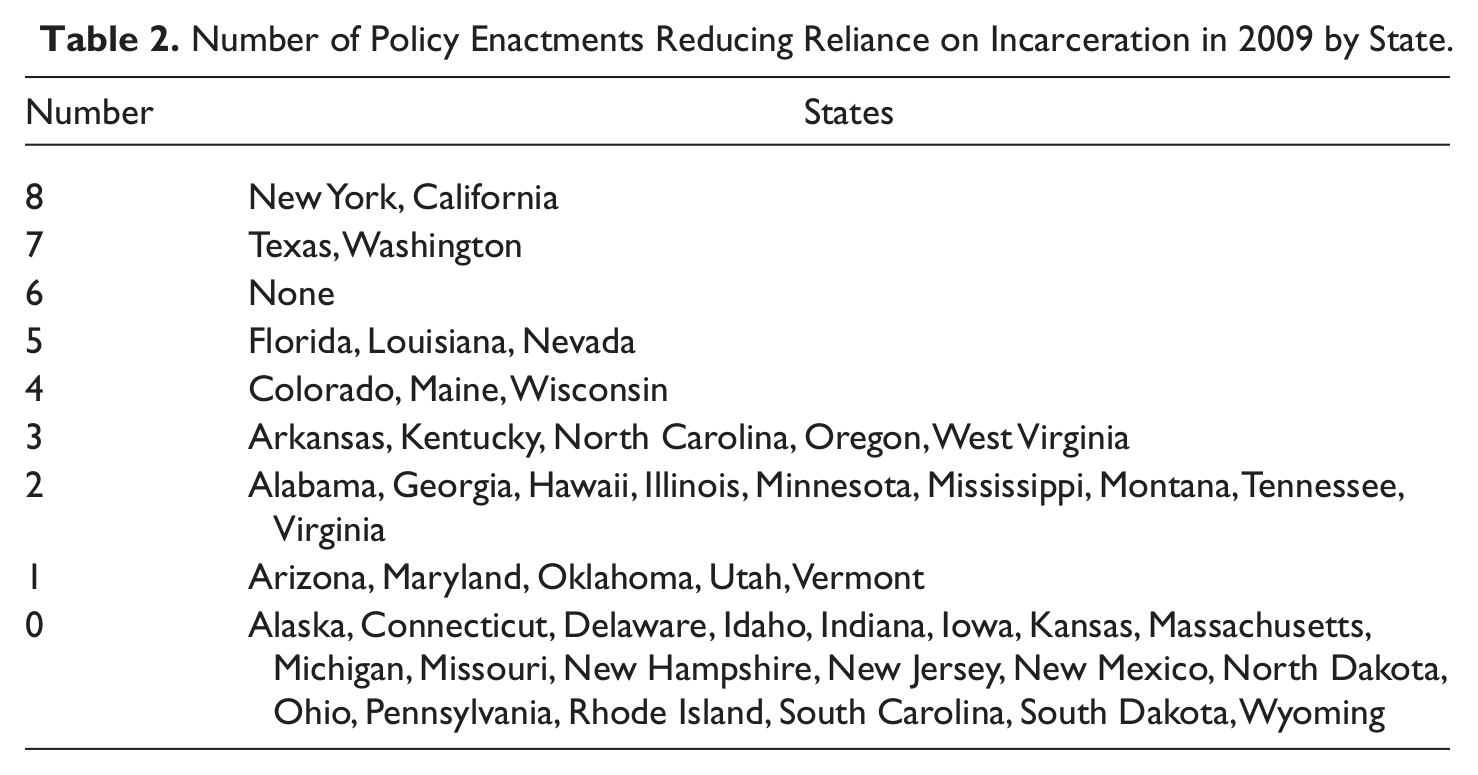
From the description presented above, it is clear that correctional policy enactments that reduce reliance on incarceration were prevalent in 2009. As Table 2 shows, however, the rate of policy enactments varied across states. This section investigates a series of hypotheses about the relative and proximate relationships between state-level crime control, economic, and political conditions and the degree to which states moved to reduce reliance on incarceration in 2009.
Number of Policy Enactments Reducing Reliance on Incarceration in 2009 by State.
The first hypothesis is that,
Hypothesis 1: Fiscal decline is positively related to correctional revision. In other words, the more the fiscal hardship a state faces (e.g., larger budget deficits, reduced tax revenue connected with unemployment), the greater the state’s movement toward correctional policy revisions that reduce reliance on incarceration (e.g., adjusting probation conditions in an effort to reduce revocation rates and costs).
State fiscal health should affect the degree to which relatively expensive punishment approaches can be relied on (Greenberg & West, 2001; Jacobs & Helms, 1999; Taggart & Winn, 1991).
The second hypothesis is that,
Hypothesis 2: The extent of Republican power in state legislatures and executive offices constrains or limits correctional policy revisions.
Regardless of fiscal shifts, it is expected that the degree of power held by the Republican Party will correlate with greater reliance on incarceration. Historically, corrections legislation has been subject to party politics in which Republicans have been associated with “get tough” policies, even though Democratic politicians have often met or exceeded Republican calls for longer terms of incarceration (Beckett, 1997; Garland, 2001; Simon, 1997; Tonry, 2009). Also, research has found that Republican control in states has tended to produce greater corrections spending levels (Davey, 1998; Jacobs & Carmichael, 2001; Scheingold, 1991; Smith, 2004).
The third hypothesis deals with racial minority threat. Racial threat theory posits a positive relationship between the size of racial minority populations and punitive political and social responses to crime (Blumer, 1958; Stults & Baumer, 2007). According to this perspective, prejudicial stereotypes about and fear of racial minorities contribute to harsh crime control policies and initiatives (Liska, Lawrence, & Sanchirico, 1982; Tonry, 1995). Research has shown, for example, a positive relationship between the size of African American populations and incarceration rates and correctional spending (Beckett & Western, 2001; Greenberg & West, 2001; Jacobs & Carmichael, 2001; Jacobs & Helms, 2001; Taggart & Winn, 1991). It is hypothesized here that,
Hypothesis 3: Racial minority threat, indicated by the relative proportion of African Americans in the state population, is associated with lower rates of correctional policy revision in the direction of decarceration, regardless of fiscal crises states face.
Finally, this research hypothesizes that,
Hypothesis 4: State reliance on incarceration relative to noncustodial sanctions will be positively associated with more policy enactments to move away from incarceration.
As incarceration is costlier than other forms of correctional supervision (e.g., probation and parole), states that are relatively more reliant on incarceration than on probation and parole are expected to alter policies more significantly than states that rely more heavily on less expensive forms of punishment.
Data and Analysis
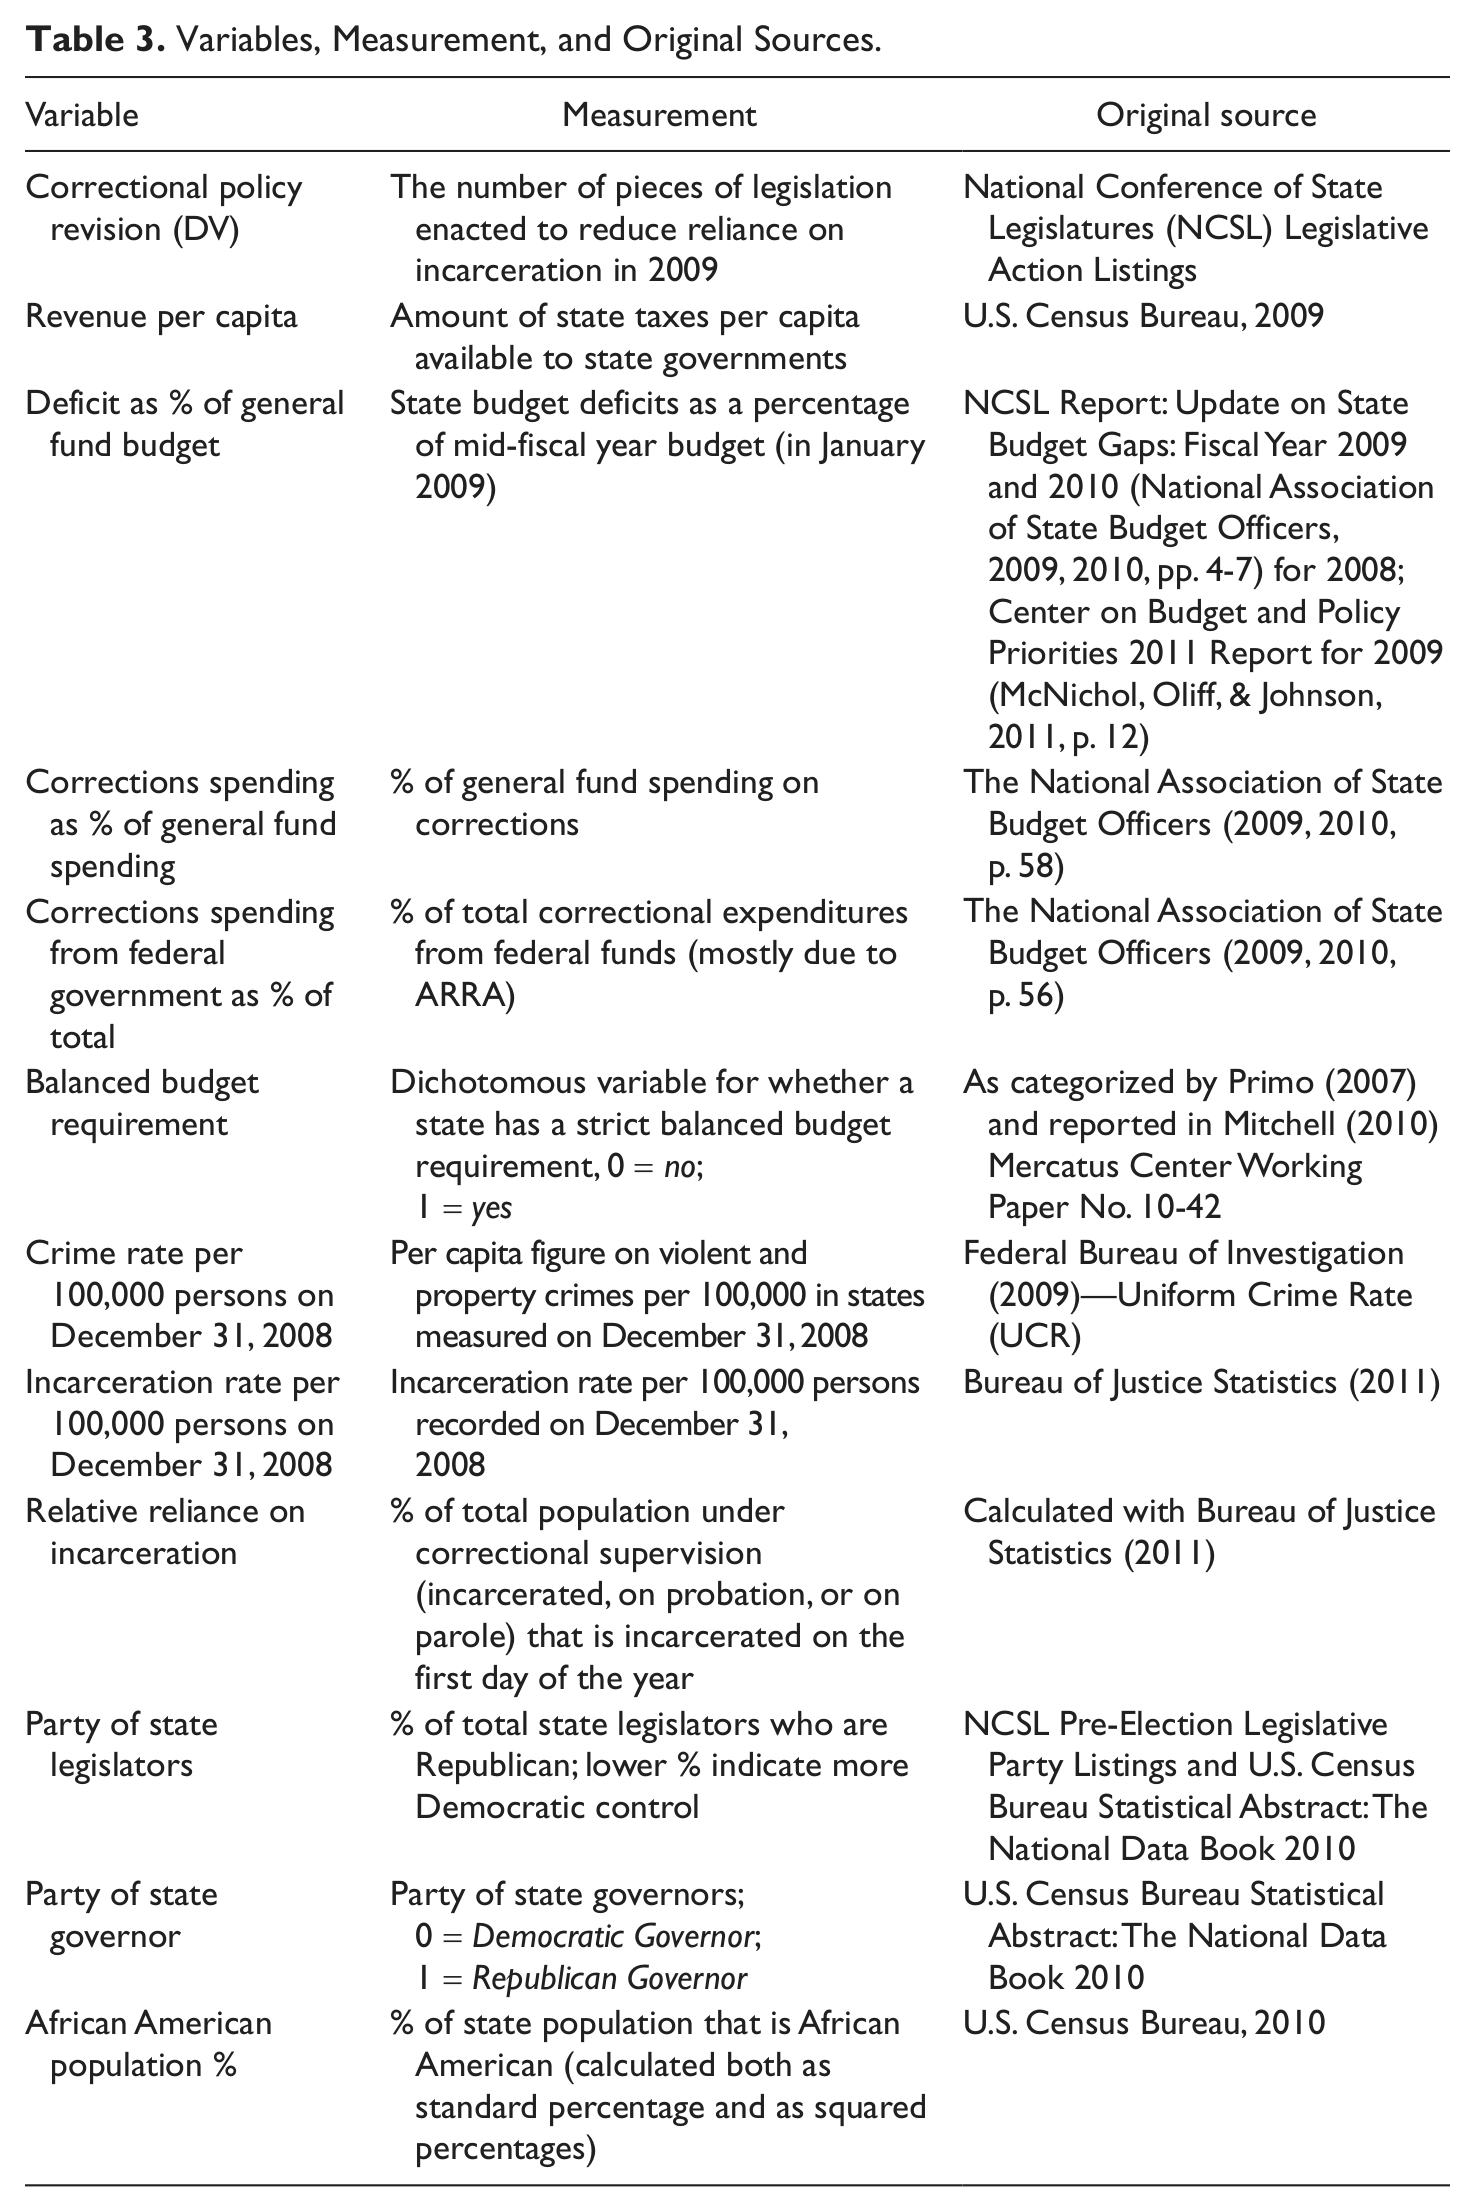
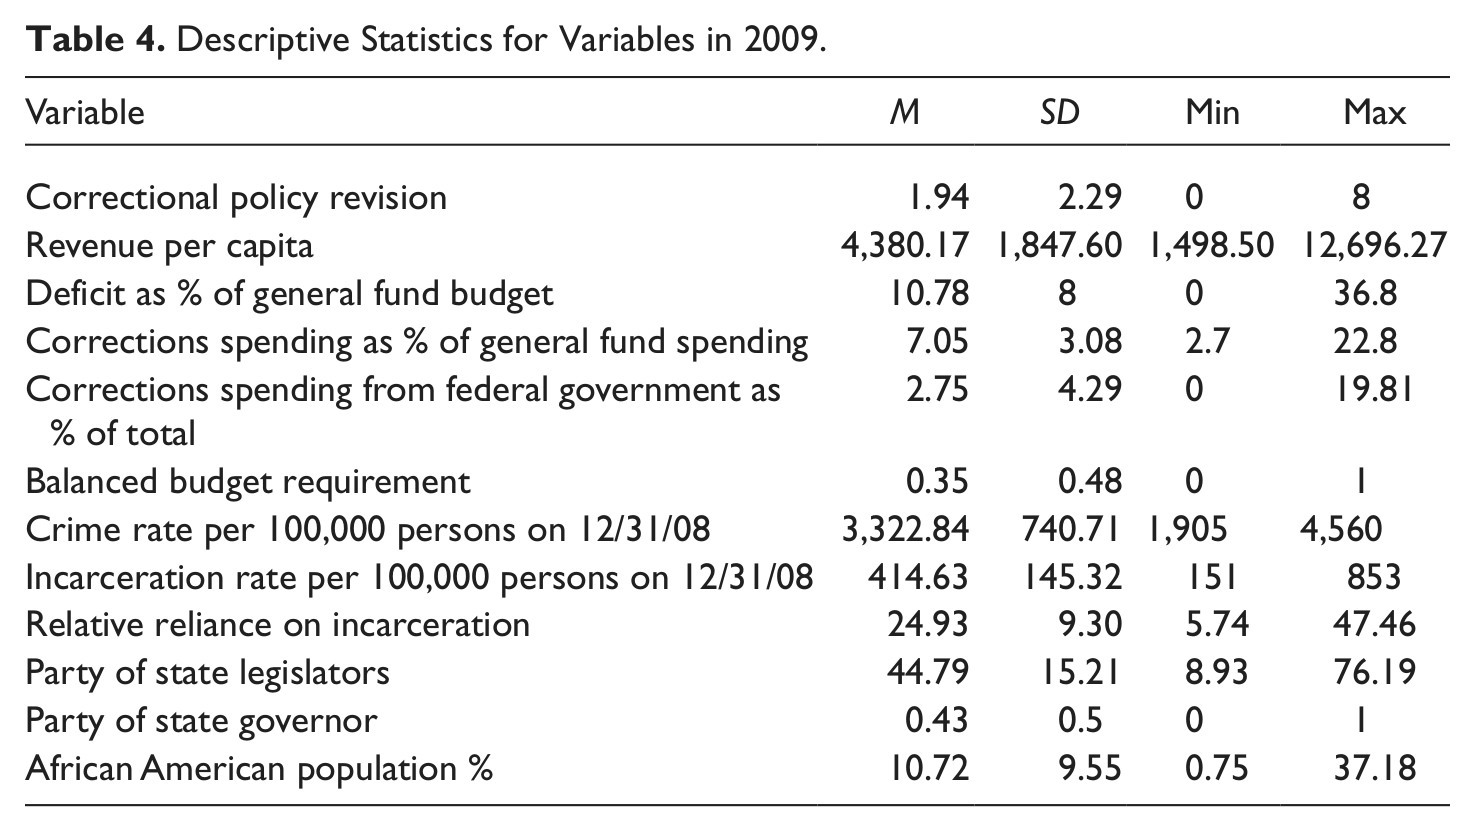
This section considers data on crime control, economic, and political conditions, and state correctional policy enactments in 2009 that reduce reliance on incarceration. Table 3 indicates the sources, measurement, and categorization of variables, and Table 4 includes descriptive statistics for the variables. The sample size is 49 states, with Nebraska excluded because of its nonpartisan, unicameral state legislature. As Alaska is an outlier on many spending variables, thanks to its energy-related taxes, the analyses here were estimated both with and without data for Alaska. No differences were found in the outcomes, so the findings with Alaska included are presented here. Although six states did not report any applicable correctional legislation, there was nothing to have prevented those states from enacting legislation. All of the states included in the sample, in other words, had equal opportunity to report legislation.
Variables, Measurement, and Original Sources.
Descriptive Statistics for Variables in 2009.
Correctional Policy Enactments Reducing Reliance on Incarceration
The dependent variable in this analysis is the number of correctional policies enacted by states in 2009 that reduce reliance on incarceration. To develop tallies for states, the coded listings from the NCSL were used. Substantive policies coded from 7 to 13 on the initial coding table were combined. In other words, the number of policies enacted by each state that dealt with reentry programs, risk assessment, reducing probation and parole violations, expanding diversion programs and release options, and increasing reliance on community corrections were added together to produce overall state tallies.
The more bureaucratic and institution-focused policies captured in the first six codes were not included. Although it certainly is possible that policies such as those to develop or adjust in-facility programming (see code 5) might have the eventual effect of reducing reliance on incarceration by decreasing recidivism rates, those policies are unlikely to have short-term impacts on incarceration. The policies included in the dependent variable here are those with the potential to have immediate impacts on incarceration. Table 2 specifies the states considered and each state’s number of correctional policy revisions tallied for 2009. States ranged from 0 to 8 legislative enactments to reduce reliance on incarceration, with a mean of 1.94.
Economic Conditions
Although there are numerous ways to measure state fiscal health, this research considers two of the more common indicators, revenues and budget deficits or gaps as a percentage of state general budgets. Revenue per capita, a measure of resources available for state spending, was calculated using Census Bureau figures (U.S. Census Bureau, 2009). The revenue measure captures income and sales taxes. 4
In addition, state deficits or budget gaps are considered. Finding appropriate data on budget gaps is difficult for a few reasons. First, the development and enactment of state budgets occurs over time, which makes it difficult to choose a set of budget figures that reflects an entire year. Second, almost all states have fiscal year budgets that begin on July 1st and therefore do not correspond neatly with calendar-year data used in other variables (National Association of State Budget Officers, 2008, p. 2). Third, in an effort to tap into budget gaps as they relate to money available to fund corrections, a focus on deficits as a percentage of general funds (the main component of state operating budgets) is advisable.
Data for budget gaps in 2009 are drawn from end of fiscal year (June 2009) state budget gaps as reported by the Center on Budget and Policy Priorities (McNichol, Oliff, & Johnson, 2011, p. 12). This variable captures what for many states was a low point in terms of fiscal health, and therefore gives a reasonable, if approximate, measure of the financial crunch states were facing as they proposed and debated policy shifts.
In addition, two measures of spending on corrections were calculated. Ninety percent of correctional funding at the state level comes from state general funds (National Governor’s Association and National Association of State Budget Officers, 2010, p. 54). One measure used here was the percentage of state general funds directed toward corrections. Generally, federal funds account for approximately 2% of state-level correctional funding (see Table 3). In 2009, however, federal funds used by states for corrections expenditures increased by 64% as 1.3 billion dollars became available to states through the ARRA of 2009 (National Association of State Budget Officers, 2010, p. 54; National Governors Association & National Association of State Budget Officers, 2010, p. viii). To capture the effects of federal funds on correctional policy enactments in 2009 that reduce reliance on incarceration, the percentage of correctional budgets drawn from federal funds was considered.
Finally, the effects of strict state balanced budget requirements were considered. Every state, with the exception of Vermont, is constitutionally or statutorily required to balance its budget, but some states are able to hold over some of their deficits to the following fiscal year (Center on Budget and Policy Priorities, 2010). States with strict balanced budget requirements, those that are unable to carry over any of their deficits, may experience their own deficits more acutely and be more inclined to take cost saving steps whether by cutting spending and revising policies or by attempting to increase revenues by raising taxes. Designation of states characterized as having strict balanced budget requirements is drawn from the work of David Primo (Primo, 2007) as reported in a recent working paper on budget gaps and deficits (Mitchell, 2010). This is a dichotomous variable for 2009 (1 = strict balanced budget requirement; 0 = no strict balanced budget requirement).
Crime Control Conditions
For crime control conditions, this research considers data on crime rates (the sum of violent and property crime rates), incarceration rates, and relative reliance on incarceration (number of people incarcerated/total correctional population) for states. Although crime rates have not been found to be very good predictors either of incarceration rates at the state level or of state correctional spending (Beckett & Western, 2001; Greenberg & West, 2001; Stucky et al., 2005), they are an important contextual variable when punishment policies are debated. Total crime rates per 100,000 persons were calculated by adding Uniform Crime Rate (UCR) violent and property crime rates as of the last day of 2008 (Federal Bureau of Investigation, 2009). This measure indicates overall crime rates for each state prior to any legislative enactments.
State incarceration rates were drawn from data reported by the Bureau of Justice Statistics on December 31, 2008 (Sabol, West, & Cooper, 2009a). As with crime rates, using incarceration rates measured just before the beginning of 2009 gives a snapshot of where states were at the start of 2009. In addition, state-level relative reliance on incarceration was operationalized. For each state, the total number of people incarcerated (Sabol, West, & Cooper, 2009b) was divided by the sum of people incarcerated, on probation, or on parole at the beginning of 2009 (Glaze, Bonczar, & Cooper, 2010a, 2010b). This measure provides the percentage of state correctional populations that are incarcerated. Including this measure in the analysis allows consideration of the relationship between relative reliance on incarceration and enactments of correctional policy revision in 2009.
Political Conditions
Political conditions were evaluated in three ways: by the percentage of seats held by Republican politicians in state legislatures, by the party of the governor, and by the percentage of African Americans in the state population. 5 The percentage of state legislature seats occupied by Republicans and the party of the governor were calculated using data from the U.S. Census Bureau Statistical Abstract: The National Data Books (U.S. Census Bureau, 2010, p. 103) and data from the NCSL (2010b). The party of the Governor was coded dichotomously, with the number one indicating a Republican governor.
Prior research has indicated that Republican strength is associated with “get tough” incarceration-reliant policies at the state level (Jacobs & Carmichael, 2001; Smith, 2004). The party affiliation of state governors tends not to be highly correlated with party control of state legislatures and tends to have less overall effect on policy outcomes (Davies & Worden, 2009). Finally, racial threat is measured here by percentage of African Americans in state populations according to Census Bureau figures. Although racial threat could be measured using other racial categorizations, racial disparities and biases in the U.S. justice system criminal justice have been most felt by African Americans (Greenberg & West, 2001). Previous research has shown this variable to be a significant predictor of state-level incarceration rates (Smith, 2004).
Analysis & Findings
The dependent variable, policies that reduce reliance on incarceration, is a count measure with a non-normal, skewed distribution. Poisson and negative binomial regression modeling are useful with this type of dependent variable. Unlike linear regression modeling that would produce inefficient and biased estimates, Poisson and negative binomial models allow logistic regression for discrete dependent variables (Long, 1997, p. 217). Negative binomial estimates, in particular, are useful when the dependent variable is over dispersed. Because the correctional policy revision measure used here has a standard deviation just slightly larger than the mean (M = 1.94; SD = 2.29), both sets of estimates were examined.
Although no differences were found in the significance of coefficients for the negative binomial and Poisson models estimated for these data, the likelihood ratio test chi-square values for the negative binomial model was significant (at .001), indicating that the negative binomial model produced better estimates than the more general specification. In the interest of concision, only the negative binomial estimates are reported here. It should be noted that zero-inflated Poisson and zero-inflated negative binomial models were also estimated and produced no significant differences from the original estimates.
With aggregate data and a small sample size, it is particularly critical to examine variables for multicollinearity. Multicollinearity was assessed here by examining variance inflation factors (VIFs) and tolerances for the independent variables and the bivariate correlations associated with those VIFs. While the standard rule of thumb is that VIFs above 10 and tolerance values below .10 indicate collinearity, the small sample size here warrants a more conservative threshold: VIFs above 2.5 and tolerance levels below .40 may indicate collinearity (Allison, 1999). Only one variable, incarceration rate, had a VIF above 2.5, with a value of 3. While above the conservative threshold set, the VIF values are not high enough to suggest that collinearity may be altering the findings.
The findings from the negative binomial model are presented in Table 5. The results of the models indicate that revenue per capita, federal funds as a percentage of correctional spending, and percentage Republican seats in state legislatures in 2009 were associated with correctional policy revisions in that same year. The findings are considered in greater depth below.
Negative Binomial Model Estimates Predicting Policies to Reduce Reliance on Incarceration in 2009.
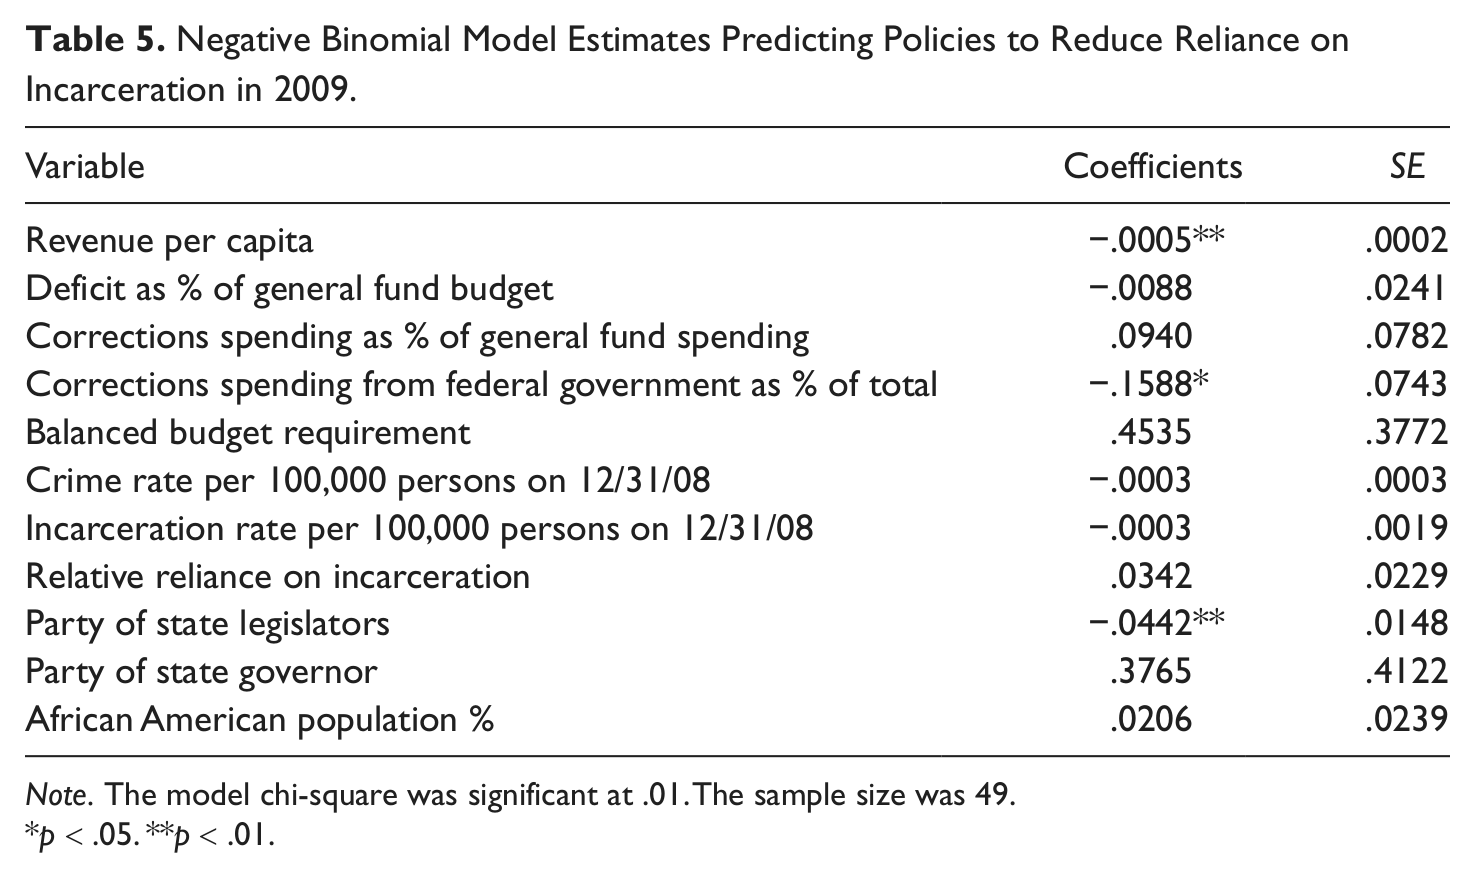
Note. The model chi-square was significant at .01. The sample size was 49.
p < .05. **p < .01.
Revenue per capita, federal funds as a percentage of correctional spending, and Republican seats in state legislatures were significantly associated with state policy enactments to reduce reliance on incarceration in 2009. As the coefficients in these models are expressed as log odds, interpreting them is easier after transforming them into simple odds. For example, controlling for the effects of other variables in the model, the coefficient for revenue per capita is –.0005. By exponentiating the coefficient (ecoefficient) and subtracting 1, the effect of one standard deviation increase in revenue per capita (or approximately US$1,848) decreased the rate of correctional policy revision in that year by .05%.
Federal money used in state correctional budgets was significant at the .05 level. An increase of one standard deviation (4.29%) in the percentage of state budgets derived from federal funds corresponded with a 15% decrease in the rate of correctional policy revision. The more states relied on federal funds in 2009, the fewer policies they enacted to reduce reliance on incarceration. Finally, the number of Republican seats in state legislatures was a significant variable (at the .01 level), with an increase of one standard deviation (15%) in the number of seats held by Republicans corresponding with a 4.4% lower rate of policy revision in states.
Discussion
States enacted a variety of correctional policies in 2009. Among the enactments were policies to make minor tweaks to sentences (in both punitive and lenient directions, with more of an emphasis on the latter), bureaucratic and interinstitutional adjustments to programming and authority structures, and the development of task forces. Policies were also enacted with the apparent intent of moving states away from reliance on incarceration. Forty-three percent of policies enacted were focused on substantive measures designed to reduce reliance on incarceration by expanding reentry and release options, minimizing probation and parole violations, increasing diversion programs, and providing more options for community corrections. Given this apparent focus in states on reducing reliance on incarceration, this research considered relationships between political, crime control, and economic conditions and the rate of decarceration-oriented policy enactment in 2009.
Findings from this research supported the hypothesis that fiscal decline in states during the Great Recession would be positively related to policy enactments to reduce incarceration. Stronger state revenue streams were associated with fewer moves to reduce reliance on incarceration. Interestingly, this effect held up, even when controlling for crime and incarceration rates, 6 the size of state deficits, the party of political leadership, and whether the state has a strict balanced budget requirement. In addition, the percentage of state correctional spending derived from federal money was significantly related to state policy revisions. The higher the percentage of federal funds in correctional spending, the fewer the revisions enacted. It seems plausible that the more states were able to tap into federal funds, which increased (albeit unevenly) across states due to stimulus spending beginning in February 2009, the fewer policy revisions were required to reign in budget gaps. It will be interesting to examine state policy adjustments during 2010 when federal stimulus monies ceased but states’ fundamental economic problems continued.
Support was also found for the hypothesis that Republican Party strength in state legislatures was associated with constrained or limited correctional policy revision in 2009. This finding supports prior research showing that party strength in state legislatures is a powerful contextual force in policy activity at the state level (Davies & Worden, 2009; Jacobs & Helms, 1996, 1999; Rengifo, Stemen, Dooley, Amidon, & Gendon, 2010; Smith, 2004; Stucky et al., 2007; Yates & Fording, 2005). Republican strength appears to have constrained policy enactments to reduce reliance on incarceration in 2009. Alternatively, Democratic-controlled statehouses may have experienced a surge in reform enactments. As in prior research, the party of governors was not a strong predictor of policy action (Davies & Worden, 2009). This research did not find support for the third hypothesis that suggested that racial threat would reduce correctional policy revisions, nor for the fourth hypothesis, that states that rely more heavily on incarceration over noncustodial sanctions would engage in more policy revision to save money.
Conclusion
The Great Recession has had profound impacts on American states (Cooper, 2011). Although the recession began as early as 2007, the impacts on states became acute in 2009 when budget shortfalls and unemployment rates soared (National Governors Association & National Association of State Budget Officers, 2009, p. vii). This research reviewed briefly the types and relative frequency of correctional policies enacted by states in 2009. The substance of many of the policies, beyond those addressing relatively minor bureaucratic and institutional shifts, was to move states toward reducing reliance on incarceration. Furthermore, this research suggests that in 2009, revenue, the percentage of correctional funding from federal money, and partisan power in state legislatures were related to the rate of policy enactments to reduce reliance on incarceration in states, controlling for a number of other factors. This work contributes to the small but growing body of research on economics and state-level crime-control policy making (Davies & Worden, 2009; Jacobs & Carmichael, 2001; Rengifo et al., 2010).
The findings here speak to the often-noted power of perception politics, however misguided, and panics (“moral” or otherwise) in penal policymaking (Garland, 2001; Simon, 2007; Tonry, 2004). Partisan power, revenue (directly connected with unemployment, a particularly salient and visceral driver of perceived fiscal health both for the public and for elected leaders), and the availability of federal funds were significantly associated with rates of policy enactments. More concrete measures of crime control needs and costs, crime rates, incarceration rates, and actual state spending on corrections did not correspond with higher rates of policy change.
This research is limited in a number of ways. First, attention was not given to the nuances, state-level dynamics, and eventual impacts of policy revisions. It is unclear, for example, just how comparatively significant were the policies enacted across states. By considering tallies of state enactments, this work provides a snapshot of state-level policy action. It was not possible here, however, to assess the true scope of policies in action. Doing so will likely prove to be valuable but will require evaluating the implementation and effects of the policies over the long term.
It would be fruitful also for future research to consider in much greater detail state-level considerations, political, economic, or otherwise, that are shaping contemporary penal policy making. As noted in the introduction of this article, this work considered only policy action in 2009; state policy enactments in previous years were not considered. Research suggests that New York, Kansas, Michigan, California, 7 and New Jersey have for years taken deliberate step to reduce prison populations (Austin, 2010; Greene & Mauer, 2010), but in 2009, California and New York were the most active states in this regard, whereas Kansas and Michigan enacted no policies directed at reducing incarceration. Future research should consider state policy developments according to their differential baselines for action.
Second, it may well be that while states are enacting policies to reduce prison populations, there are simultaneous activities, not always represented in formal legislative enactments, designed to stiffen penalties for particular crimes or to shift more of the fiscal burden for corrections to localities (Thompson, 2011). Future research will be needed to examine subtle expansions of crime control and/or movements to redistribute correctional responsibilities and costs to local jurisdictions.
Economists declared the Great Recession over in the summer of 2009, and state revenues have begun to stabilize (Pew Center on the States, 2011). However, the effects of the crisis on state revenues, driven in large part by high unemployment rates, have continued to be felt. It will be particularly important to examine correctional policy shifts in 2010 when much of the American Recovery and Reinvestment Act (ARRA) funds were exhausted. While data for that year are not currently available on all of the variables considered in this research, searchable information on correctional policy revisions in 2010 is available from the NCSL, and it appears that states were quite active that year in developing decarceration policies (NCSL, 2011). Clearly, this is an area where additional research is needed to follow up on state policy responses to the economic crisis.
At this point, it is unclear whether the economic downturn will produce lasting impacts on political calculations of acceptable crime control costs (Cohen, Rust, Steen, & Tidd, 2004) or on broader, normative standards for what we, as society, should be willing to pay for social control (Becker, 1968). Perhaps the downturn will give rise to a new “new penology” in which cost considerations play an even greater role in determinations of risk management (Feeley, 2003; Feeley & Simon, 1992). Likewise, it is possible that recent decarceration movements at the state level will be short lived, that the economic downturn will contribute to renewed social anxiety and subsequent expansion of incarceration, and that it may result in expansion of punishment powers at the federal level (Gottschalk, 2010). Regardless of the direction of future policy trends, it will be important to continue to attend to state-level policy enactments and to consider carefully the complicated influences of economic, political, and crime control conditions on state punishment policy choices.
Footnotes
Acknowledgements
The author would like to thank Greg Zimmerman, Kelly Socia, Andrew Davies, Alissa Worden, and Craig Rivera for their feedback on early drafts of this article. Alison Lawrence at the National Conference of State Legislatures (NCSL) and Matthew Mitchell at the Mercatus Center at George Mason University were helpful in locating data, and Matt Johnson (Niagara University) assisted with data collection and coding. The comments of anonymous reviewers were also helpful in developing this research.
Declaration of Conflicting Interests
The author(s) declared no potential conflicts of interest with respect to the research, authorship, and/or publication of this article.
Funding
The author(s) declared the receipt of the following financial support for the research, authorship, and/or publication of this article: This research was supported, in part, by the Niagara University Research Council.
1.
Beyond anecdotal state-level policy evidence, data from the Bureau of Justice Statistics (Bureau of Justice Statistics, 2011) indicate that most states, 35 out of 50, saw a peak and then decline in incarceration rates between 1995 and 2008.
2.
States exhibit a wide range of per-year, per-person incarceration costs, from a low of US$13,000 in Louisiana to US$44,000 in Rhode Island in the mid-2000s (The Pew Charitable Trusts, 2008, p. 11).
3.
The NCSL enacted legislation listings can be found in http://www.ncsl.org/?TabId=19122. In addition, specific bill numbers for the legislation can be found in  .
.
4.
Income and sales taxes are both highly correlated with unemployment rates, which were not used here to avoid multicollinearity.
5.
The population of African Americans was measured both as a raw percentage and as a squared percentage to tap into potential nonlinearity, but no differences in outcomes were found. Therefore, only the raw percentages are considered explicitly.
6.
At the suggestion of a reviewer, an alternate analysis was run using state prison capacity (e.g., occupancy rate; Sabol, West, & Cooper, 2009c) in place of incarceration rates. That variable was not significant in the model and did not change the significance of other variables or the model overall.
7.
In 2009, a panel of three federal judges in California ordered the state to reduce its prison population by 55,000 inmates in 3 years (Moore, 2009b). The order was the result of two class-action lawsuits, the first filed in 1990 and the second in 2001, contending that overcrowded conditions in state facilities were contributing to lack of access to medical and mental health treatment for inmates. The U.S. Supreme Court recently upheld the order (Brown v. Plata, 2011) requiring California to reduce its prison population by approximately 40,000 in the next few years (Liptak, 2011). For the purposes of this research, the court order in 2009 is unlikely to have made any significant impact on prison populations in that year as the court order was quickly appealed and not immediately implemented.