
Abstract
This study examines the potential impacts on public safety of a sentencing policy focused on offense, as opposed to risk. We utilize a California Department of Corrections and Rehabilitation 2005-2006 recidivism dataset to simulate recidivism patterns of newly realigned state and local supervision groups under California’s “Public Safety Realignment.” The distinction between high- and low-stakes (offense-based) offenders is analyzed through arrest and conviction rates, as well as returns-to-prison. We find that corrections policies based on stakes, as opposed to risk, may produce adverse results regarding public safety. The findings from this study suggest that policy makers should consider risk to recidivate before making large changes to sentencing or supervision policies. Most low-stakes offenders are not at low risk to reoffend, and the types of offenses for which released offenders recidivate are not predictable based on current offense. Thus, risk assessment using criminal histories may be necessary to protect the public and produce better recidivism results.
Introduction
After nearly 40 years of mass incarceration in the United States, many states are facing the economic reality that corrections costs need to be cut. In the fiscal year 2011—the latest year for which data are available—corrections spending represented 3.1% of total state spending and 6.8% of general fund spending (National Association of State Budget Officers, 2013). In 2010, the prison population actually decreased for the first time since 1972, as the number of releases outpaced the number of prison admissions (Guerino, Harrison, & Sabol, 2012). Despite this promising recent trend, many states are grappling with ways to reduce their use of incarceration, both as a way to reduce costs as well as to promote more effective ways of sanctioning offenders. During the past several years, states have utilized a variety of methods to bring about prison reductions. States have expanded good time and earned time programs to reduce prison sentences, scaled back the scope of mandatory drug sentences, and reduced probation revocations and returns to prison. States have also shuttered prison facilities, improved access to rehabilitation programs, and expanded offenses eligible for nonprison sentences (Mauer, 2011; Porter, 2010, 2011, 2012, 2013, 2014; Subramanian & Tublitz, 2012). Some of the most common options focus on the policy levers related to initial sentencing, inmate release, and response to supervision violations (Davies & La Vigne, 2011).
In light of recent large state budget deficits, many scholars point to fiscal concerns as the driving force behind the prison population decline. However, financial pressures alone do not explain the shift. The integration of evidence-based policies, reentry initiatives, sentencing policy changes, and a general move toward being “smart on crime” are also credited for the declining prison populations (Greene & Mauer, 2010; Mauer, 2011; The Pew Center on the States, 2010; Porter, 2010). Aside from the budgetary crisis, some explanations for the recent criminal justice reforms include the following: changes to the violent crime rate, the failure of the war on drugs, and the recognition that a significant portion of those populating the prisons are nonviolent offenders (Cole, 2011). It is also possible that the public majority has reached its limit of tolerating incarceration, or that Americans are more sympathetic toward those behind bars (Cole, 2011), considering the amount of research dedicated to uncovering the collateral consequences of incarceration and how it affects the families and communities of those imprisoned (Hagan & Dinovitzer, 1999; Lynch & Sabol, 2004; Western & Wildeman, 2008). As states move toward alternative approaches, it is important to gauge their impact on public safety.
Using California’s recent reform—“Public Safety Realignment”—as a large-scale case study of decarceration, this article investigates what we might expect to observe when criminal justice responsibility is shifted from the state level to local jurisdictions for large numbers of “lower level” offenders, based essentially on the severity of their current offense rather than the offender’s risk to recidivate. Under Public Safety Realignment, lower level offenders are those convicted of nonviolent, nonserious, and nonsexual felonies. For this article, we consider these offenders as “low-stakes.” They are the types of offenders—primarily drug and property felons—who do not immediately raise public concerns about recidivism or placement on alternatives to incarceration (see, for example, Galeste, Fradella, & Vogel, 2012; Levenson, Brannon, Fortney, & Baker, 2007; Roberts & Stalans, 2004). We estimate the inherent risk of realigned offenders with available data from the California Department of Corrections and Rehabilitation (CDCR). Our study creates two proxy realignment offender groups and uses a 3-year historical recidivism file to estimate inherent public safety risk of those who will remain under state supervision, contrasted with those released to local county control. We want to make it clear that our study is not meant to predict recidivism rates for offenders released after realignment to state versus local supervision. To do so would be misleading, as there are differences in both offender characteristics and supervision strategies (i.e., parole vs. probation strategies that affect post-realignment recidivism). Rather, we are estimating the inherent risk of lower level offenders being released to local supervision under an offense-based policy and what this may portend for counties as they receive thousands of new offenders to supervise.
This study is motivated by four questions about California’s realignment that have yet to be answered:
What are the predicted risk-to-recidivate levels and prior records of lower-stakes offenders targeted for post-prison supervision (Post-Release Community Supervision [PRCS]) by the counties? How do these compare with offenders who will remain under state supervision?
What pressures are lower-stakes offenders likely to place on the local correctional system? In other words, do their histories indicate a pattern of supervision violations and returns to custody?
What public safety risks do the lower-stakes offenders potentially pose in terms of post–prison release recidivism?
What are the implications for state correctional policy based on these findings?
We use data from the CDCR on a cohort of prisoners released from 2005-2006 to create two proxy supervision groups: proxy state parolees and proxy PRCS offenders. Because we are using an historical dataset, we are able to analyze recidivism rates for 3 years following each offender’s release from prison. We explore which types of offenders are being released to the counties when criminal justice policies are based on stakes and current offense rather than criminal history and risk to recidivate.
As the mass incarceration era recedes, the time is ripe to evaluate some of the major policy shifts that are already underway and assess which have promising, long-lasting results. California’s realignment offers the largest effort to date to curtail the detrimental effects of mass incarceration.
Reduced State Prison Populations as a National Trend
From 2006 to 2010, the overall number of prisoners and correctional expenditures in the United States increased. However, a closer examination of 2009 to 2010 reveals a shift (Subramanian & Tublitz, 2012). In 2009, for the first time in 38 years, the imprisonment rate took a downward turn (The Pew Center on the States, 2010) and has continued downward for the past 3 years (Carson & Golinelli, 2013). The overall prison population has declined, but there has been tremendous variation among the states. Twenty-six states managed to decrease their prison populations, some substantially, but several states experienced significant increases (The Pew Center on the States, 2010). Although it is still early to predict whether or not this decline will last, important changes in sentencing and corrections policy hint at a new direction for criminal justice policy in America.
Several states have successfully implemented policies that have reduced both prison population and spending (Subramanian & Tublitz, 2012). In 2010, the Bureau of Justice Assistance launched the Justice Reinvestment Initiative (JRI) to help states develop evidence-based programs and policies that will cut costs and improve public safety (La Vigne et al., 2014). Some of the most common JRI policy provisions and reforms include risk assessment instruments, graduated sanctions for supervision violations, the reclassification of offenses (and consequent sentences), and an increased use of problem-solving courts to handle arrestees with substance use and mental health problems. Other state sentencing reforms focus on a number of areas of both short- and long-term impact, including drug treatment and diversion, community supervision, and prison release policies as well as responses to supervision violations (Clear & Austin, 2009; Davies & La Vigne, 2011; King, 2009). For example, Michigan and Rhode Island increased the use of community corrections while still achieving an overall reduction in correctional costs and reducing the prison population (Subramanian & Tublitz, 2012). Michigan’s success is based on a series of reforms made a decade earlier: repealing mandatory minimums for drug offenders, implementing a comprehensive reentry program, and changing the structure of parole hearings. Michigan reduced its prison population by 12% between 2006 and 2009 (Greene & Mauer, 2010). Kansas, New Jersey, and New York also had notable reductions during that time due to a combination of sentencing reforms, alternatives to prison for drug offenders, reducing time served in prison, using risk assessment tools to aid parole releases, and reducing parole revocations. New York showcased the success of these reforms with a remarkable 20% reduction in its prison population, resulting mostly from scaling back the Rockefeller Drug Laws that were adopted in 1973 (Mauer, 2011). By 2012, Texas reduced their prison population by 5,000 as they devoted more resources to drug treatment and changes to parole violations, rather than build new prisons (Goode, 2013).
Some states have sought to reduce prison churning through supervision reforms. In an effort to improve community supervision in Hawaii, the Hawaii’s Opportunity Probation with Enforcement (HOPE) program was launched in 2004 to reduce probation violations by drug offenders and others at high risk of recidivism (Hawaii State Judiciary, n.d.). Swiftness and certainty of punishment are prioritized over severity, which typically results in several days in jail for each violation of probation. A central premise of this approach is to focus resources on those most in need of substance abuse treatment and those most likely to recidivate. Because of the incredible success of HOPE in Hawaii—a 92% reduction in missed probation appointments and a 96% decline in positive drug tests after 3 and a half years—the Washington State Department of Corrections fully implemented this high-intensity supervision model in 2012. By the end of the first year, 14,500 of their highest risk probationers and parolees were enrolled in the program (Warner, Aylward, & Mullins, 2012).
Some states have shifted offenders to local jurisdiction responsibility in an effort to cut down on state prison spending and improve public safety (Davies & La Vigne, 2011). The hope is that increased investment in community supervision will help cut costs while reducing prison populations. Evidence-based community programs and policies have been shown to be less expensive and more effective at reducing recidivism compared with incarceration as long as individual criminogenic risks and needs are addressed (Andrews, 2006; Andrews et al., 1990; Engel, 2009). Risk assessment helps identify those most at risk for reoffending, improves the placement of offenders into appropriate programs and services, improves the utilization of resources, and enhances public safety (Andrews, Bonta, & Wormith, 2006; Latessa, 2004; Latessa & Lovins, 2010). The field has recognized the importance of incorporating risk assessment in offender supervision and programming for quite some time (Clawson, Bogue, & Joplin, 2005; DeMichele, 2007).
California’s Effort to Reduce Its Prison Population
Although many state efforts are impressive in their own right, none has matched the sheer magnitude of changes taking place in California. The first major effort to reduce the incarcerated population and prison costs in the past 15 years was California’s Proposition 36, which went into effect in July 2001. This program successfully diverted over 30,000 nonviolent offenders from entering prison through community drug treatment (King, 2009). In Years 5 and 6 of the program, nearly 7 out of every 10 referred offenders entered treatment. Over 30% of offenders who entered treatment under Proposition 36 completed the program and were discharged from probation or parole (Urada et al., 2008). In more recent years, the state has enacted a number of reforms and policies to reduce its prison population further, including the use of out-of-state prison placements, enhanced credit earning, summary parole, the use of a parole-violation decision-making instrument, and incentives to counties for keeping probation failures in the local community. None of these prior efforts, however, had significant expected or actual impacts on the prison population close to those projected for realignment (Administrative Office of the Courts, 2013; Turner, Braithwaite, Kearney, Murphy, & Haerle, 2012).
However, the situation changed dramatically in 2011. As part of California’s effort to comply with a three-judge court order to reduce its prison population (described in greater detail below), the state enacted legislation known as “California’s Public Safety Realignment.” Under realignment, thousands of offenders historically sentenced to prison as well as those supervised after prison by the state are now the counties’ responsibility. As Petersilia and Snyder (2013) note, “This is the biggest penal experiment in modern history” (p. 268). However, because no state funding was set aside for evaluation, and counties were not legally obligated to keep track of or evaluate their locally sentenced and supervised populations, most of how this policy has affected the counties remain unknown (Misczynski, 2012; Petersilia & Snyder, 2013).
California Realignment
Over the last two decades, the CDCR has faced serious charges for providing inmates with constitutionally inadequate medical (Plata v. Schwarzenegger, 2009) and mental (Coleman v. Schwarzenegger, 2009) health care. Several experts, supported by reports of the federal court–appointed Receiver and Special Master, concluded that the problems were rooted in prison overcrowding. A three-judge court ordered California to reduce the prison population to 137.5% of design capacity in August 2009. The U.S. Supreme Court upheld the order on May 23, 2011, giving CDCR 2 years to meet this requirement. A recent court order has extended the date to February 28, 2016 (Order Granting in Part and Denying in Part Defendants’ Request for Extension, 2014).
This historic legislation took effect October 1, 2011. Assembly Bills 109 and 117 (California’s “Public Safety Realignment” initiative) make several fundamental changes to sentencing and community supervision in California. With realignment, certain sentenced felons remain under state control while others are handled locally. In essence, high-stakes offenders—those with a current or prior conviction for serious, violent, or sex felonies—continue to go to state prison, while low-stakes offenders—those who have not committed an offense perceived to threaten public safety—stay locally. Realignment also transfers responsibility for post-prison supervision for lower-stakes offenders to the counties, keeping higher “stakes” offenders under state parole supervision. Eligibility for PRCS is based on current offense; those who have prior serious or violent offenses are eligible for local supervision after release from prison. The legislation also addressed the problem of parole violators “churning” back to prison by requiring virtually all parole violators to be sanctioned locally, as opposed to being sent back to prison for what was previously very short (4-month average) prison stays (Grattet, Petersilia, & Lin, 2008).
In negotiating realignment with the counties, the state maintained that local supervision of offenders would produce better results (Grattet, 2013). County responsibility is supposed to maintain public safety, if not reduce crime rates further. Only low-stakes offenders—again, those whose current sentence was not a serious or violent offense—would be released to local county probation supervision after release from prison. What is striking about the legislation is the virtual absence of “risk” based criteria in decisions made about local versus state responsibility, despite the fact that CDCR had officially incorporated risk assessment in other decision-making and prison programming policies (CDCR, 2007; Turner, Hess, & Jannetta, 2009). The only consideration of risk to recidivate in the legislation is for sex offenders—a group generally considered high-stakes by legislators, the media, and the public—for supervision after prison, 1 despite research findings that officially reported recidivism rates among sex offenders are lower than those of nonsex offenders and nonserious or nonviolent criminals (CDCR, 2010). PRCS is also a policy based on current offense rather than criminal history, which presupposes criminal specializing even though research on criminal offending patterns shows that most offenders do not specialize or create a “criminal career” in a particular type of crime (Delisi, 2003; Piquero, 2000; L. M. J. Simon, 1997). PRCS assumes “stakes” based on a single incarceration event (the most recent) and ignores previous offending behaviors and their accompanying recidivism rates.
Data and Method
The CDCR provided the data used in the current study. The dataset contains criminal information for the entire released state prisoner cohort in 2005-2006. 2 It includes variables for primary offense, reason for return to custody (RTC) for current offense, number of prior stays in prison, number of prison stays for the current case, 3 whether or not the offender is a current or prior serious or violent offender, sex offender registration, and mental health code status. The California Static Risk Assessment (CSRA) score is also included. The CSRA was developed to predict post-release recidivism based on static risk factors derived from existing data sources at CDCR and the California Department of Justice (Turner et al., 2009). It assesses the offender’s risk to recidivate primarily using criminal history and places offenders in one of the following categories: high violent risk, high property risk, high drug risk, moderate risk, and low risk. The CDCR dataset also records recidivism within the first 3 years after release by the number of days before arrest, conviction, and whether or not the offender was returned to custody.
Females were not included in our study because the variables required to determine sex offender risk and mentally disordered status were not available for this subgroup. Excluding females (10.5% of the entire sample), the sample size for analysis is 97,133 male releasees.
Study Group Assignment: Proxy State Parole and Proxy PRCS
We analyze potential public safety risks using the historical dataset of released California prisoners. Again, we want to make clear that our analysis is not measuring post-realignment parole versus PRCS recidivism rates, nor are we attempting to analyze changes to sentencing under realignment. We are estimating the inherent public safety risk of offenders that counties are now receiving after release from prison. Assignment to proxy groups mirrored the definition of offenders who would be placed on parole or PRCS under realignment legislation. For the purposes of this study, an offender was considered to be in the proxy state parole group if he was a current serious/violent offender, a high-risk sex offender (HRSO), or an offender with mental health history who met certain conditions (see Table 1). A “serious felony” is any offense as defined by California Penal Code Section 1192.7(c). A “violent felony,” which is not mutually exclusive, is any offense as defined by PC Section 667.5(c). Some of the offenses considered serious or violent include murder or attempted murder, voluntary manslaughter, rape, lewd acts with a child, any felony that causes great bodily harm, assault with a deadly weapon, arson, mayhem, kidnapping, and so on. PC Section 290 to 290.023, known as the “Sex Offender Registration Act,” lists the sex offenses for which certain offenders are required to register with the local police or sheriff’s department. A HRSO is a sex offender who is required to register pursuant to PC Section 290 and has been determined by a risk assessment tool to pose a higher risk to commit a new sex offense in the community. CDCR utilizes the Static-99R tool for males. There was no variable for HRSO status, but these offenders were approximated using sex offender registration and CSRA scores. Mentally ill offenders were determined by mental health codes, institution levels, and types of conviction offense.
Study Operationalization: State Parole Group Approximation.
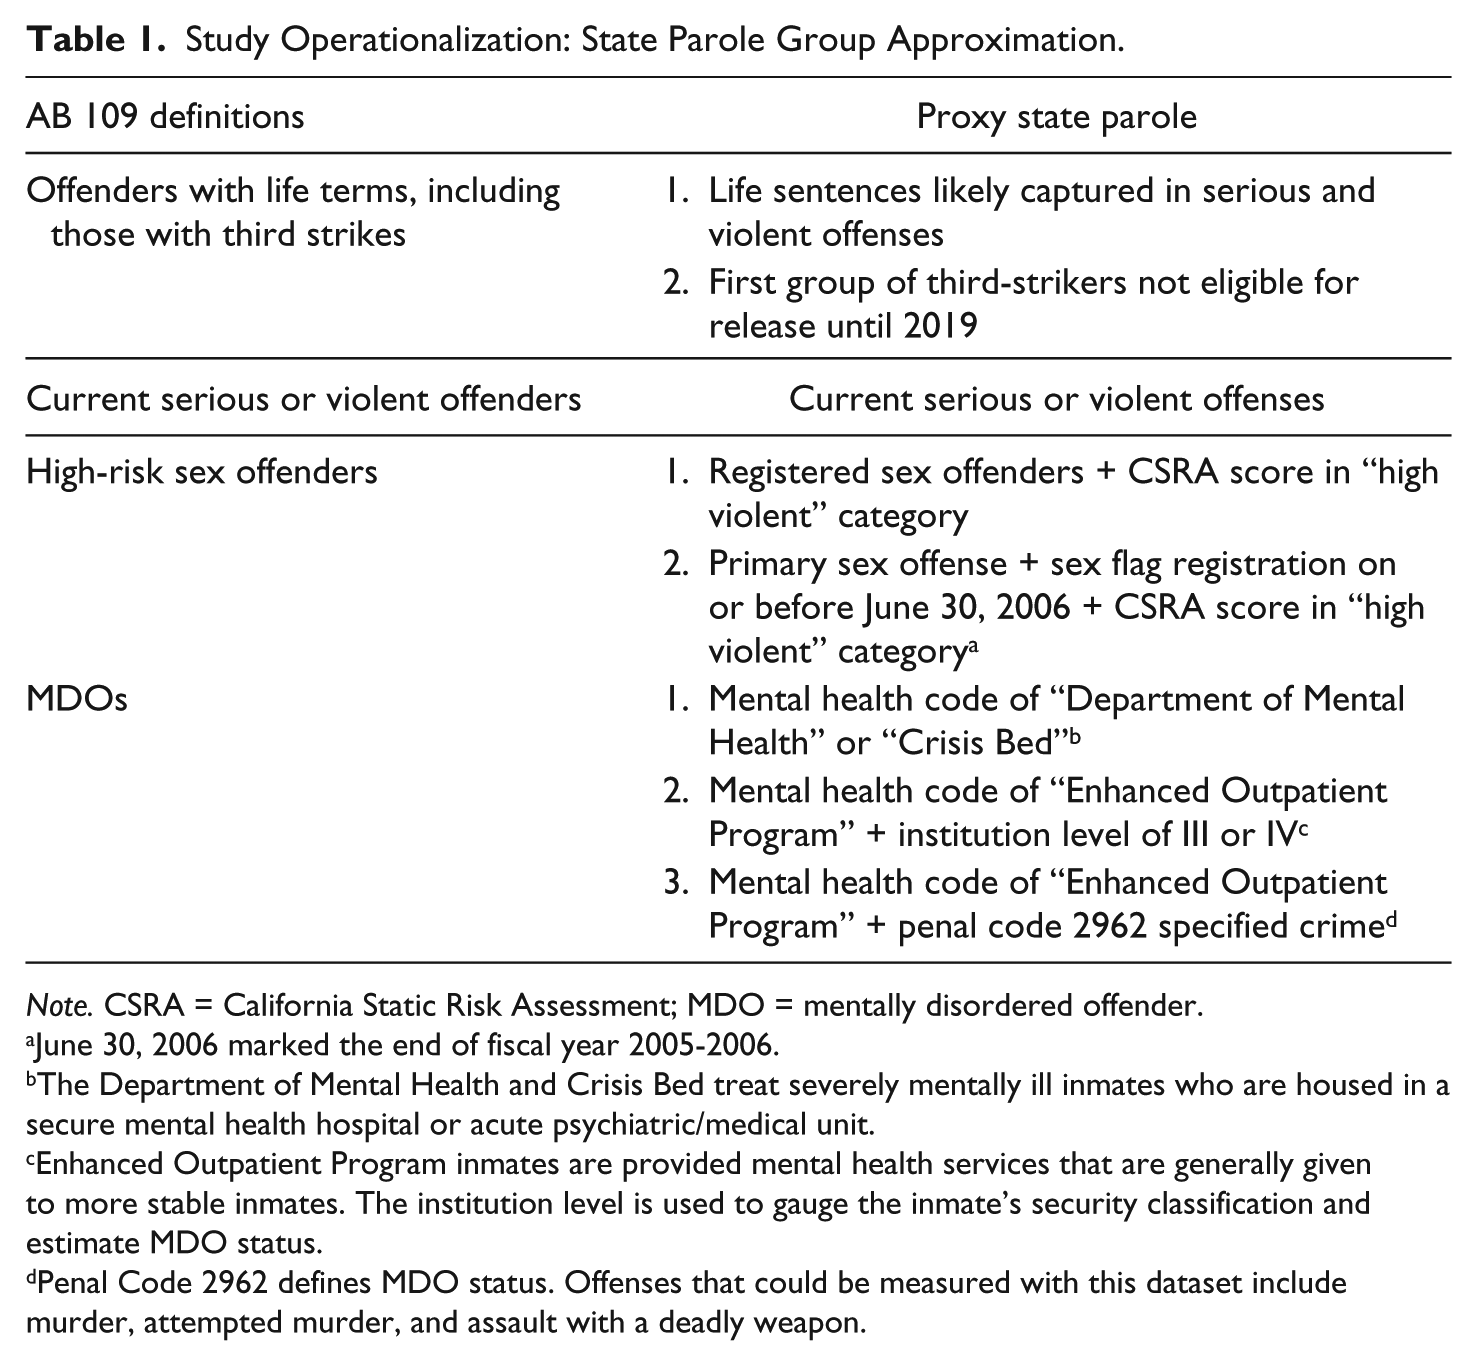
Note. CSRA = California Static Risk Assessment; MDO = mentally disordered offender.
June 30, 2006 marked the end of fiscal year 2005-2006.
The Department of Mental Health and Crisis Bed treat severely mentally ill inmates who are housed in a secure mental health hospital or acute psychiatric/medical unit.
Enhanced Outpatient Program inmates are provided mental health services that are generally given to more stable inmates. The institution level is used to gauge the inmate’s security classification and estimate MDO status.
Penal Code 2962 defines MDO status. Offenses that could be measured with this dataset include murder, attempted murder, and assault with a deadly weapon.
In the Assembly Bill 109 legislation, several other criteria were specified. For example, third-strikers and those released from life sentences were to be placed on state parole. In the 2005-2006 recidivism data, there were no third-strikers eligible for parole. Although the dataset did not have an indicator variable for a life sentence, the crime committed is very likely to be considered a serious or violent crime. Thus, “lifers” are absorbed into the proxy state parole group by the other criteria (e.g., sex offender, serious/violent offender). All remaining offenders were considered proxy PRCS offenders. Our categorization resulted in 22,848 offenders in the proxy state parole group and 74,285 offenders in the proxy PRCS group. 4
Measuring Recidivism
There is no universally accepted measure of “recidivism,” and different measures capture different aspects of offender and system behavior. As noted by Ball (2012), arrest rates can “serve as a proxy for how aggressive and/or effective law enforcement is in a particular locale at the front-end” (p. 12); therefore, arrest rates can serve as an indicator for how busy the counties’ law enforcement might be. A “raw” arrest—one not necessarily followed by a conviction—does not indicate guilty behavior, but it does give a closer estimate of the offense date if a crime was in fact committed (Maltz, 1984). Hence, there are advantages to the different measures of recidivism. We use multiple indicators of recidivism as measured by whether or not the offender was arrested, convicted, or returned to custody within 3 years after release from prison. The return status (e.g., as a parole violator or new admission) and type of offense for which an offender was returned to prison/custody are also examined. We note that, under realignment, the vast majority of offenders will not be returned to prison for violations. The types of the offenses are examined for which offenders were returned to prison in our (pre-realignment) dataset primarily to understand the nature of offender criminal behaviors we might expect to see.
Table 2 presents the background characteristics of the proxy parole and proxy PRCS offenders. The racial and age makeup of each group are comparable. As expected, the current offenses for the groups are different—the overwhelming majority of the proxy state parole offenders are current serious or violent offenders, reflecting realignment major classification based on offense.
Descriptive Statistics: Proxy PRCS and Parole Groups.
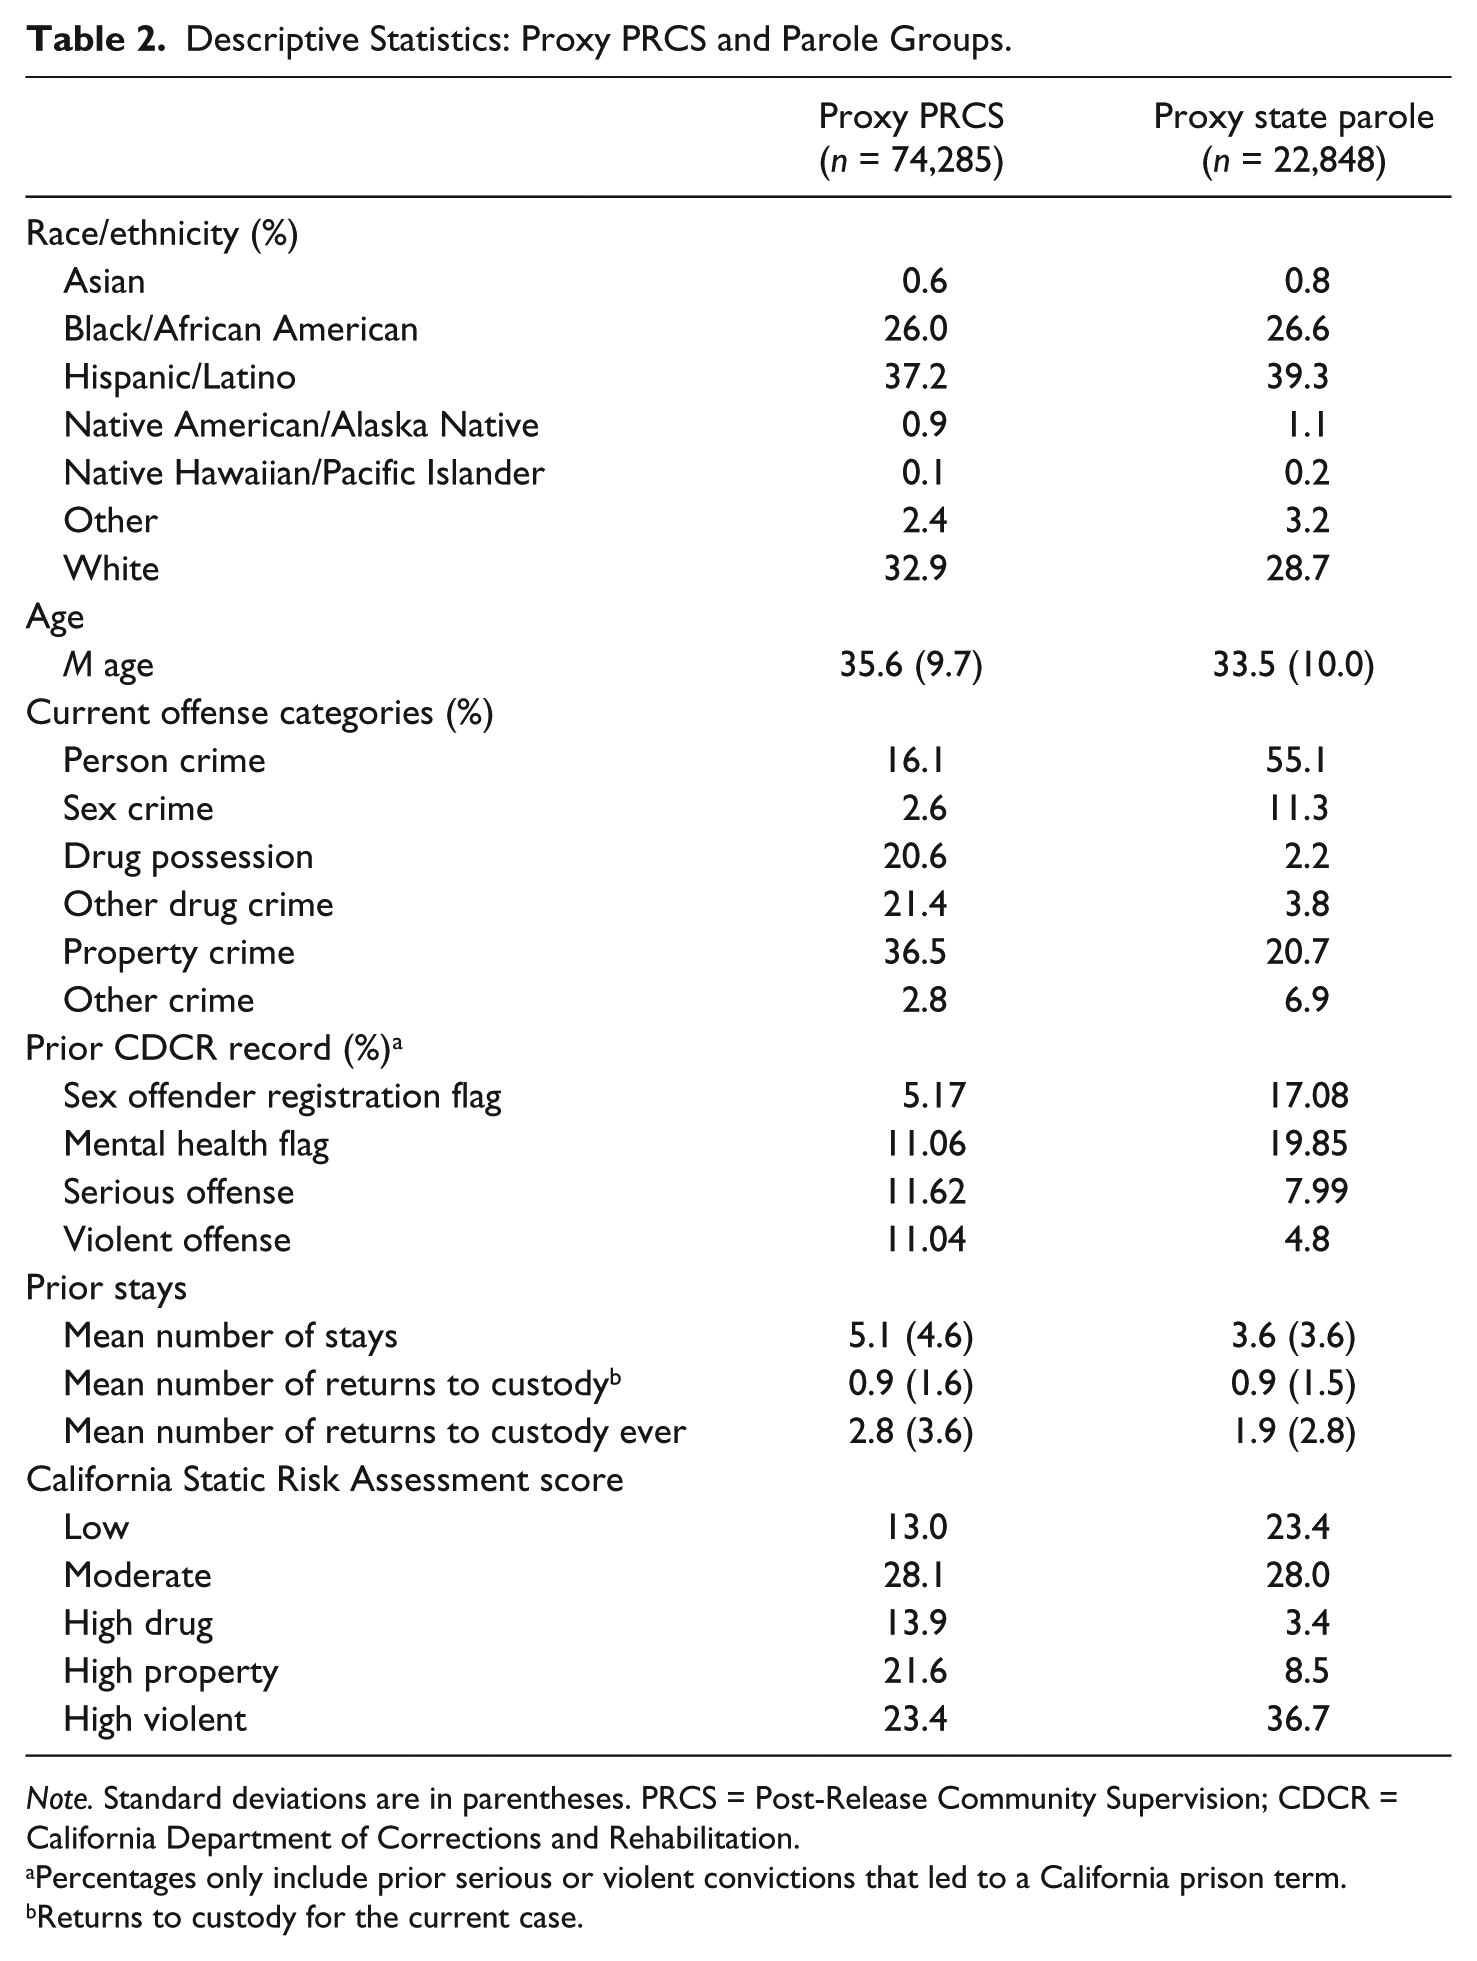
Note. Standard deviations are in parentheses. PRCS = Post-Release Community Supervision; CDCR = California Department of Corrections and Rehabilitation.
Percentages only include prior serious or violent convictions that led to a California prison term.
Returns to custody for the current case.
Most of proxy PRCS were incarcerated for drug-related or property offenses. Only 16% were convicted of person crimes, and less than 3% were serving time for a sex offense. 5 The majority of the proxy state parolees were serving time for person crimes. Over 11% of the proxy state parole group have current sex crime convictions, and nearly 21% had been sentenced for property crimes. Only 6% of the proxy state parole group were serving sentences for drug-related offenses, and about 7% for crimes that fell in the “other” category. The proxy PRCS offenders also had, on average, a higher number of stays in prison, more returns to custody for the current case, and more total returns to custody (including previous cases) than the proxy state parole offenders. 6
The CSRA score, which is not used to determine state or county assignment under realignment, indicates how many in each proxy group are at low, moderate, and high risk to recidivate. Of the proxy PRCS offenders, only 13% are considered low risk, and 28% are moderate-risk offenders. This leaves the remaining offenders (59%) in the high risk to recidivate category, and approximately 23% of these high-risk offenders are considered “high violent” by the CSRA instrument. Among the proxy state parolees, over half are in the low- and moderate-risk groups, and nearly 37% are considered high-risk violent offenders. Overall, the proxy PRCS group has a higher percentage of offenders considered high risk than the proxy state parole group. 7
Although the proxy PRCS offenders, by definition, are not high-stakes sex offenders, high-stakes mentally disordered offenders (MDOs), or current serious or violent offenders, there are some lower-stakes sex and mental health offenders in the proxy PRCS group (5.17% and 11.06%, respectively). Among the proxy PRCS offenders, over 11% have prior serious offenses that resulted in a prison term, and roughly 11% have prior violent offenses. The “priors” only include serious or violent offenses that led to a commitment with CDCR; out-of-state offenses and offenses that resulted in probation or jail are not included. Therefore, there are likely more offenders in the “low-stakes” population that have committed a serious or violent crime. The percentage of proxy PRCS offenders with prior serious or violent offenses is actually higher than proxy state parolees with priors. The vast majority (87.2%) of those remaining under state supervision do not have prior serious or violent CDCR records. Only 4.8% of the proxy state parolees have a prior violent offense on their CDCR record.
Analytic Strategy
We first review recidivism rates for the two proxy supervision groups by current offense. Next, recidivism analyses display the arrest, conviction, and returns to custody within the 3-year follow-up period. We analyze the status of reincarcerated offenders to see whether the groups were returning to prison for new crimes or parole violations. Finally, we perform a closer inspection of return status by comparing the types of offenses committed after release.
Results
Table 3 presents recidivism rates—as measured by arrest, conviction, and returns to prison—for 3 years following release. Each proxy group is broken down into six mutually exclusive current offense groups: person crimes, sex crimes, drug possession only crimes, other drug crimes (including manufacturing and sales thereof), property crimes, and other crimes (i.e., escape, driving under the influence, arson, possession of weapon, and other offenses).
Three-Year Recidivism Rates by Proxy Supervision Groups and Current Offense (N = 97,133).

Note. PRCS = Post-Release Community Supervision.
The offense for which the inmate was originally incarcerated.
The overwhelming majority of both proxy groups were arrested within 3 years after release, with rates of 79.7% for proxy PRCS and 71.4% for proxy state parole. The offense group with the highest arrest and conviction rates in both proxy supervision groups are those serving time for drug possession, though proxy PRCS property offenders are a close second. Property offenders have the highest return to prison rate for proxy PRCS, followed by those charged with drug possession. Just over 71% of proxy PRCS sentenced for person crimes were returned to prison within 3 years. Those sentenced for drug possession again have the highest rate among the proxy state parole group. The proxy PRCS group recidivated at a higher rate within almost every type of offense group, including the subgroup of person and sex offenders, and for all three types of recidivism. Only proxy state parolees serving sentences for drug offenses returned to prison at a higher rate than the proxy PRCS offenders (78% compared with 74% for drug possession only offenders, and 59% compared with 58% for other drug offenses), though the differences are relatively small.
Returns to Prison
Prior to realignment, the majority of parolees returned to CDCR were not returned to prison via the courts as a result of a new criminal conviction, but through the parole-violation process (Grattet et al., 2008). The latter uses a lower standard of proof—“preponderance of the evidence” as opposed to “beyond a reasonable doubt”—and handles both technical violations of parole conditions, such as not reporting to a parole agent, as well as new criminal behavior. Because parole in California is considered an extension of the felon’s sentence and not a reward for good behavior, the state parole board may legally revoke their parole and return them to prison (Grattet et al., 2008). This “back-end sentencing” contributed heavily to California’s high parole revocation rate in the past.
Figure 1 displays a more detailed analysis of returns to prison. Parole violators are those who were returned to prison by the parole board without receiving a new court-imposed sentence. Parole violators with new court convictions, however, were parolees returned to prison with a new criminal conviction through the court process.
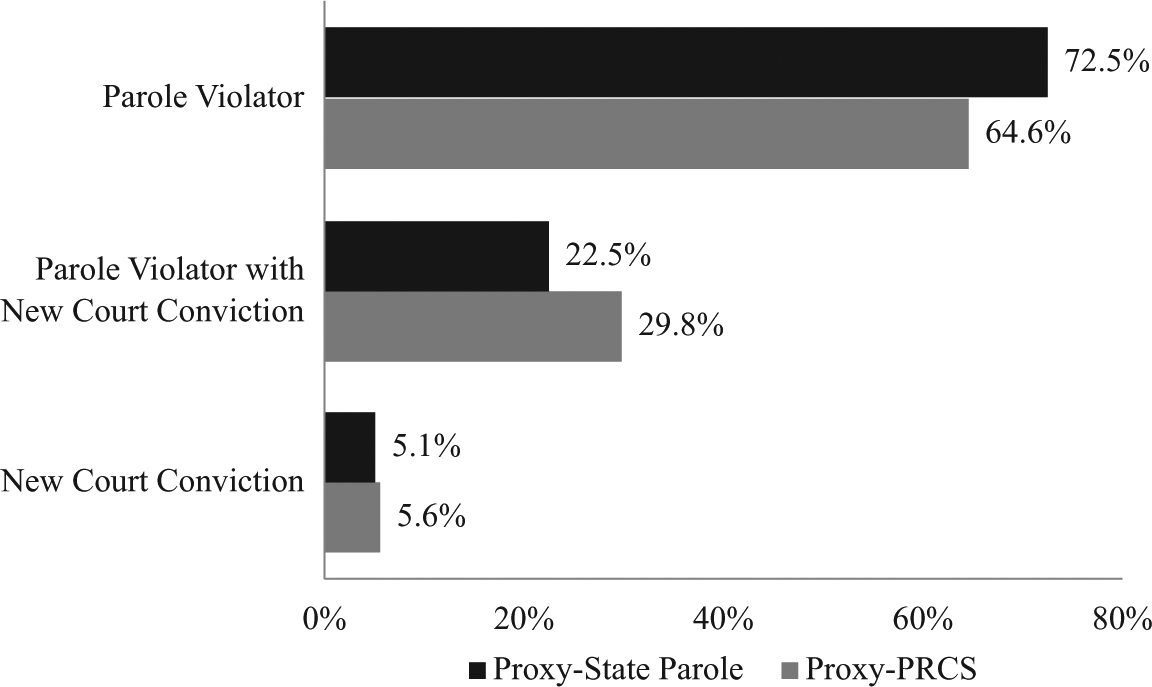
Status of offenders returned to prison within 3 years.
Most offenders were returned for parole violations without new terms. However approximately one quarter of proxy state parolees were convicted in court of a new criminal offense either after they discharged from parole as a “new admission” or while on parole as a parole violator with a new term. Roughly 35% of proxy PRCS returned for a new offense. More specifically, only about 5% of the proxy PRCS and proxy state parole groups returned to prison as new admissions. 8 Parole violators with new terms were more common: one in five proxy PRCS offenders returned for a parole violation with a new court conviction, and over one in four proxy state parolees returned under this status. This is not surprising given that virtually all parolees are placed on a 3-year parole supervision. Most offenders were returned for parole violations without new terms for both proxy supervision groups, though historically, the violations that merit a RTC are also criminal in nature (Grattet et al., 2008). In general, the proxy PRCS offenders have similar percentages of the three return statuses compared with the proxy state parole group, though the proxy state parolees are returned to custody without being charged with a new crime slightly more often than the proxy PRCS group (who are returned more with new charges). 9
New Admissions and Parole Violations With New Terms
We next examine the types of offenses for which offenders were returned to prison. Table 4 displays only those who were returned to prison with a new term (n = 16,511). The returned offense categories are the same as the six primary (current) offense categories (see “Current offense categories” in Table 2), and the new crime return statuses include new admissions (discharged parolees with new court convictions) and parole violations with new court convictions.
Return Offense for Violations With New Terms and New Admissions by Proxy PRCS and Proxy State Parole (n = 16,511).
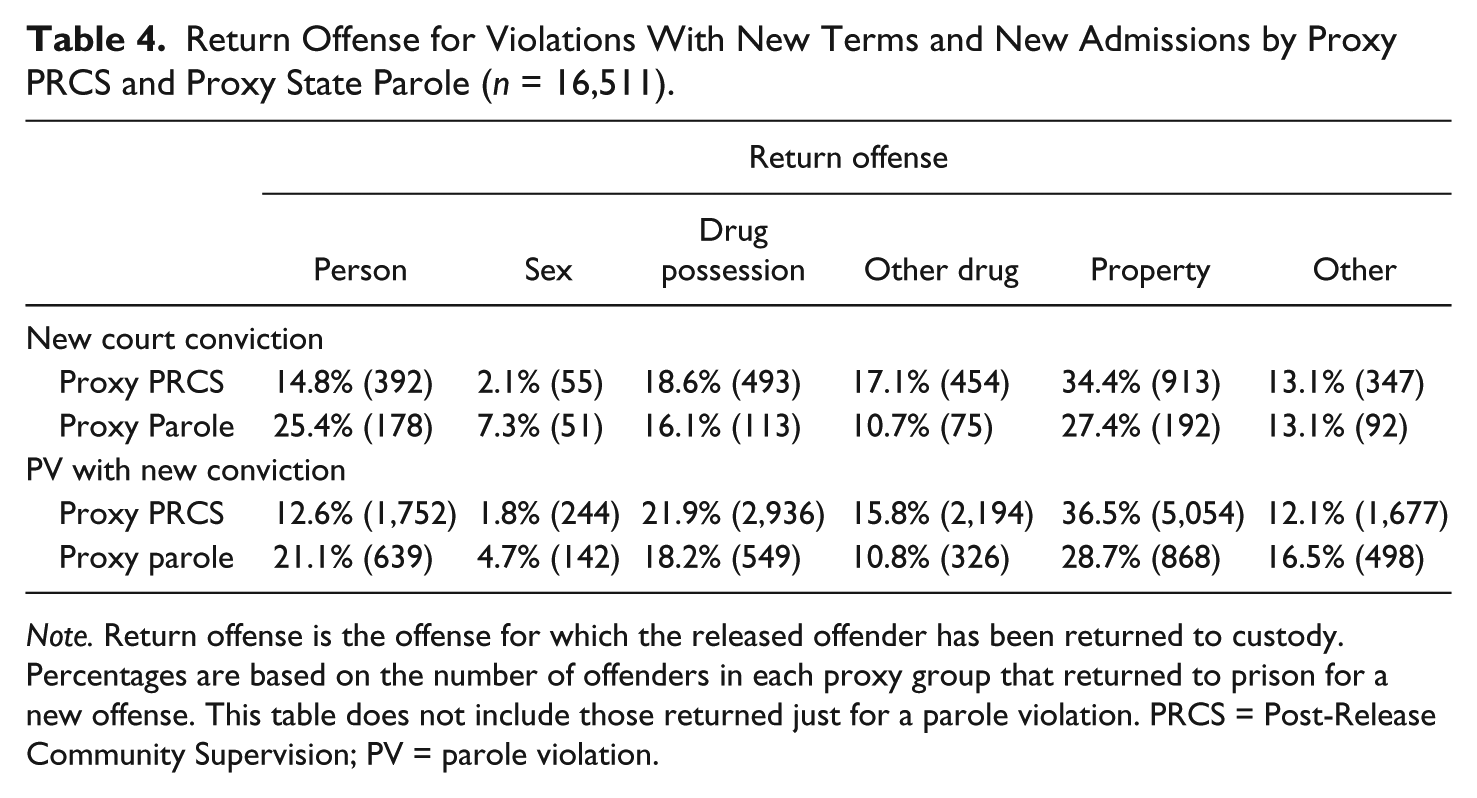
Note. Return offense is the offense for which the released offender has been returned to custody. Percentages are based on the number of offenders in each proxy group that returned to prison for a new offense. This table does not include those returned just for a parole violation. PRCS = Post-Release Community Supervision; PV = parole violation.
Of those discharged from parole and returned for a new crime, a higher percentage of the proxy state parole offenders were returned for person or sex crimes. Proxy parolees were less likely to return to prison for drug-related or property crimes once discharged, and both groups were equally likely to return for other crimes. Released offenders who returned to prison as parole violators with new terms displayed a similar pattern; among those returned with a new court conviction, proxy PRCS were more likely to return for drug-related offenses and property crimes, and proxy state parolees were more likely to return for new person, sex, and other crimes. In this case, the high-stakes offenders returned to prison for new crimes were returning with high-stakes crimes more often than the low-stakes offenders (though not overall, as noted in Figure 1)—suggesting some crime specialization. However, person and sex crimes only make up approximately one fourth of the new crimes that the proxy state parolees are returned to prison for. The majority of high-stakes offenders who are returned to prison for a new court conviction are returned for a lower-stakes crime (i.e., drug, property, or other). Proxy PRCS offenders are also mostly returned to prison with new convictions for drug-related and property crimes, although 17% are returned for either a person or sex crime after discharge, and over 14% of those returned to prison are returned for these high-stakes offenses while on parole.
Discussion and Conclusion
Based on the findings of this study, the locally supervised PRCS offenders may not be as inherently “low-stakes” as the political discourse regarding realignment would suggest. Our first research question inquired about the predicted risk-to-recidivate levels of PRCS offenders and state parolees. We find that 80% of the proxy PRCS offenders—those offenders who under realignment are now being supervised by the counties—had been arrested within 3 years after release; 52% had been convicted; and 70% had been returned to prison. California’s realignment based post-prison supervision on current offense. The resulting proxy groups are very similar in some respects (i.e., demographics, return to prison statuses) but diverged in terms of criminal histories, current offense, and various measures of recidivism. Next, we asked whether the histories of PRCS offenders indicate a pattern of supervision violations and returns to custody. As we suspected of the lower-stakes group, our analyses suggest that the proxy PRCS offenders are likely those who contributed heavily in the past to the prison churning problem in California. The proxy PRCS offenders had more previous stays in prison and returns to custody than the proxy state parole offenders, and a higher percentage of them had prior serious or violent offenses on their records compared with the proxy state parolees. They also had more offenders scoring in one of the high-risk categories of the CSRA. This finding addressed our third research question regarding the potential public safety risks that PRCS offenders pose. Over 23% of proxy PRCS offenders were scored as “high violent” by the CSRA, which may at first appear surprising but less so after one considers that more than one in five proxy PRCS offenders had a serious or violent prior conviction. It is, however, a disconcerting finding with respect to public safety. Our findings appear to be born out in early observations of realignment. A recent CDCR report showed higher percentages of high-risk offenders in PRCS than on parole during the first year of realignment (CDCR, 2013). Many probation departments have been concerned that the realignment population would be higher risk and higher needs than originally anticipated (Abarbanel, McCray, McCann Newhall, & Snyder, 2013). We address our fourth research question on state correctional policy implications in the following section.
Under realignment, offenders (other than those with life terms) can only be returned to prison if their crimes are eligible for a prison sentence. Therefore, if these revocations are not due to new, serious crimes committed by released offenders, the counties will now be responsible for sanctioning the lower level arrests as well as supervision violations. This is especially true for the proxy PRCS offenders, who (historically) recidivated at a higher arrest, conviction, and return to prison rates than the proxy parolees. The proxy PRCS group was also returned to prison more often with a new court conviction, mostly for lower level drug or property crimes, although 17% returned for either a new person or sex crime conviction. The majority of both proxy supervision groups returned to prison for parole violations without new terms, which means most offenders recidivated with technical violations or low-level offenses that were processed by the parole board. While returning offenders to prison for low-level crimes or supervision violations used to be a viable option for the counties, most violations must now be managed by the counties. Our findings suggest that counties will be dealing with large volumes of lower level supervision violations as a result of realignment.
The fact that the counties are receiving some of the most criminally active offenders in the state puts pressure on county jails under realignment. This will inevitably result in more overcrowding issues. In fact, local jails are already facing overcrowding issues as a direct result of realignment (Lofstrom & Raphael, 2013). At the end of 2012, the jail population was reported to be 11% higher than the previous year (Chief Probation Officers of California [CPOC], 2012). To avoid jail overcrowding, observers have recommended that counties would benefit from using evidence-based alternatives to incarceration at every stage of the system, reserving jail beds only for offenders posing the highest risk to the public (Hopper, Evans, & Soltani, 2011). The counties are now responsible for handling tens of thousands of new offenders, and there are simply not enough jail cells to contain all of these offenders. 10 Our findings suggest that large numbers of locally supervised offenders will be arrested and possibly reincarcerated at the local level. Therefore, prioritizing alternatives to jail which focus on social services and treatment may prove to be more cost-effective solutions (Boganowski, 2011; Pearson & Lipton, 1999; Peters & Murrin, 2000; Zweig, Yahner, & Redcross, 2010). This is particularly salient for locally supervised offenders who can now access these services closer to where they live and where progress in treatment may be interrupted by shorter periods of incapacitation. 11 Social services have been proven to reduce recidivism, but they have to be accessible to the offenders for them to work (Hipp, Petersilia, & Turner, 2010). Each county has discretionary control over sentencing and supervision, but they have been strongly urged in the legislation, and by interest groups, to approach this reform as an opportunity to adopt more alternatives to jail (e.g., home detection, day reporting centers, community service, and restorative justice programs), incorporate evidence-based programs, and help lead the country toward the end of the mass incarceration era. Many counties outlined early plans for these alternatives; however, it is not yet known whether counties are actually using realignment as an opportunity to “do something different.” An ongoing study by RAND is examining this issue in 12 California counties.
Limitations
The proxy supervision groups were created to reflect definitions in realignment legislation as closely as possible, but there were some areas in which this was not possible due to the limitations of the data. Females were excluded from the analysis because information on sex offender risk level was not available for women. Realignment affects both male and female offenders, and female offender recidivism would have been an important contribution to the study as female offenders make up 10% of the released prisoner population. Although the male sex offender stakes levels were estimated using the CSRA tool, there was not a perfect correlation with the Static 99 tool, which is used to determine PRCS eligibility by CDCR. It is likely that there are some discrepancies between the Static-99-determined HRSOs and our definition using the CSRA risk tool. 12 Offense classifications were also too general in the dataset to determine definitively whether or not offenders were MDOs. Our proxy group was established using mental health status, institution level, and the few offense types in the dataset that matched the PC 2962 offenses, but the MDO classification could only be approximated. The offenders who were not identified by this approximation as MDOs, however, are few in numbers, and thus, not likely to affect our results. Finally, our study is relevant to one population under realignment—those offenders returning from prison to the community. Data are not currently available to study offenders sentenced to serve felonies locally versus state prison—an important area of future study.
Policy Implications
Realignment Experience to Date
Although still early, it appears that realignment’s aims to significantly reduce California’s prison population and lower state prison costs have not been entirely met. The three-judge court ordered California to reduce its prison population from approximately 150,000 (188%) inmates to 110,000 (137.5%) in August 2009, but the current population (as of June 2013) remains at 119,000 (Grattet, 2013). The financial aspect of realignment, however, has been largely successful for the state. A recent performance audit of CDCR reports an expected savings of US$1 billion in the Fiscal Year 2012-2013 (Department of Finance, Office of State Audits and Evaluations, 2013). The Governor’s revised budget for 2013-2014 includes US$9.2 billion for state corrections (Graves, 2013), a 2% increase from the year before, but a 5% decrease from the year prior to realignment. While the population targets have not been met by the CDCR, there has been a considerable reduction in corrections spending.
A report issued in March 2012 by the American Civil Liberties Union (ACLU) of California also provided less than promising results among the counties. After reviewing 53 available county realignment implementation plans, the ACLU reported that there has been a considerable increase in spending on county jails, and the jails were filled with a large number of people who present no real threat to the public (Hopper et al., 2011). Moreover, the promise to adopt alternatives to incarceration and to use evidence-based practices is yet to be demonstrated. The decreased reliance on state prisons provides California with significant savings, but not all 58 counties are contributing to this trend equally. Out of the 28 counties that showed larger than average declines, 19 were the same counties that already had lower than average commitments to state prison rates, and 7 counties actually increased (Males, 2012).
What has been realized post realignment were some of the primary concerns of this legislation: an overall increase in every category of reported crime (Mueller, 2013), and many maxed out local county jails potentially leading to the same problem that the state faced—constitutionally inadequate health care (Quentin Hall et al. v. Margarget Mims et al., 2011; Quinton Gray et al. v. County of Riverside, 2013). While the former is not clearly a result of the recent policy, and crime trends are not consistent across counties in the state, the latter is undoubtedly due to changes imposed by realignment. In addition, the costs of realignment have exceeded what some counties had anticipated. “Several counties have observed that realigned prisoners have more medical and mental health needs than other jail inmates, and that it is costing more than expected. But we have not seen any quantitative documentation or evaluation of these costs” (Misczynski, 2012, p. 20). We are still lacking substantive data to either confirm or reject claims that these are realignment-actuated issues.
A Mixed Message of Philosophies
Changes to community supervision over the last 30 years have demonstrated shifting currents with respect to rehabilitative versus punitive models as well the role of the individual offender in corrections policy. Feeley and Simon (1992) describe a recent paradigm shift as “the new penology,” in which aggregated risk assessment, rather than reintegrating individuals back into the community, has become a central focus of the field. This systemic transformation coincides with the increased use of monitoring and surveillance techniques that emphasize efficiency (e.g., electronic monitoring and geographic information system [GIS]; Feeley & Simon, 1992; Rhine, 2012), drug testing, and intensive supervision programs (Rhine, 2012). According to this paradigm, parole agents dedicate the majority of their time to detecting and catching violations and sanctioning noncompliance (Rhine, 2012)—a reflection of the shift toward the era of what Jonathan Simon (1993) calls “managerial parole.”
Ironically, California eschewed a risk-management approach in its selection of offenders to be “realigned.” As noted earlier, the concept of risk is virtually absent in deciding who will remain under state supervision and who will be assigned to local county supervision. Instead, a “just deserts” model (Barton, 2004; Von Hirsch, 1976) seems more descriptive—one in which the nature of the crime trumps risk assessment. At the same time, realignment emphasizes the opportunity for counties to change the current “get tough” discourse that we have seen over the last couple of decades in favor of a rehabilitation-focused reentry model. Although the three-judge court did not specify how California was to reduce their prison population, community-based alternatives were emphasized as the most viable options. Many counties have incorporated risk and needs assessment, and invested in evidence-based techniques to increase offenders’ chances of more successful reentry (CPOC, 2012). The failure to incorporate risk in offender realignment selection coupled with an emphasis on using risk principles in county supervision may seem contradictory. However, it may reflect the political sensitivities associated with a policy that can be seen as “giving a break” to certain offenders leaving prison. Serious and violent offenders, as well as sex offenders, still receive “harsher” treatment under realignment (i.e., they are not eligible for local sentencing or supervision), regardless of their risk-to-recidivate.
Concluding Thoughts
Mass incarceration is a result of a myriad of policies over the past 40 years, yet states are appearing to head in a new direction: one that is away from mass incarceration and perhaps back toward rehabilitation and reintegration. As the country begins to show signs of movement, it is important to thoroughly review the processes already underway in some of the leading states. California has scaled back prison sentencing and parole in an effort to meet a court order, but these changes may have long-term effects on the way California addresses crime. If other states model their approaches after California’s realignment initiative, they may substantially reduce their prison populations—but at a cost. A policy that realigns offenders based on current offense may inadvertently make counties responsible for some of the highest risk offenders in the state. If counties are not properly prepared for such a transition, they may be overwhelmed by the duties of supervising thousands of new, and very active, offenders. Counties have been encouraged to integrate alternatives to incarceration into every stage of the process and concentrate local resources on the highest risk offenders to avoid some of the same problems that developed in the state prisons. Other states may follow California in its monumental effort to reduce prison overcrowding by realigning certain offenders to local jurisdictions, but they are strongly advised that policies based on offenses only—or “stakes”—may be riskier than anticipated.
Footnotes
Author’s Note
Data were provided by the California Department of Corrections and Rehabilitation. The opinions expressed herein represent those of the authors and do not necessarily represent the position of the California Department of Corrections and Rehabilitation.
Declaration of Conflicting Interests
The author(s) declared no potential conflicts of interest with respect to the research, authorship, and/or publication of this article.
Funding
The author(s) received no financial support for the research, authorship, and/or publication of this article.