
Abstract
This study examines the development and validation of the Minnesota Sex Offender Screening Tool–4 (MnSOST-4) on a dataset consisting of 5,745 sex offenders released from Minnesota prisons between 2003 and 2012. Bootstrap resampling was used to select predictors, and k-fold and split-sample methods were used to internally validate the MnSOST-4. Using sex offense reconviction within 4 years of release from prison as the failure criterion, the data showed that 130 (2.3%) offenders in the overall sample were recidivists. Multiple classification methods and performance metrics were used to develop the MnSOST-4 and evaluate its predictive performance on the test set. The results from the regularized logistic regression algorithm showed that the MnSOST-4 performed well in predicting sexual recidivism in the test set, achieving an area under the curve (AUC) of 0.835. Additional analyses on the test set revealed that the MnSOST-4 outperformed the Minnesota Sex Offender Screening Tool–3 (MnSOST-3), Minnesota Sex Offender Screening Tool–Revised (MnSOST-R), and Static-99 in predicting sexual reoffending.
Introduction
As the size of the “what works” literature has continued to grow in the wake of the 1970s claim that “nothing works,” the corrections field has increasingly embraced the idea of using policies and practices that have been found to reduce the likelihood of recidivism. Drawing on lessons learned from this body of research, the principles of effective correctional intervention provide a guide for the implementation of evidence-based practices (EBPs). Included among the eight principles are (a) assess risk and needs, (b) enhance intrinsic motivation, (c) target interventions, (d) use of cognitive-behavioral treatment methods, (e) increase positive reinforcement, (f) engage ongoing support in communities, (g) measure relevant processes and practices, and (h) provide measurement feedback (Crime and Justice Institute at Community Resources for Justice, 2009). The use of validated risk and needs assessments is not only central to EBPs, but the effective delivery of programming is contingent, at least to some extent, on assessments that perform well in predicting recidivism.
Research has consistently demonstrated that actuarial assessments outperform professional judgment in making accurate classification decisions (Dawes, Faust, & Meehl, 1989; Hanson & Morton-Bourgon, 2009). Still, the evidence generally suggests that risk assessment tools have been, at best, only modestly successful in distinguishing recidivists from nonrecidivists (Singh & Fazel, 2010). While there are numerous examples in which risk assessment instruments have performed well in predicting recidivism (Hamilton et al., 2016; Olver, Stockdale, & Wormith, 2014; P. Smith, Cullen, & Latessa, 2009), there are also instances in which predictive performance has been relatively poor (Boccaccini, Murrie, Caperton, & Hawes, 2009; Duwe & Rocque, 2016; Giguere & Lussier, 2016). This uneven but relatively pedestrian level of overall performance applies not only to “broad-band” assessments that predict general recidivism but also to “narrow-band” instruments that assess risk of certain types of offending such as sexual recidivism. For example, in their evaluation of sexual recidivism assessment tools, Knight and Thornton (2007) reported that these tools had, on the whole, weak predictive validity (an average area under the curve [AUC] value of 0.64), although there were a few that achieved adequate predictive discrimination.
The Minnesota Sex Offender Screening Tool (MnSOST) series of instruments has been one of the most widely used sexual recidivism assessment tools (Langton, Barbaree, Harkins, Peacock, & Arenovich, 2008). Shortly after the MnSOST made its debut in 1996, Epperson and colleagues (2003) began working on a revised version of the instrument. In 1999, they introduced the Minnesota Sex Offender Screening Tool–Revised (MnSOST-R), an instrument that has been used to assess sexual recidivism risk for sex offenders both within and outside Minnesota. More recently, Duwe and Freske (2012) significantly revised the MnSOST-R with their development of the Minnesota Sex Offender Screening Tool–3 (MnSOST-3), which the Minnesota Department of Corrections (MnDOC) began using in January 2012.
Given that the MnSOST-3 estimates the probability of sexual recidivism over a 4-year follow-up period and sex offenders scored on this instrument first began getting released from prison in 2012, it is now possible to evaluate how the tool has performed on a cohort of sex offenders released from Minnesota prisons. Perhaps more importantly, these MnSOST-3 assessment data also provide a baseline that can be used to help determine whether a better performing sexual recidivism assessment can be developed. The present study details the efforts to update the MnSOST-3 by examining the development and validation of the Minnesota Sex Offender Screening Tool–4 (MnSOST-4).
In the following section, this study describes the use of risk assessment instruments, especially the MnSOST-3, for sex offenders in Minnesota prisons. Next, just as the principles of effective correctional intervention have been drawn from the “what works” literature, this study reviews existing research so as to identify proven or promising practices in the development and validation of risk assessment instruments. As discussed in the Data and Method section, these principles are then applied to the development of the MnSOST-4. Following a presentation of the results, which include predictive performance comparisons between the MnSOST-4 and three other assessments (MnSOST-3, MnSOST-R, and Static-99), this study concludes by discussing the implications of the findings for recidivism risk assessment.
Risk Assessment for Minnesota Sex Offenders
Since their debut more than 20 years ago, the MnSOST series of instruments has been used to prioritize sex offenders for prison-based programming, especially sex offender treatment. In addition to helping determine the appropriate levels of postrelease community supervision, the MnSOST tools have been used to screen sex offenders for involuntary civil commitment. Perhaps most notably, the MnSOST assessments have been used to help assign risk levels for sex offenders leaving prison, which are then used to determine the extent to which the community will be notified. Over the last 20 years, approximately 55% of sex offenders released from Minnesota prisons have received a Level 1 assignment (lower risk), 30% a Level 2 assignment (moderate risk), and 15% a Level 3 assignment (higher risk).
Sex offenders are assessed on the MnSOST prior to receiving a risk-level assignment from an End of Confinement Review Committee (ECRC), which is composed of the prison warden or treatment facility head where the offender is confined, a law enforcement officer, a sex offender treatment professional, a caseworker experienced in supervising sex offenders, and a victim services professional. While the MnSOST score provides a presumptive risk level, ECRCs may override it as they consider the MnSOST score as well as additional factors that presumably increase or decrease the risk of reoffense (e.g., an offender’s stated intention to reoffend following release, or a debilitating illness or physical condition that mitigates the risk of reoffense).
When the MnDOC transitioned from the MnSOST-R to the MnSOST-3 in January 2012, the presumptive risk-level cut points changed due to the marked differences between the two instruments. The sample used to develop the MnSOST-3 consisted of 2,535 male sex offenders, most of whom had been released from Minnesota prisons between 2003 and 2006. In contrast to the first two versions of the MnSOST, which relied on Burgess methodology as the classification method, Duwe and Freske (2012) used multiple logistic regression to create the MnSOST-3. Relying on sex offense reconviction within 4 years as the outcome measure, they used bootstrap resampling for item selection and model validation. The MnSOST-3 had an AUC value of 0.796, which suggests that the instrument had good predictive discrimination.
The MnSOST-3 contained 11 predictors—nine main effects and two interaction effects. Of the nine main effects, only three were items derived from the MnSOST-R (public place, completion of chemical dependency and sex offender treatment, and age at release). The other items are as follows: male victims, predatory offenses, felony offenses, violations of orders for protection (VOFP)/stalking/harassment, disorderly conduct convictions (last 3 years), and unsupervised release.
The MnSOST-3, which is scored in a Microsoft Excel application, provides several measures of sexual recidivism risk. The MnSOST-3 value an offender receives represents his predicted probability of sexual recidivism within 4 years, which varies from a low of 0% to a high of 100%. To provide a range in which the true risk of sexual recidivism likely falls, 95% confidence intervals (CIs) were calculated around MnSOST-3 estimates. While the MnSOST-3 value and the accompanying 95% CIs offer measures of absolute sexual recidivism risk, percentile ranking was also included to provide a measure of relative risk (Duwe & Freske, 2012).
Shortly after implementing the MnSOST-3 in January 2012, the MnDOC began using the MnSOST-3.1 the following month. The MnSOST-3.1 differs from the MnSOST-3, in that it excludes the two interaction effects. Although the AUC for the MnSOST-3.1 is the same (0.796) as it is for the MnSOST-3, use of the 3.1 resulted in a slight change to the cut points for presumptive risk levels. Under the MnSOST-3, the cut scores were 5.50% and higher for Presumptive Level 3, between 2.30% and 5.49% for Presumptive Level 2, and below 2.30% for Presumptive Level 1. Under the 3.1, the cut scores were 5.80% and higher for Presumptive Level 3, and between 2.30% and 5.79% for Presumptive Level 2 (Duwe & Freske, 2016).
More recently, in 2013 the MnDOC began using the MnSOST-3.1.2. The main difference between the MnSOST-3.1.2 and its predecessor, the MnSOST-3.1, is that the probability distribution used to determine an offender’s percentile rank (i.e., his risk relative to other Minnesota sex offenders) is based on 1,517 cases scored on the MnSOST-3.1 by the MnDOC during 2012. Previously, the probability distribution used to determine percentile rank for both the MnSOST-3 and MnSOST-3.1 had been based on the 2,535 cases in the development sample.
The Minnesota Screening Tool Assessing Recidivism Risk (MnSTARR)
The MnDOC’s transition to the MnSOST-3.1.2 in 2013 coincided with the debut of MnSTARR, a “multiple-band” instrument that assesses risk separately for male and female prisoners for five different types of recidivism—nonviolent, felony, nonsexual violent, first-time sexual offending, and repeat sexual offending—over a 4-year follow-up period (Duwe, 2014a). Because a sex offender’s likelihood of sexual recidivism is derived directly from his MnSOST-3.1.2 score, the MnSOST-3.1.2 is fully integrated within the broader MnSTARR assessment. Given that the MnSTARR is strictly a risk assessment tool, its noncriminal history items, which are mostly dynamic factors, do not identify which needs areas should be targeted for programming. Yet, because the noncriminal history/dynamic items measure observable behavior in prison such as misconduct or completion of programming, the MnSTARR indicates which needs areas have improved or grown worse while an offender is incarcerated.
In November 2016, the MnDOC transitioned from the MnSTARR—an assessment manually scored by correctional staff—to the MnSTARR 2.0—a fully automated assessment (Duwe & Rocque, 2017). The MnSTARR 2.0 extracts data from the state’s criminal history repository to populate the criminal history items on the instrument, while data from the Correctional Operations Management System (COMS)—the MnDOC’s centralized database—are pulled to populate items pertaining to demographic characteristics (e.g., gender, age, and marital status), institutional behavior (e.g., discipline convictions and gang affiliation), and participation in programming (e.g., earning a postsecondary degree in prison, completing chemical dependency treatment, and completing cognitive-behavioral therapy). The only MnSTARR 2.0 items that are not autopopulated are those for the MnSOST-3.1.2, which continue to be scored manually by correctional staff. Still, after a MnSOST-3.1.2 assessment has been completed on an offender, the MnSOST-3.1.2 score is extracted from COMS and uploaded within the MnSTARR 2.0 assessment.
In addition to using an automated scoring process, there are several other notable differences between the original MnSTARR and the MnSTARR 2.0: First, the dataset was expanded from 2003 to 2006 releases to include all offenders released between 2003 and 2010. The training set for the MnSTARR 2.0 included offenders released during the 2003-2008 period, whereas the test set comprised of releases from 2009 to 2010. Second, due to the automated scoring process, the MnSTARR 2.0 includes nearly 50 items (for both male and female offenders), which is more than double the number of items that were on the MnSTARR. Finally, whereas logistic regression with interaction terms was used to develop the original MnSTARR, regularized logistic regression (RLR) was the classification method used to create the MnSTARR 2.0.
Promising and Proven Practices in Risk Assessment
The promising and proven practices in the development of risk assessment instruments cover the following seven areas: (a) scoring method, (b) classification method, (c) item selection and measurement, (d) internal validation method, (e) evaluating predictive performance, (f) bias testing, and (g) feedback loop. The practices within each of these areas are not mutually exclusive but are, to a large extent, interdependent. For example, the choice of which scoring method to use can affect the classification method, which can, in turn, affect how items are selected. Table 1 displays prior practices used in the development of the MnSOST and MnSTARR assessments. 1
MnSOST and MnSTARR Risk Assessment Practices and Design Features.
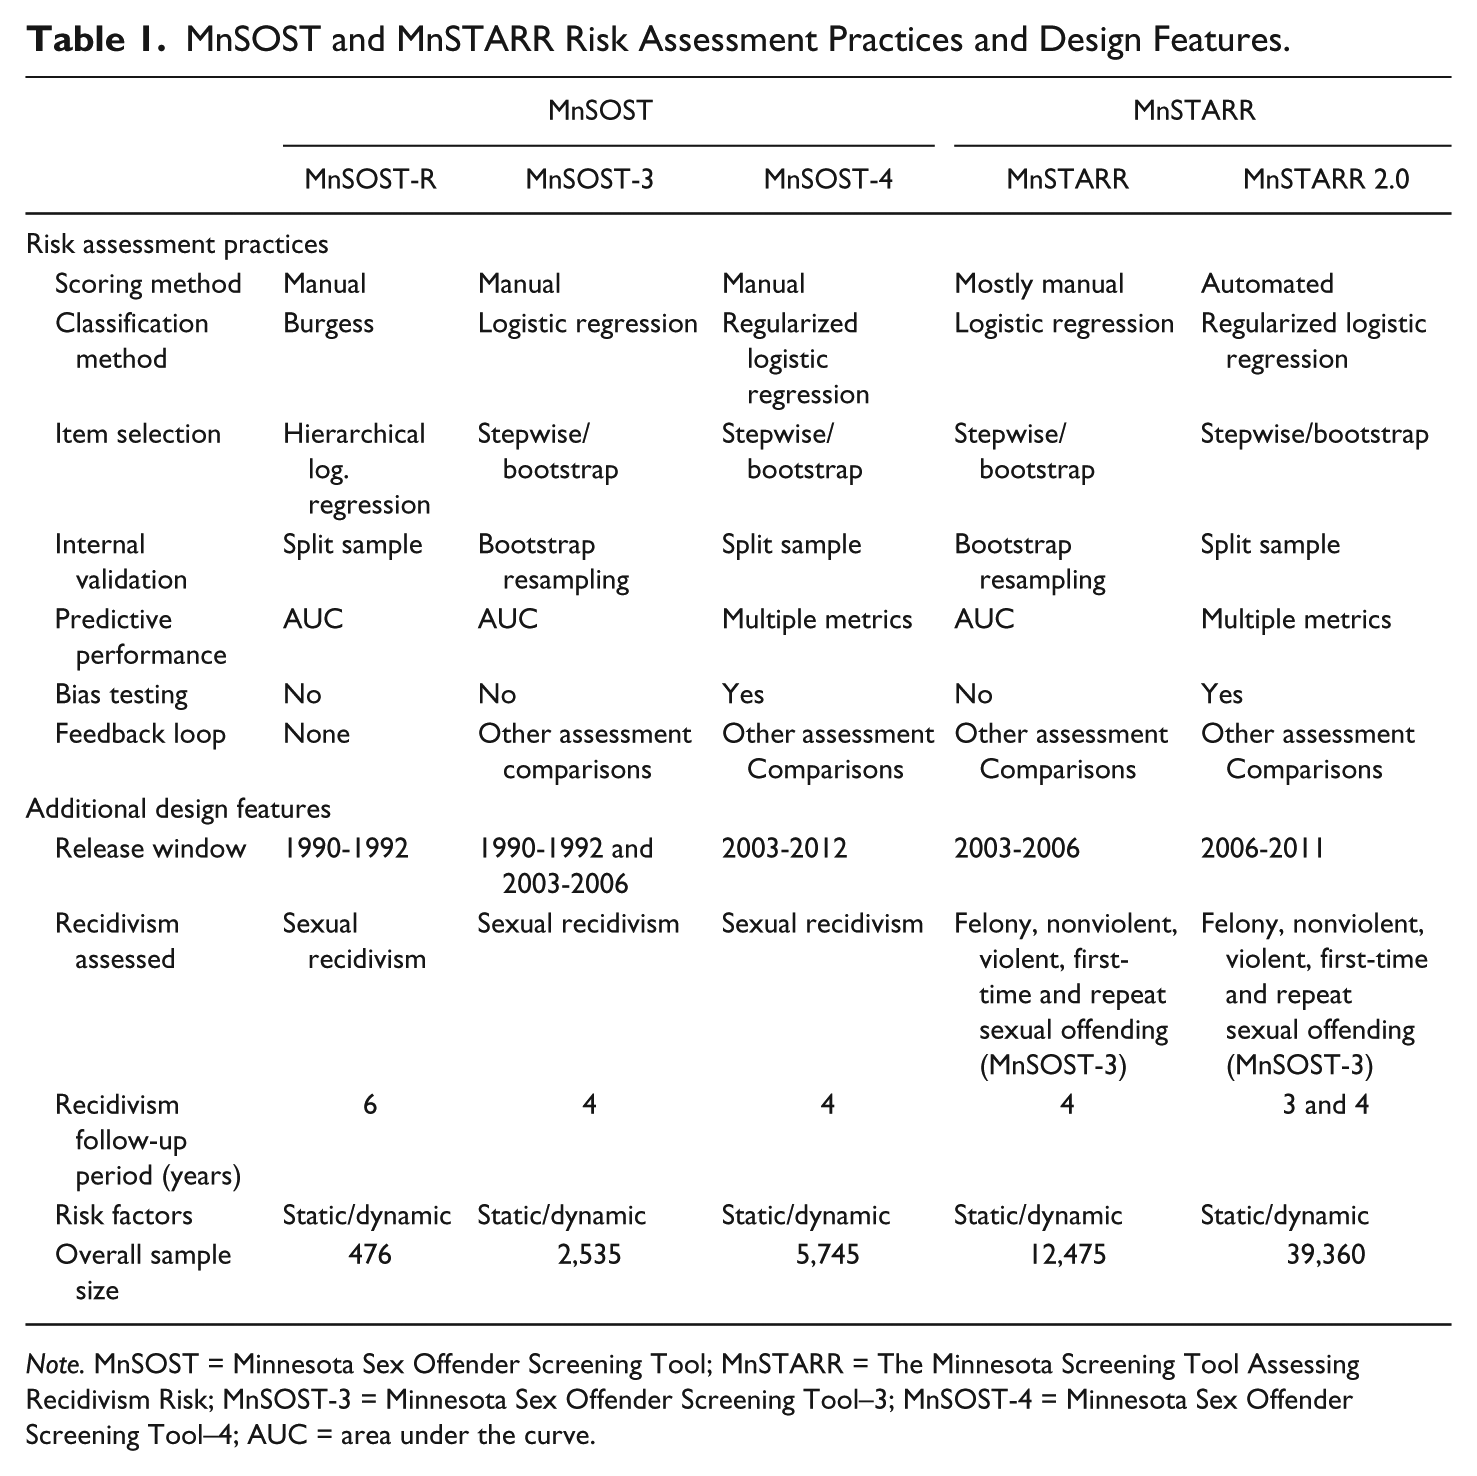
Note. MnSOST = Minnesota Sex Offender Screening Tool; MnSTARR = The Minnesota Screening Tool Assessing Recidivism Risk; MnSOST-3 = Minnesota Sex Offender Screening Tool–3; MnSOST-4 = Minnesota Sex Offender Screening Tool–4; AUC = area under the curve.
Scoring method
The scoring method refers to the process by which the items on a risk assessment instrument are populated, with the total score being used to determine an individual’s risk level (e.g., low, moderate, high). Items on an instrument can be scored manually, usually by correctional staff, or they can be populated through an automated process. Despite the extensive training and quality assurance that often accompanies the use of manually scored tools, differences among staff in how they score manual assessments are inevitable due to factors such as the subjectivity of the items, the extent to which staff have been trained, staff workloads, the amount of time it takes to complete an assessment, and data entry errors.
Interrater reliability (IRR) examines the consistency between raters in scoring an instrument, and the differences among staff, or raters, in how they score manual assessments comprise what is known as interrater disagreement. Although it has been assumed that assessments must have reliability to have predictive validity (Austin, 2006), relatively few risk assessment studies have measured IRR, and only one has examined the impact that interrater disagreement has on predictive performance. In their study comparing manual and automated scoring methods, Duwe and Rocque (2017) found that interrater disagreement can affect the performance of an instrument in predicting recidivism. As interrater disagreement increased in the manually scored assessments, predictive performance decreased. Conversely, the automated scoring process achieved better predictive validity because it removed interrater disagreement. By eliminating the time it takes for correctional staff to score manual assessments, an automated scoring method is also more efficient and cost-effective. Duwe and Rocque estimated, for example, that for every dollar spent on automating the MnSTARR 2.0, there will be an estimated return of nearly US$22 within 5 years, totaling US$2.8 million.
The vast majority of recidivism risk assessment instruments, including those designed to predict sexual recidivism, are scored by hand. Although automated scoring is a promising practice, it is still a relatively new idea within corrections. Whether automated scoring can, or should, be used more widely remains to be seen. For example, there may be circumstances in which manual scoring is preferable or an automated process is simply not feasible.
But if an instrument must be scored manually, then it is necessary to demonstrate that it can be scored consistently. To achieve adequate reliability, Duwe and Rocque (2017) argued that using objective items (as opposed to more subjective items that require more interpretation) is critical. For example, in assessing a domain such as antisocial peers, it may be better to measure whether an individual has received any visits in prison than asking whether she or he is a “social isolate” in a one-on-one interview. Moreover, to demonstrate reliability, manually scored instruments should include an IRR assessment.
Classification method
The classification method refers to the process by which the values for items on an instrument are calculated into a risk score The main types of classification methods that have been used to develop recidivism risk assessment tools are Burgess (i.e., a simple summation of item values), statistical techniques (e.g., logistic regression), and machine learning algorithms (e.g., Random Forests [RF], artificial neural networks, support vector machines, etc.). Except for the MnSOST-3 (Duwe & Freske, 2012) and the Vermont Assessment of Sex Offender Risk–2 (VASOR-2; McGrath, Lasher, Cumming, Langton, & Hoke, 2014), which both used multiple logistic regression, sexual recidivism assessment instruments have relied on Burgess methodology.
A number of recent studies have examined the impact of the classification method on performance in predicting recidivism. Much of this research has focused on comparing statistical methods such as logistic regression with machine learning algorithms. The results from these studies have been mixed. Some have found that machine learning algorithms outperformed statistical methods (Berk & Bleich, 2013; Breitenbach, Dieterich, Brennan, & Fan, 2009; Duwe & Kim, 2015; Hess & Turner, 2013), whereas others have found little or no difference (Hamilton, Neuilly, Lee, & Barnoski, 2015; Liu, Yang, Ramsey, Li, & Cold, 2011; Tollenaar & van der Heijden, 2013). In the only study that has directly compared predictive performance between Burgess methods and statistical and machine learning algorithms, Duwe and Kim (2016) found that statistical and machine learning methods significantly outperformed scales developed with Burgess methodology.
In addition to predictive performance, classification methods differ in how transparent and interpretable they are. At one end of the spectrum, Burgess methodology is very transparent and interpretable. At the other end, machine learning algorithms are much more opaque, having been described as black boxes or, at best, gray boxes. Linear regression occupies the middle ground between both ends. But the extent to which linear regression is transparent and interpretable depends on how complicated, or dimensional, the model is. Models with interaction effects and nonlinear terms will operate more like machine learning algorithms and will, thus, be less decipherable.
There are a few broad conclusions that can be drawn from research on the classification method: First, the evidence suggests that there is a trade-off between transparency and performance. Although Burgess methodology offers greater simplicity and transparency than statistical and machine learning algorithms, there is a price to pay in the form of reduced predictive performance (Duwe & Kim, 2016). Second, consistent with the “no free lunch” theorem (Caruana & Niculescu-Mizil, 2006; Wolpert, 1996), there is no single best method or algorithm that yields the best performance in every situation. To be sure, the evidence suggests that machine learning algorithms such as RF or boosted trees will, on the whole, achieve the best performance (Caruana & Niculescu-Mizil, 2006). Still, there are instances in which relatively poor classifiers outperform higher performing algorithms (Caruana & Niculescu-Mizil, 2006; Duwe & Kim, 2015).
As a result, recent research has advocated evaluating multiple classification methods in the development of risk assessment instruments (Duwe & Kim, 2016; Ridgeway, 2013). Testing multiple classification methods improves the chances of finding the best predictive model. Moreover, it makes it possible to determine whether the loss of predictive performance sufficiently offsets increased transparency and vice versa (Duwe & Kim, 2016).
Item measurement and selection
Due largely to the popularity of Burgess methodology in developing recidivism risk assessment tools, items have generally been nominal- and ordinal-level measures that have been treated as main effects. One exception to this approach, at least among instruments designed to predict sexual recidivism, is the MnSOST-3, which contains continuous measures (e.g., age at release) as well as interaction effects (Duwe & Freske, 2012). Interaction effects can be challenging to interpret in practice, however, which is why Duwe and Freske (2016) revised the MnSOST-3 by removing the two interaction effects. Rather than modeling interaction effects within a statistical model, this study explores a more simplistic approach by creating combined measures of multiple predictors. For example, instead of entering multiple prior sex offenses (one prior sex offense = 0; multiple prior sex offenses = 1) and multiple victims age groups (one age group = 0; multiple age groups = 1) as an interaction effect in the model, this study combines these two measures into a single item (multiple prior sex offenses and multiple age groups = 1; any other combination = 0).
Item selection is guided, to a large extent, by theory. Items should be considered for inclusion on an assessment if they are theoretically relevant and if the direction of their impact on the outcome being predicted (e.g., recidivism) is consistent with existing theory. Moreover, prior research suggests that rather than including a large number of items related to both risk and needs, assessments designed to predict recidivism should include only items that enhance predictive performance (Baird, 2009; Barnoski & Aos, 2003; Duwe, 2014a).
Among theoretically relevant predictors, however, the literature has not delivered unequivocal evidence on the best method to use for item selection. Item selection methods include procedures such as the gain ratio, information gain, chi-square, principal components analysis, and stepwise selection. Stepwise routines have been criticized on a number of grounds, especially for producing biased regression coefficients (Tibshirani, 1996) and for capitalizing on chance features of the data (Judd, McClelland, & Ryan, 2008). In an effort to mitigate these concerns, several studies have used bootstrap variable selection procedures in the development of recidivism risk assessment instruments (Duwe & Freske, 2012; Hamilton et al., 2016).
Internal validation method
Internal validity examines the extent to which the tool’s performance can be reproduced on the population underlying the sample. Several internal validation methods have been developed to determine the reproducibility of a prediction model. The split-sample method involves using a portion (e.g., one half or two thirds) of the sample to develop the prediction tool (i.e., the development sample or training set), which is then applied to the remaining portion of the sample to test the internal validity of the model (i.e., the validation sample or test set). As Harrell, Lee, and Mark (1996) pointed out, this approach wastes data. Yet, by having a test set, the split-sample method provides a means for making a direct comparison between the prediction instrument being validated and other existing assessments that have been administered to individuals in the test set.
Although cross-validation, or k-fold validation, is more efficient than the split-sample method because it involves repeated data splitting, research has shown that bootstrap resampling is the most efficient internal validation technique (Steyerberg, Bleeker, Moll, Grobbee, & Moons, 2003; Steyerberg et al., 2001). Bootstrap resampling involves pulling many smaller samples from the overall sample to generate estimates of error (Efron, 1979). In doing so, it makes full use of the dataset while also providing error estimates that have relatively low variability and minimal bias (Steyerberg et al., 2001). With the exception of the MnSOST-3 (Duwe & Freske, 2012), which used bootstrap resampling, and the VASOR-2 (McGrath et al., 2014), which used k-fold validation, sexual recidivism assessments have preferred the split-sample method.
Evaluating predictive performance
The sex offender risk assessment literature has relied almost exclusively on the AUC as the metric by which to evaluate predictive performance. While the AUC has its strengths and weaknesses, which are noted below, it measures only one dimension of predictive validity: discrimination. Predictive validity, however, also consists of accuracy and calibration.
Predictive accuracy assesses how well a model makes correct classification decisions. One of the most commonly used metrics is accuracy (ACC), a threshold-based measure that looks at the extent to which an assessment correctly classifies offenders as recidivists or nonrecidivists. For example, if a recidivist had a predicted recidivism probability less than 50%, then this offender would be incorrectly classified as a nonrecidivist (i.e., false negative). If this offender had not recidivated, then she or he would be accurately classified (i.e., true negative). The main limitation with using threshold-based predictive accuracy metrics is that they can be less informative and meaningful for highly imbalanced datasets in which few, if any, of the individuals have predicted probabilities of 50% or higher.
The second dimension of predictive validity, discrimination, measures the degree to which an assessment separates the recidivists from the nonrecidivists. The AUC is relatively robust across different recidivism base rates and selection ratios (W. Smith, 1996). With values that range from 0 to 1, the AUC statistic is interpreted as the probability that a randomly selected recidivist has a higher score on a risk assessment instrument than a randomly selected nonrecidivist. Values at either end of the spectrum (0 or 1) reflect perfect prediction, whereas a value of 0.50 indicates that the prediction tool does no better than chance. According to the literature, an AUC between 0.90 and 1.00 is considered excellent, between 0.80 and 0.89 is good, between 0.70 and 0.79 is fair, between 0.60 and 0.69 is poor, and between 0.50 and 0.59 represents a failure to achieve predictive discrimination (Baird et al., 2013; Thornton & Laws, 2009).
As Davis and Goadrich (2006) pointed out, the AUC can provide an overly optimistic estimate of predictive discrimination for imbalanced datasets. In addition, as Hand (2009) demonstrated, the AUC uses different misclassification cost distributions for dissimilar classifiers and can provide misleading results if receiver operating characteristic (ROC) curves cross. Given that the AUC evaluates different classifiers using different metrics, Hand (2009) developed a predictive discrimination metric, the H-measure, that uses a common cost distribution for all classifiers, with higher values indicating better performance (Hand, 2009). The H-measure has seldom been used in existing research on recidivism prediction, although previous studies have reported H values that ranged from 0.07 to 0.40 (Duwe & Rocque, 2017; Hamilton et al., 2015). Another alternative to the AUC is the precision-recall curve (PRC), which uses the precision and recall values to assess predictive discrimination. The PRC has been found to be a better metric than the AUC for highly imbalanced datasets (Davis & Goadrich, 2006), although it has yet to be used much, if at all, in prior validation research. Like the H-measure, PRC values range from 0 to 1, with higher values denoting better performance.
Calibration measures how well the predicted probabilities from a model correspond with the observed outcome being predicted. Whereas predictive discrimination assesses relative risk, calibration taps into absolute risk. For a prediction instrument to make accurate absolute assessments of risk, the model’s predicted probabilities must be calibrated with the observed recidivism outcomes. Two of the more commonly used calibration metrics are the Brier score and root mean square error (RMSE). For both metrics, the closer the value to 0, the better the calibration.
Amid the growing recognition that comprehensive evaluations of predictive performance involve more than calculating the AUC, recent studies have begun reporting multiple metrics that address each of these dimensions of predictive validity (Duwe & Kim, 2016; Hamilton et al., 2016; Tollenaar & van der Heijden, 2013). In particular, these studies included the squared error, accuracy, and ROC area (SAR), a statistic developed by Caruana, Niculescu-Mizil, Crew, and Ksikes (2004) that combines discrimination, accuracy, and calibration. The formula for SAR is [ACC + AUC + (1 − RMSE)] / 3. The SAR value in these studies ranged from 0.63 to 0.83, with higher values indicating better predictive performance (Duwe & Kim, 2016; Hamilton et al., 2016; Tollenaar & van der Heijden, 2013).
Testing for bias
As the use of risk and needs assessments has become increasingly embedded within correctional policy and practice, there have been recent concerns over the disparate and adverse effects that use of these tools may have on racial and ethnic minorities (Skeem & Lowenkamp, 2016). Whether and to what extent the effects may be adverse, however, depends on the various ways in which correctional authorities use risk assessments. In “low stakes” risk assessment, instruments are used to help determine institutional custody levels, prioritization for programming, and the type of community supervision. In “high stakes” risk assessment, where an individual’s liberty hangs in the balance, tools are used to inform decisions related to pretrial release, sentencing, whether individuals should be paroled from prison, and, more narrowly, whether persons convicted of a sex offense should be civilly committed after serving their sentence. While risk assessments should be routinely tested for racial and ethnic bias, as Skeem and Lowenkamp (2016) recommended, bias testing should be imperative for instruments used in high-stakes decisions.
Feedback loop: Updating a risk assessment instrument
The literature offers little, if any, explicit guidance when it comes to revising a risk assessment instrument. The only criterion, albeit an implicit one, seems to be that the challenger—the new, updated assessment—should be able to outperform the incumbent—the older, existing version of the tool. For example, studies examining revisions to the Static-99 (Helmus, Thornton, Hanson, & Babchishin, 2012), MnSOST (Duwe & Freske, 2012), and VASOR (McGrath et al., 2014) each touted the fact that the challenger outperformed the incumbent. Meanwhile, even less has been said about the frequency with which instruments should be updated, although the period of time between revisions can be lengthy. Indeed, more than a decade passed between revisions for the Static-99 (Helmus, Hanson, Thornton, Babchishin, & Harris, 2012), MnSOST (Duwe & Freske, 2012), and VASOR (McGrath et al., 2014).
Consistent with the final two principles (measuring relevant processes and providing measurement feedback) from the principles of effective correctional interventions, this study explores whether the use of a measurement feedback loop can help improve predictive performance. Complete predictive performance data for the MnSOST-3 first became available at the end of 2016 since the assessment was first implemented in 2012, and it uses a 4-year follow-up period for recidivism. These data are used to help determine whether the MnSOST-3 can be updated with a better performing assessment. This study not only compares the performance of the challenger (the MnSOST-4) with the incumbent (the MnSOST-3), but it also compares predictive performance for two other widely used sexual recidivism assessments: the MnSOST-R and the Static-99.
Data and Method
The overall sample used to develop and validate the MnSOST-4 consists of 5,745 sex offenders released from Minnesota prisons between 2003 and 2012. The predicted outcome is sexual recidivism, which was operationalized as a reconviction for a new sex offense within 4 years of release from prison. Similar to the MnSOST-3 (Duwe & Freske, 2012), sex crimes were measured as hands-on sex offenses. Accordingly, noncontact, sex-related offenses such as possession of child pornography or indecent exposure were excluded.
Reconviction was the recidivism measure because it reduced the likelihood of including instances of “pseudo recidivism” in which the offender was rearrested and/or reconvicted for a sex offense that was committed prior to his release from prison. Information on the date(s) when the reoffense occurred was seldom available in the arrest data but was consistently present in the conviction data. Reconviction data were obtained from the Minnesota Bureau of Criminal Apprehension (BCA), which include only convictions that occur in Minnesota. Like any study that measures recidivism, official criminal history data will underreport the actual extent to which the sex offenders examined here recidivated.
Internal Validation Methods
As discussed below, k-fold validation was used to optimize the parameters for the classification methods evaluated, while the split-sample method was used for internal validation. The training set was made up of 3,973 sex offenders released from Minnesota prisons between 2003 and 2009, whereas the test set contained 1,772 sex offenders released from prison between 2010 and 2012. Of the 3,973 offenders in the training set, 97 (2.4%) were recidivists. Of the 1,772 offenders in the test set, 33 (1.9%) were recidivists. For the overall sample, the base rate was 2.3%.
As shown later, the performance of the MnSOST-4 will be compared with the MnSOST-R, Static-99, and MnSOST-3. The advantage with the split-sample approach is that the performance of the MnSOST-4 can be directly compared with the other assessments on the same group of cases. For example, each of the 1,772 offenders in the test set had been administered a MnSOST-R prior to their release from prison. As a result, the MnSOST-4 and MnSOST-R will be compared on the full test set. Given that 168 offenders in the test set had not been assessed on the Static-99, the comparison between the MnSOST-4 and Static-99 focuses on the 1,604 offenders in the test set who had been scored on the Static-99. Finally, because the MnSOST-3 was not implemented until 2012, the MnSOST-3 and MnSOST-4 will be compared only for the 541 offenders in the test set who were released in 2012.
Selecting Predictors
The overall dataset for this sample contained more than 60 theoretically relevant predictors, including detailed criminal history measures, each item from the MnSOST-R and MnSOST-3, demographic characteristics, behavior in prison, and participation in prison programming. Some of these items, particularly those relating to prior sexual offending, must be scored manually through a detailed file review. Because the MnSOST-4 must be scored manually by correctional staff, the length of time it takes to administer and the number of items that must be scored are important considerations. In an effort to pare down the number of items so that only the significant and robust predictors of sexual recidivism were included, a bootstrap variable selection method developed by Efron and Gong (1983) was applied to the dataset.
Multiple logistic regression models were estimated in which predictors were added one at a time until no further single addition achieved significance level a = .10. Among the 18 predictors that had a significant effect (p < .10) on sexual recidivism, bootstrap resampling was used to refine the selection of predictors included in the MnSOST-4. Consistent with the MnSOST-3 (Duwe & Freske, 2012), predictors were retained as long as they were statistically significant at the .05 level in at least 70% of the 1,000 bootstrap samples. After removing five predictors that did not achieve statistical significance in at least 70% of the samples, another 1,000 bootstrap samples were estimated. As shown in Table 2, there were 13 predictors that were statistically significant at the .05 level in at least 70% of the bootstrap samples. 2
Descriptive Statistics for MnSOST-4 Items.
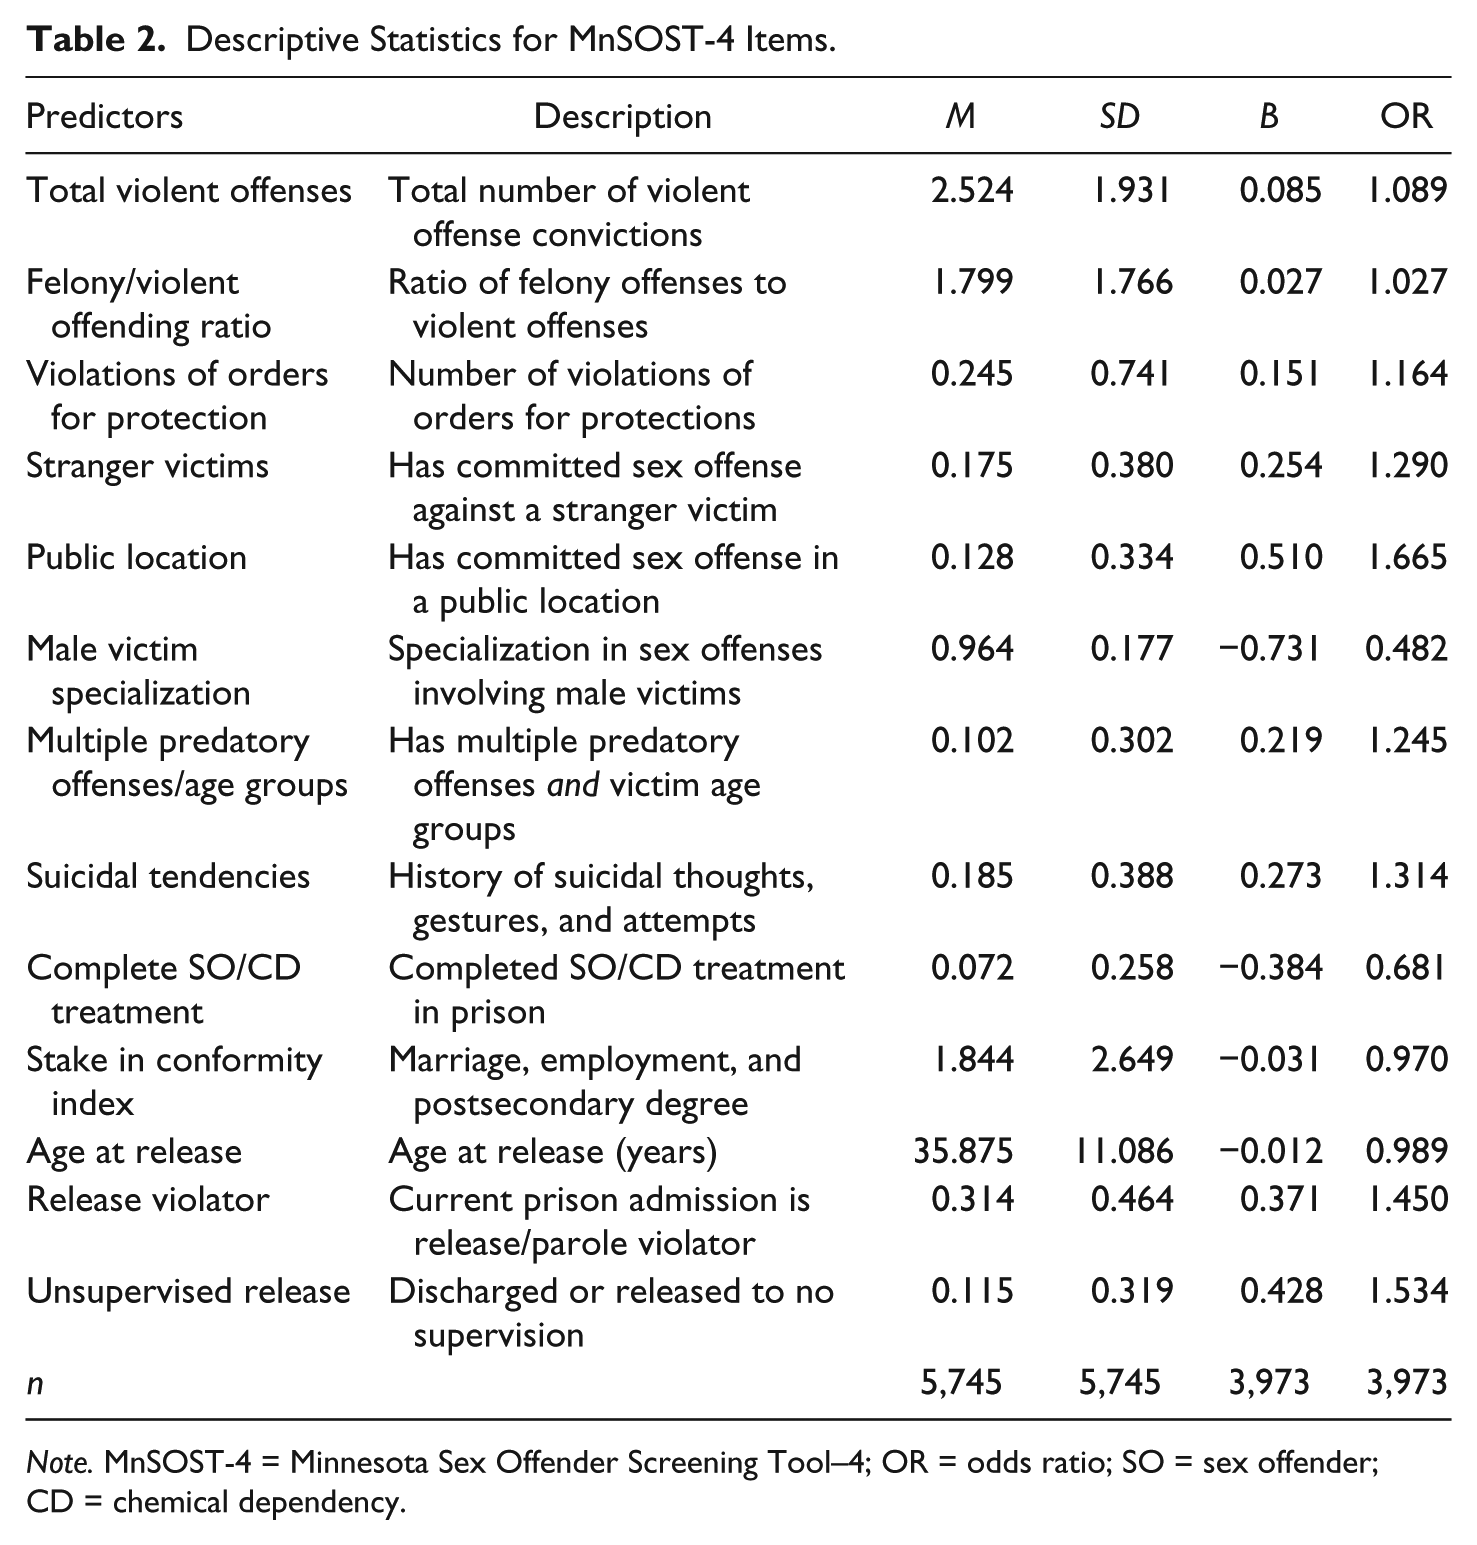
Note. MnSOST-4 = Minnesota Sex Offender Screening Tool–4; OR = odds ratio; SO = sex offender; CD = chemical dependency.
Description of MnSOST-4 Items
Among the 13 items on the MnSOST-4, seven are criminal history measures that each increase sexual recidivism risk. Of these, four pertain specifically to prior sexual offending. As with the MnSOST-R and MnSOST-3, having committed a sex offense in a public location was a significant predictor of sexual recidivism. The number of predatory offenses with male victims was an item on the MnSOST-3, and a similar item can be found on the Static-99 (Hanson & Thornton, 1999) and VASOR-2 (McGrath et al., 2014). For the MnSOST-4, a better predictor was the extent to which sex offenders specialized in committing predatory offenses involving male victims. The formula used to measure male victimization specialization was 1 − [(Number of predatory offenses with male victims / Total number of predatory offenses) × (Number of predatory offenses with male victims / Total number of predatory offenses)]. A value of “0” for this item indicates that the offender has complete specialization in sexual offending against males, whereas a value of “1” indicates complete specialization in sexual offending against females. As the coefficient indicates in Table 1, sexual recidivism risk increases as specialization in male victimization increases (i.e., value moves from 1-0).
Sex offenses committed against a stranger were included on the MnSOST-R but not on the MnSOST-3. Consistent with the MnSOST-R and Static-99, the results show that a prior sex offense committed against a stranger increases the risk of sexual reoffending. Predatory offenses and victims’ age groups, which were items on the MnSOST-3 and MnSOST-R, respectively, were not significant predictors of sexual recidivism. When these two items were combined into a single item, however, it became a significant predictor. More specifically, sexual recidivism risk was significantly greater when sex offenders had multiple prior sex offenses and had victims from more than one age group (per the MnSOST-R).
Although predatory offenses were a significant predictor for the MnSOST-3, it was not for the MnSOST-4. Instead, the total number of violent offense convictions, which is a broader measure that includes both sexual and nonsexual violent offenses, significantly predicted sexual recidivism. Likewise, felony offense conviction was an item on the MnSOST-3, but it was not a significant predictor for the MnSOST-4. However, when the number of felony offense convictions was considered in relation to the number of violent offense convictions, the ratio of felony to violent offense convictions (i.e., felony offense convictions/violent offense convictions) was a significant predictor. That is, as the value for the felony/violent offending ratio increased, so did sexual recidivism risk. The item that measures the number of convictions for VOFP, stalking, and harassment significantly predicted sexual recidivism. This item, which was also included on the MnSOST-3, likely taps into intimacy deficits, which has been found to be predictive of future sexual offending (Hanson & Morton-Bourgon, 2005). Although recent disorderly conduct conviction was an item on the MnSOST-3, it did not significantly predict sexual recidivism in the MnSOST-4 sample.
The MnSOST-4 contains three “dynamic” items—suicidal tendencies, successful participation in sex offender and chemical dependency (SO/CD) treatment, and the stake in conformity index—whose values can change while an offender is in prison. Instruments assessing the risk of first-time sexual offending (Duwe, 2012), repeat sexual offending (Boer, Hart, Kropp, & Webster, 1997), and general recidivism (Duwe, 2014a) have identified suicidal thoughts or tendencies as a risk factor. Consistent with this research, the results showed that a history of suicidal tendencies significantly raised the likelihood of a sex reoffense.
Participation in prison-based SO and CD treatment was measured as two separate items on the MnSOST-R. These items were combined to form a single item on the MnSOST-3 in which offenders received a value of “1” only if they completed SO treatment and CD treatment during their current prison term. As with the MnSOST-3, completion of SO and CD treatment significantly reduced the risk.
The stake in conformity index is based on three dichotomous measures: marital status (married = 1; unmarried = 0), employment (employment in previous year = 1; unemployed in previous year = 0), and educational achievement (postsecondary degree or certificate = 1; less than postsecondary degree/certificate = 0). The employment measure is the same item that appears on the MnSOST-R. Individually, none of the three measures were significant, robust predictors of sexual recidivism. Combined, however, this index emerged as a significant predictor. The score for the stake in conformity index ranges from 0 to 10. Reflecting their association with sexual recidivism, marital status is given 5 points, employment is assigned 4 points, and educational achievement is given 1 point. 3 Thus, an offender with at least a postsecondary degree who is married would receive 6 points on the stake in conformity index. The higher the stake in conformity index score, the lower the sexual recidivism risk.
As with the MnSOST-3 and other instruments such as the MnSOST-R and Static-99, age at release was a significant predictor. In general, the younger the offender at the time of release, the greater the sexual recidivism risk. Unsupervised release is an item on the MnSOST-3, and it remained a significant predictor for the MnSOST-4 sample. The risk was also significantly greater for offenders who entered prison as parole violators; that is, for offenders released for correctional supervision, those who returned to prison for violating their conditions of parole (either for a new offense or for technical violation) had a higher sexual recidivism risk.
Classification Methods
The six different classification methods that were trained and tested on the dataset containing the outcome measure (sex offense reconviction within 4 years) and the 13 predictors were RLR, artificial neural networks, support vector machines, bagged trees, RF, and LogitBoost. The main advantages with RLR, which is the classification method used for the MnSTARR 2.0, are that it reduces the chances of overfitting by shrinking overly large coefficients, and the interpretation is much the same as it is for an unpenalized logistic regression model. Because penalization estimation procedures such as RLR introduce bias by reducing the variance of coefficients, its main drawback is that estimating CIs around the predicted probabilities is problematic (Goeman, Meijer, & Chatuverdi, 2016). Still, by evaluating predictive performance for RLR and the other five algorithms, this study compares a relatively transparent and interpretable method—RLR—with several newer, promising machine learning algorithms that are generally more opaque. 4
Models were optimized on the training set by varying parameter values, and then using a 10-fold cross-validation procedure to determine how each model would likely perform on the test set. 5 After identifying the parameters that yielded the best performance on the training set, the optimized models for each algorithm were then applied to the 1,772 sex offenders in the test set. To estimate the potential trade-off between transparency and predictive performance, the results for the most transparent algorithm (RLR) are presented below alongside those for the algorithm with the best overall performance (RF).
Predictive Performance Metrics
Six different metrics were used to evaluate predictive performance, including one for accuracy (ACC), one for calibration (RMSE), and three for discrimination (AUC, H-measure, and PRC). In addition to these metrics, this study introduces a consolidated statistic, SHARP (squared error, H-measure, ACC, ROC, and PRC), that is designed specifically for assessing overall predictive performance within highly imbalanced datasets. The SHARP metric is similar to the SAR statistic developed by Caruana et al. (2004), except that it weights predictive discrimination more heavily by including the H and PRC statistics. The formula for SHARP is as follows: [H-measure + AUC + PRC + ACC + (1 − RMSE)] / 5. As with SAR, the SHARP value ranges from 0 to 1, with higher values signifying better predictive performance.
Bias Testing
The MnSOST assessments have been used in both “low stakes” and “high stakes” risk assessments, which underscore the need to test for bias. In Minnesota, the vast majority of prisoners fall into one of the following five racial and ethnic categories: White, African American, American Indian, Hispanic, and Asian. Because the number of offenders in some of these categories was relatively small, the 1,772 offenders in the test set were separated into two groups—White and non-White. Hispanic offenders were included in the non-White group. To test for racial/ethnic bias, the MnSOST-4’s predictive performance was evaluated separately for these two groups.
IRR Assessment
An IRR assessment was performed by MnDOC staff in the Risk Assessment/Community Notification (RACN) unit, which is responsible for scoring MnSOST assessments. Of the 541 sex offenders in the test set who were released from prison in 2012, 10 were randomly selected for scoring by eight raters from the RACN unit. Each of the eight raters in this study had prior training and experience in scoring sex offender risk assessment instruments.
The intraclass correlation coefficient (ICC) was used to estimate IRR. Because the eight raters represent the population of raters for the MnDOC, a two-way mixed-effects model is used (Shrout & Fleiss, 1979). In their recent study, Duwe and Rocque (2017) proposed the following ICC thresholds for assessing IRR within the context of manually scored recidivism risk assessment tools: 0.95 and above is excellent; 0.85 to 0.94 is good; 0.75 to 0.84 is adequate; and below 0.75 is poor.
Results
As shown in Table 3, the ACC value for the MnSOST-4 developed with RLR was 0.981. The high ACC value is somewhat misleading, however, as none of the 1,772 offenders in the test set had a predicted probability that exceeded 50%. As a result, all of the offenders were classified as “negatives.” The 1.9% error rate reflects the base rate for the test set. The AUC was 0.835, which indicates that the MnSOST-4 had good predictive discrimination on the test set. The other discrimination metrics indicate that the instrument had a H value of 0.180 and a PRC of 0.224. The RMSE value was 0.131, whereas the SHARP value was 0.618.
Predictive Performance Results.
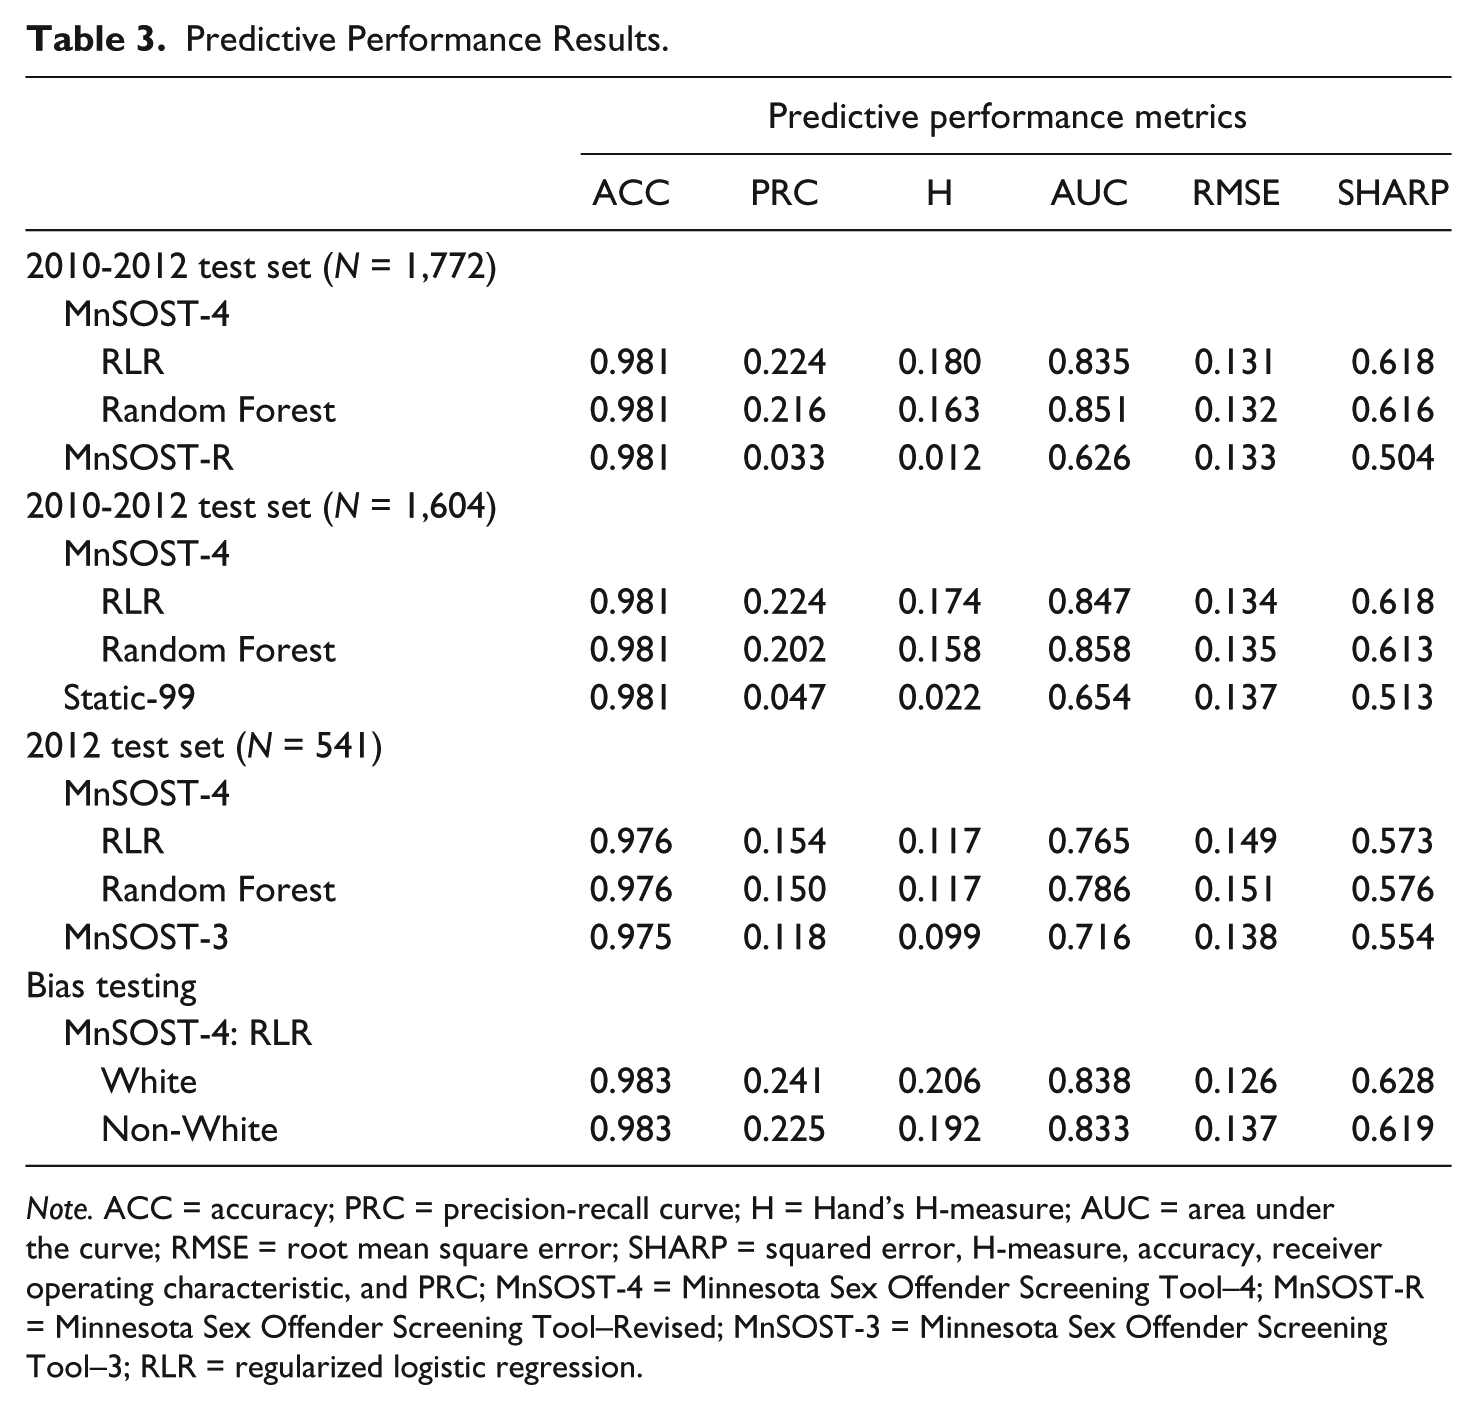
Note. ACC = accuracy; PRC = precision-recall curve; H = Hand’s H-measure; AUC = area under the curve; RMSE = root mean square error; SHARP = squared error, H-measure, accuracy, receiver operating characteristic, and PRC; MnSOST-4 = Minnesota Sex Offender Screening Tool–4; MnSOST-R = Minnesota Sex Offender Screening Tool–Revised; MnSOST-3 = Minnesota Sex Offender Screening Tool–3; RLR = regularized logistic regression.
When we compare the MnSOST-4 with the MnSOST-R, we see that the two instruments had the same ACC value, while the MnSOST-4 had slightly better calibration. We see large differences, however, for the three predictive discrimination metrics. The AUC for the MnSOST-4 was 0.209 higher, which was a statistically significant difference at the .05 level using DeLong, DeLong, and Clarke-Pearson’s (1988) method. The H was 0.168 higher, and the PRC was 0.191 higher. As a result, the SHARP value was 0.114 higher.
To a large extent, we see the same pattern of results when comparing the Static-99 and MnSOST-4 among 1,604 offenders in the test set. Both instruments had the same ACC (0.981), and the MnSOST-4 was better calibrated. The AUC for the MnSOST-4 was 0.193 higher, a statistically significant difference using the DeLong et al. (1988) approach. The H-measure was 0.152 higher, and the PRC was 0.177 higher. Furthermore, the SHARP value was 0.105 higher.
The differences are not quite as pronounced when we compare the MnSOST-3 and MnSOST-4 among 541 offenders released in 2012. The results reveal that the MnSOST-3 had better calibration, whereas the MnSOST-4 performed slightly better for accuracy. When we focus on the predictive discrimination metrics, we see that the MnSOST-4 was 0.049 higher for the AUC, 0.018 higher for the H, and 0.036 higher for the PRC. In addition, the MnSOST-4 was 0.019 higher for the SHARP.
It is worth noting that while the MnSOTST-3’s AUC value (0.716) is adequate, it is quite a bit lower than that reported (0.796) during its development (Duwe & Freske, 2012). Because these results are based on only 1 year’s worth of releases, they are somewhat preliminary. Even though Duwe and Freske (2012) corrected for optimism, it appears that the AUC they reported for the MnSOST-3 was still too optimistic.
The overall results also reveal that the MnSOST-4 based on the RLR algorithm performed approximately the same as the assessment developed with the RF algorithm. For all three test sets, both algorithms had the same ACC values and the RLR model had slightly better RMSE values. Among the three discrimination metrics, the RLR model had a higher H-measure value for two of the test sets and a higher PRC value in all three test sets. Conversely, the RF model had a higher AUC in all three test sets. Overall, the RLR algorithm had a slightly higher SHARP value for the two 2010-2012 test sets, whereas RF had a slightly better SHARP value for the 2012 test set.
As noted above, the 1,772 offenders in the test set were divided into two groups—White and non-White—to test for bias. The MnSOST-4 based on the RLR algorithm performed better among White offenders but not by much. Although both groups had the same ACC value, the White offender test set had slightly better performance for the other four metrics. The DeLong et al. (1988) test revealed that the difference in AUC values (0.838 vs. 0.833) was not statistically significant at the .05 level. Overall, the SHARP value for the White offender test set (0.628) was .009 higher than that for the non-White offender test set (0.619).
The results presented in Table 4 assess how well the classification methods performed overall among the different test sets, but it is also important to determine how well they would perform in practice. Risk assessment instruments, in particular the MnSOST, are used to help guide risk-level assignments for sex offenders in Minnesota.Level 3 is the highest risk level, and historical data indicate that approximately 15% are given this risk-level designation. 6 If we used the various instruments examined here to identify the riskiest 15%, how well would the assessments do?
Predictive Performance Among Highest Risk Offenders.
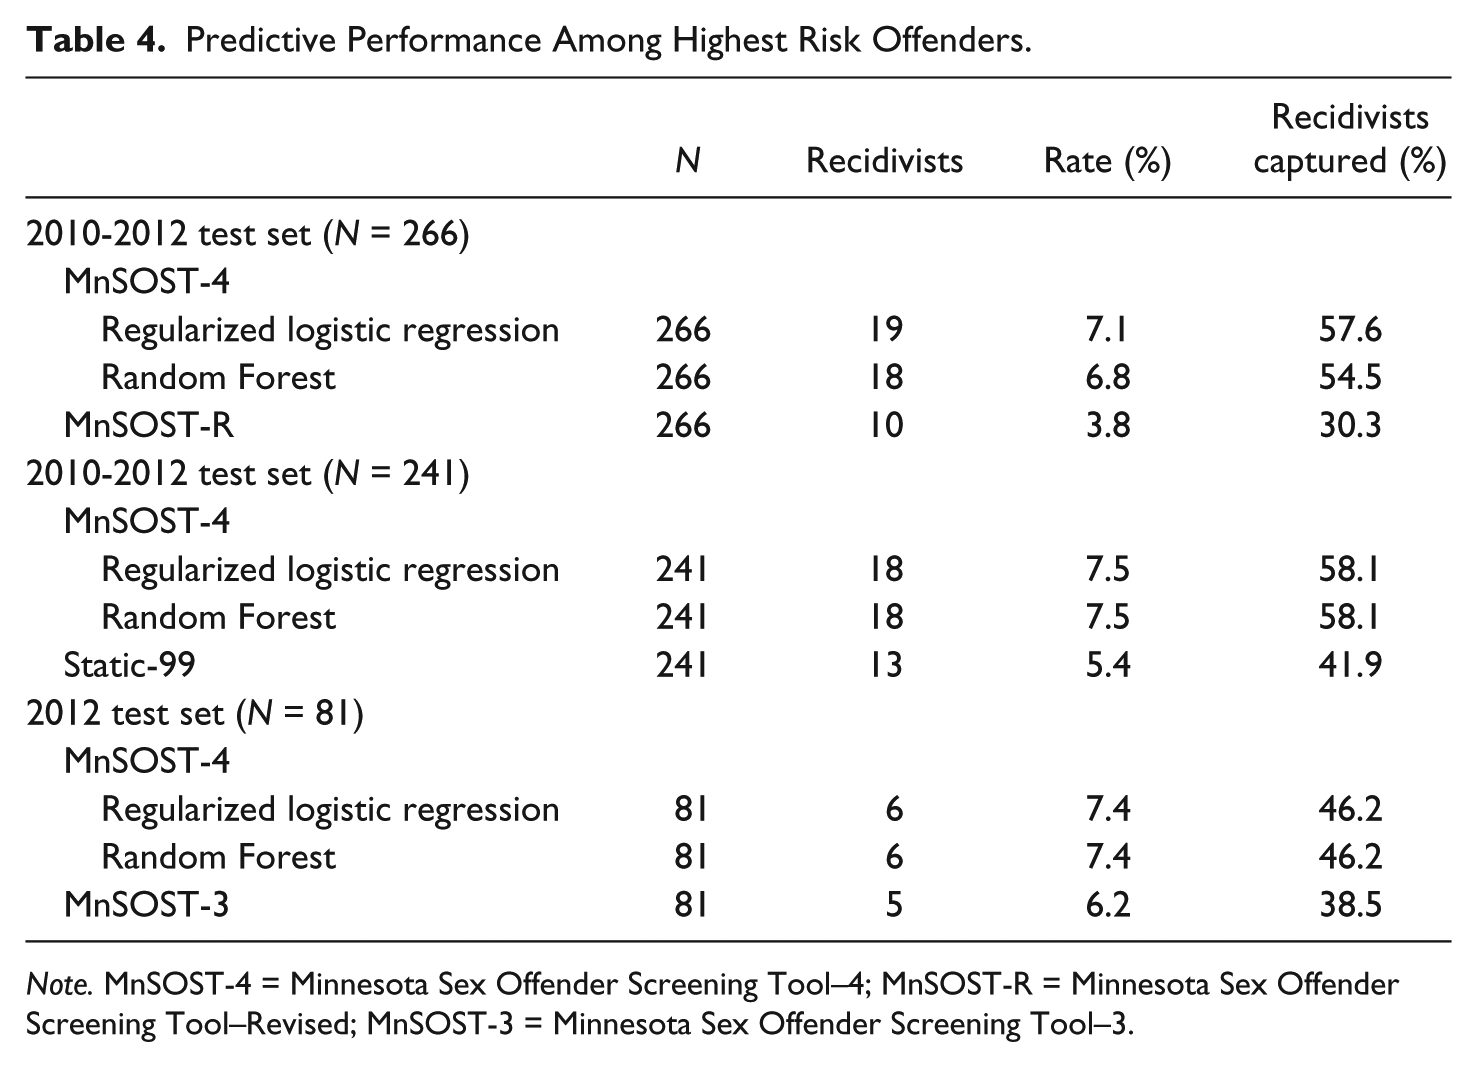
Note. MnSOST-4 = Minnesota Sex Offender Screening Tool–4; MnSOST-R = Minnesota Sex Offender Screening Tool–Revised; MnSOST-3 = Minnesota Sex Offender Screening Tool–3.
For the full test set, there were 1,772 offenders, and MnSOST-R and MnSOST-4 scores were available for each offender. If we focus on the 266 (i.e., 15% of 1,772) with the highest MnSOST-R scores versus the 266 with the highest MnSOST-4 scores, we see that the MnSOST-R would capture 10 recidivists compared with 19 for RLR and 19 for RF. Put another way, the MnSOST-R would capture 30% of the recidivists versus 58% for both RLR and RF. If we focus on the 241 (i.e., 15% of 1,604) with the highest Static-99 scores, the instrument would capture 13 recidivists (42% of 31). By comparison, the RLR model would capture 19 recidivists or 61% of the total, whereas RF would capture 18 or 58% of the total. If we focus on the 81 (15% of 541) in the 2012 test set with the highest MnSOST-3 scores, five were recidivists (or 38% of 13). Likewise, when we focus on the 541 released in 2012 with the highest MnSOST-4 scores, there would be six recidivists (46% of the total) apiece for both the RLR and RF models.
IRR Assessment
The results showed that the ICC for the eight raters was .901 for consistency and .896 for absolute agreement of ratings for the 10 cases (see Table 5). The overall IRR of the MnSOST-4 is, therefore, in the “good” range according to the criteria proposed by Duwe and Rocque (2017).
MnSOST-4 Interrater Reliability Assessment.
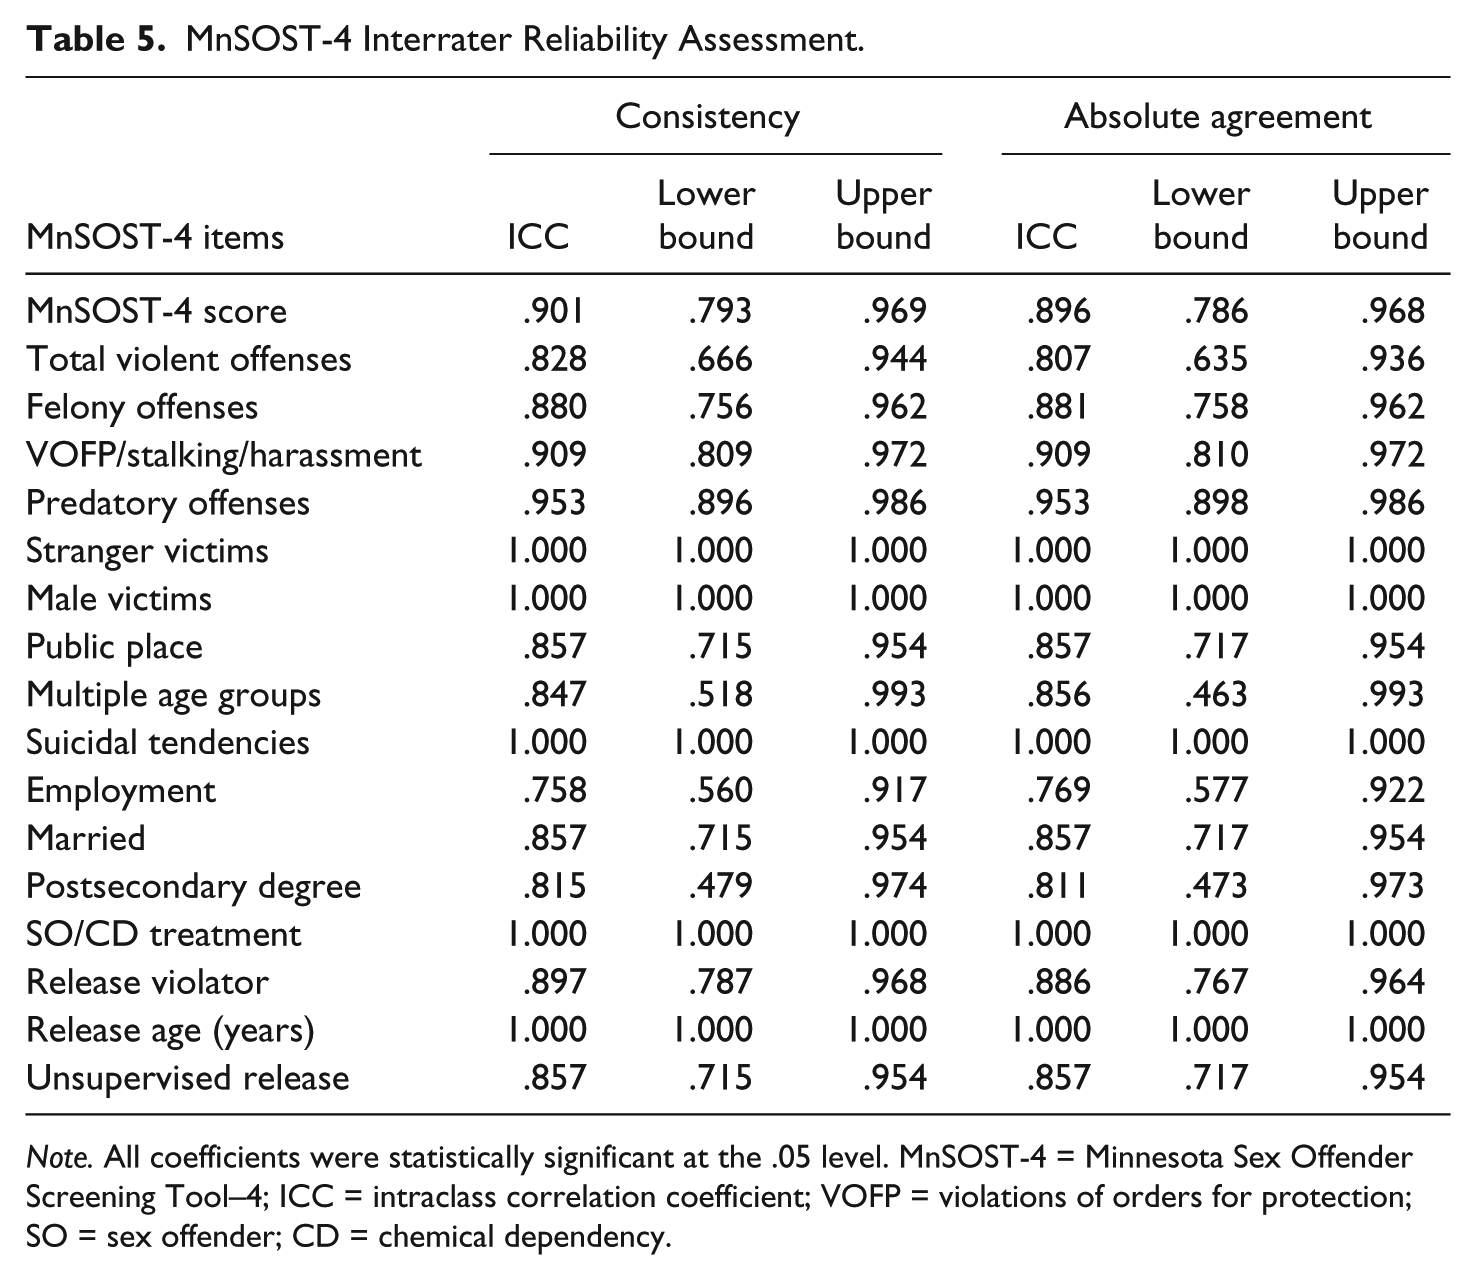
Note. All coefficients were statistically significant at the .05 level. MnSOST-4 = Minnesota Sex Offender Screening Tool–4; ICC = intraclass correlation coefficient; VOFP = violations of orders for protection; SO = sex offender; CD = chemical dependency.
The item-level data indicate an absence of any interrater disagreement for the following five items: predatory offenses, stranger victims, suicidal tendencies, SO/CD treatment, and age at release. With ICC values of .758 for consistency and .769 for absolute agreement, the employment item had the highest level of interrater disagreement.
Conclusion
Based on a review of the existing literature, this study identified promising and proven practices in the development and validation of recidivism risk assessments. While it may be debatable whether these are “best practices,” the results suggest that they are, at a minimum, “better practices.” Indeed, the findings indicate that the MnSOST-4 achieved a relatively high level of predictive performance across multiple metrics. The MnSOST-4 outperformed both the MnSOST-R and Static-99 by relatively wide margins, although its improvement over the MnSOST-3 was more modest. Still, the differences in predictive performance are sufficient to warrant the MnSOST-4’s replacement of the MnSOST-3 as the instrument the MnDOC uses to assess sexual recidivism risk. The analyses did not reveal significant racial/ethnic bias, and the IRR assessment indicated that the MnSOST-4 can be scored consistently by raters.
These findings are encouraging, although a few caveats are worth mentioning: First, as this study revealed, the MnSOST-3’s AUC in this study (0.716) is quite a bit lower than what Duwe and Freske (2012) reported in the development and validation study (0.796). Accordingly, when the MnDOC begins using the MnSOST-4 in practice, its predictive performance may fall short of the results presented here. Second, the MnSOST-4 was developed and validated on a population consisting of male sex offenders released from Minnesota prisons. It cannot be assumed that this instrument would deliver a similar level of predictive performance if it were applied to another sex offender population. This is true, however, even for global, widely used assessments such as the Static-99. For example, the AUC for the Static-99 reported in this study (0.654) is well below the AUC reported (0.705) by Helmus et al. (2012) in their meta-analysis. In short, prior to using an assessment on an offender population, the assessment’s predictive performance must be evaluated on that population.
These limitations notwithstanding, there are several broad lessons that can be drawn from the development of the MnSOST-4: First, using a feedback loop with an accelerated revision schedule may be helpful in further improving the performance of risk assessment instruments. More specifically, efforts to revise an assessment should begin as soon as complete performance data become available, which suggests that risk assessment instruments should have shorter shelf lives than what they have had in the past. In addition to measuring the performance of the “incumbent,” these data can be used to help determine whether a “challenger” can achieve greater predictive validity. If this feedback loop in which challengers are compared against incumbents is performed iteratively, it will presumably become progressively more difficult for a challenger to unseat an incumbent. In doing so, however, it is anticipated this process will help facilitate greater improvement in predictive performance.
Second, the development of the MnSOST-4 suggests that there may be advantages to using alternative measures for existing data. As evidenced by the stake in conformity index and multiple predatory offenses and victim age groups items, this study created single predictors out of multiple items that were not, on their own, significantly predictive of sexual recidivism. Creating consolidated measures not only helps identify significant predictors but it also provides what is arguably a simpler, more transparent approach for modeling interaction effects. In addition, male victim specialization was more predictive than an item that simply measured the number of sex offenses with male victims. Items that measure the extent to which offenders have specialized in sex offenses involving stranger victims or public places may also be more predictive than those that just record whether the offender has ever committed a sex offense against a stranger victim or in a public location. Although data were not available on the number of sex offenses committed against stranger victims or in public locations, future research should examine whether the use of more refined measures of prior sexual offending further enhances the prediction of sexual recidivism.
Third, determining how well an instrument performs should entail more than just reporting the AUC. As this study showed, manually scored tools should be accompanied by an IRR assessment, research should begin to routinely test for bias, and multiple performance metrics in addition to the AUC should be used. The SHARP metric, in particular, may be especially relevant for validations of tools designed to predict sexual recidivism as it taps into all three dimensions of predictive validity—accuracy, discrimination, and calibration—and is designed for highly imbalanced datasets.
Finally, testing multiple classifiers is critical to the development of a risk assessment instrument that is an optimal fit for the offender population and context to which it will be applied. As evidenced by the removal of the two interaction terms from the MnSOST-3 to the 3.1, the ability of practitioners to understand and explain, at least on a basic level, how an instrument assesses risk for individual offenders is paramount. Of the algorithms tested in this study, RLR is arguably the most transparent and interpretable. Given that its predictive performance was on par with the best performer (RF) among the other classifiers evaluated, the decision to base the MnSOST-4 on the RLR algorithm is relatively clear-cut. If, however, there had been a greater gap in performance between RF and RLR (e.g., if RF had, say, an AUC of 0.900 vs. 0.835 for RLR), then sacrificing this much predictive discrimination would be difficult to ignore and a decision to use the RLR algorithm more difficult to defend.
Despite RLR’s performance in this study, the “no free lunch” theorem bears repeating. There is no single best algorithm, for even the most promising ones such as boosted trees or RF can perform poorly sometimes. Just because RLR had a strong performance on the MnSOST-4 dataset does not necessarily mean that it would be a top performer in predicting sexual recidivism in other contexts. Indeed, even efforts to revise future iterations of the MnSOST may show that other algorithms outperform RLR in predicting sexual recidivism for Minnesota sex offenders. Because it is not possible to know beforehand which classifier will perform the best on a dataset, testing multiple classification methods is necessary. Evaluating multiple classifiers not only improves the odds of identifying the optimal algorithm for a dataset but it also enables a determination of the size of the potential trade-off between transparency and performance.
Footnotes
Declaration of Conflicting Interests
The author(s) declared no potential conflicts of interest with respect to the research, authorship, and/or publication of this article.
Funding
The author(s) received no financial support for the research, authorship, and/or publication of this article.