



Abstract
Pretrial detention makes up the majority of jail admissions, but little is known about this high-volume population. The current study fills this gap by examining the pretrial detention population in New York City and assesses their pretrial readmissions over a 10-year follow-up period. While the number of individuals detained pretrial has consistently decreased since 1995, the prevalence and the frequency of pretrial readmissions remain high: About 60% of the sample was readmitted at least once within 10 years and they were readmitted on average 3 times. A negative binomial model predicting readmission counts for felony and misdemeanor admissions found that males, non-Hispanic Blacks, and younger individuals were more frequently readmitted pretrial. Self-reported drug use and prior criminal records were associated with higher readmission counts. We also found that charge and discharge types predicted readmission counts. Findings suggest the importance of earlier intervention and developing targeted strategies to reduce further readmissions.
Introduction
Recent estimates suggest that the number of individuals admitted to jails increased from 9.7 million in 1993 to 13.6 million in 2008 (Minton & Zeng, 2016; Perkins, Stephan, & Beck, 1995). In 2015, there were 10.9 million individuals admitted to local jails in the United States and the average daily jail population was over 720,000 (Minton & Zeng, 2016). Jail is a unique criminal justice contact point because it holds individuals at different stages of case processing, including those waiting for trial (unconvicted), serving sentences shorter than one year, or waiting to be transferred to prison. Individuals detained pretrial comprise the largest proportion of jail admissions as well as the jail population. From 2005 to 2013, the number of unconvicted (i.e., pretrial) defendants held in local jails on any given day was over 450,000, and accounted for over 60% of the daily jail population (Minton & Golinelli, 2014). In New York City, which has one of the biggest jail systems in the country, approximately three quarters of admissions to the Department of Correction (DOC) in 2015 were for pretrial detention (Chauhan et al., 2016).
The sheer volume of pretrial detention has garnered attention from both policymakers and advocacy groups. Holding a person in jail for pretrial is costly for both the jurisdiction and the individual. It is estimated that local governments spend approximately 9 billion dollars for detaining individuals pretrial (Department of Justice, 2011). In New York City, the estimated annual cost per inmate was over $80,000 in 2012 and increased by 51% in 2016 (New York City Comptroller’s Office, 2016). Reducing the number of individuals detained pretrial, which makes up the majority of the jail population, may be one way to reduce the financial burden of the criminal justice system for local governments (Ortiz, 2015).
The cost of pretrial detention for an individual defendant goes beyond finances. Existing studies on the negative consequences of detention for individual defendants found that pretrial detention increased the probability of conviction as well as the probability of receiving a jail sentence (Heaton, Mayson, & Stevenson, 2017; Lowenkamp, VanNostrand, & Holsinger, 2013). A study on pretrial detention for misdemeanor cases in Harris County, Texas, found that detained individuals were more likely to plead guilty and to receive jail sentences than similarly situated individuals who were released (Heaton et al., 2017). The study also found higher recidivism rates among those detained pretrial, suggesting that there is a criminogenic effect of pretrial detention. Similarly, Lowenkamp and colleagues (2013) found that individuals detained pretrial compared with those released had 1.3 times higher likelihood of rearrest at a 2-year follow-up in a Kentucky jail.
There are also indirect costs for individuals detained pretrial. Collateral consequences of pretrial detention include negative impacts on health, child care, employment, and housing (Csete, 2010; Human Rights Watch, 2010; Open Society Foundations, 2011a, 2011b). Furthermore, as the length of pretrial detention increases, there is an increased risk of job loss and economic instability, which may, in turn, increase the risk of accumulating debt, not paying rent, and losing child custody (Ortiz, 2015). These are significant consequences, especially given that these individuals are presumed innocent until trial.
Although pretrial detention is both costly and high in volume, relatively little is known regarding readmission among this group. There are few existing reports (Olson, 2011, 2012; Olson & Huddle, 2013) that examine the overall jail readmission rates, but none have focused exclusively on pretrial detention or pretrial readmissions. Pretrial readmission should be differentiated from other measures of jail readmission (i.e., jail or prison sentence, or parole violation) because it does not necessarily indicate guilt or a conviction. Moreover, pretrial readmission should also be distinguished from other measures of recidivism such as rearrest and reconviction because of its distinctive nature. Indeed, pretrial readmissions always have a corresponding rearrest, but only a subset of the rearrest population is admitted to jail as a result of not being able to post bail. Two reports suggest that a substantial number of individuals are detained pretrial because of their inability to pay bail rather than being a high flight risk (New York City Criminal Justice Agency, 2016; Ortiz, 2015). A report by the New York City Criminal Justice Agency (2016) found that only one fifth of individuals whose bail was set under $500 were able to post bail, suggesting a strong financial component to pretrial detention. As such, pretrial readmission merits an inspection separate from other types of jail admissions and other measures of recidivism.
In addition, there is no research that has systematically examined how often pretrial readmission occurs and what factors are associated with pretrial readmissions. A few studies have focused on high utilizers: the small number of individuals who are cycling through the jail system and account for a substantial number of readmissions (Ford, 2005; MacDonald et al., 2015; Mayor’s Task Force on Behavioral Health and the Criminal Justice System, 2015). For example, in New York City, 400 individuals accounted for approximately 10,000 admissions over a 5-year span (Mayor’s Task Force on Behavioral Health and the Criminal Justice System, 2015). However, all of the existing studies focus on the highest utilizers of jails regardless of admission types and ignore the wide range of jail utilizers with different patterns of readmission including varying readmission frequencies.
A systematic investigation of pretrial readmissions is critical to get a fuller picture of jail admissions and to explore ways to reduce pretrial detention. This will ultimately provide a fairer criminal justice system and reduce excessive costs and consequences to individuals detained pretrial as well as to local governments. As a first step in this effort, the current study attempts to fill the gap in the literature by (a) examining the prevalence and frequency of pretrial readmission over a 10-year span and (b) exploring factors associated with the frequency of pretrial readmission. We focus on the pretrial population in New York City, which has one of the largest jail systems in the country.
Literature
Profiles of Jail Population
There is a body of research documenting demographic and charge characteristics of individuals admitted to jail and prison (Kaeble & Glaze, 2016; Minton & Golinelli, 2014; Minton & Zeng, 2016), but much of it is based on national estimates and some urban areas. Moreover, the majority of this work does not focus specifically on the pretrial detention population. Given this lack of literature, in this section, we review profiles of those admitted to jails, more broadly, by demographic characteristics, charge characteristics, criminal history, and dispositions.
The proportion of females confined to U.S. jails on any given day has increased from 11% in 2000 to 15% in 2014, but males continued to far outnumber women with regard to admissions and the average daily population (Minton & Golinelli, 2014). In New York City, females consistently accounted for 10% of any type of jail admission (Chauhan et al., 2016). Although these patterns reflected general arrest trends (Snyder, 2012), male detention rates, relative to female detention rates, were much higher than male arrest rates, relative to female arrest rates. There was also variation in the racial and ethnic distribution of jail populations. Nationally, in 2006, 44% of individuals held in local jails were White, 39% were Black, and 16% were Hispanic (Sabol, Minton, & Harrison, 2007). However, when accounting for the population base, the rates were much higher for Blacks and Hispanics relative to Whites; the jail incarceration rate for Blacks (815 per 100,000) was 5 times higher than for Whites (170 per 100,000), and 3 times higher than for Hispanics (283 per 100,000).
Furthermore, there is regional variation in the racial and ethnic distribution of jail populations based on the demographic composition of the jurisdiction. In Los Angeles, Hispanics accounted for 49% of the Los Angeles County jail population, followed by Blacks (31%), Whites (15%), and Asians (3%; Austin, Naro-Ware, Ocker, Harris, & Allen, 2012). In contrast, in New York City, where 22% of the population in 2015 was Black, Blacks accounted for 53% of jail admissions followed by Hispanics (33%) and Whites (10%; Chauhan et al., 2016). When accounting for the population base, racial and ethnic differences in admissions rates were even greater; the admissions rate for Blacks (1,971 per 100,000) was 10 times higher than for Whites (191 per 100,000), and 1.7 times higher than for Hispanics (1,132 per 100,000). However, neither of these studies disaggregated the rate of pretrial detention from other reasons for admission to local jails.
We were unable to locate age-specific national estimates for jail populations, but a report on local jails in the United States found that 1% of the jail population was juvenile (Minton & Golinelli, 2014). In New York City, individuals who were 35 years and older comprised the majority of annual admissions in 2015 (Chauhan et al., 2016). This age composition was similar to state and federal prison estimates (Carson & Anderson, 2016). After accounting for the population base, however, individuals who were 35 years and older had the lowest admissions rate at 674 per 100,000, while 21- to 24-year-olds had the highest admissions rate at 1,687 (Chauhan et al., 2016). There is some evidence to indicate that there is a nonlinear relationship between age and the likelihood of being detained pretrial. Specifically, felony defendants aged between 21 and 54 years were more likely to be detained pretrial compared with younger and older individuals (Demuth, 2003; Demuth & Steffensmeier, 2004). The “peak age” of pretrial detention requires a more nuanced age breakdown.
Relatively little is known with regard to charge characteristics and case dispositions of individuals detained pretrial. A report on pretrial detention in federal district courts found that half of those detained in federal system in 1995 were detained for drug charges; this decreased to 30% over the 15-year span (Cohen, 2013). During this period, the proportion of individuals detained for immigration cases increased from 15% to 45%, representing the most prevalent charge in 2010 followed by drug charges.
Charge characteristics of local jail populations differ from the federal district court population. Furthermore, there is a regional variation in charge characteristics among local jails. In 2011, 78% of the Los Angeles County jail population was either charged or sentenced with a felony, with more than half of these individuals being charged with either violent or sex offenses (52%), followed by drug offenses (16%) and nonviolent property offenses (17%; Austin et al., 2012). On the contrary, in New York City, felony charges accounted for less than half (47%) of all jail admissions in 2015 (Chauhan et al., 2016). Moreover, unlike Los Angeles County jails where the most common charge types were violent or sex offenses, nonviolent offenses were the most common crime types for New York City jail admissions (either felony or misdemeanor) (49%), followed by violent or sex offenses (27%) and drug offenses (23%). In addition to regional variations in charge characteristics, it is also unclear whether charge profiles are different by types of jail admissions including pretrial detention compared with direct jail sentences without pretrial detention.
Studies examining the criminal history distribution (e.g., prior arrest, conviction, and admissions) among those detained pretrial are scarce. In federal district courts, the proportion of individuals detained pretrial with no prior arrest or conviction decreased from 1995 to 2010 (Cohen, 2013). During this same time period, the proportion of individuals who had five or more prior convictions increased from 13% to 20%. There are no existing national estimates on how cases are disposed for individuals detained pretrial, but previous research on county jails suggests regional variation with regard to discharge type. In Los Angeles County jail, in 2011, the most common type of discharge for the pretrial detention population was time served (48%), followed by transferred to a facility such as state prison (27%) and released as pretrial (18%, Austin et al., 2012). Another study on jails in Cook County, Illinois, found that in 2011, 33% of jail inmates were discharged pretrial (posted bail), 15% were released as time served, and 19% were transferred to state prison (Olson, 2011). A recent report on the pretrial population in New York City correctional facilities found that 66% of individuals detained pretrial were released either by paying bail or released on their own recognizance (ROR), 30% were either sentenced to prison or served time in jail, and only a few (3%) received a favorable disposition such as adjournment in contemplation of dismissal, dismissal, acquittal, or conditional discharge (Chauhan et al., 2017).
Profiles of Individuals Readmitted to Jails
There is a body of research examining the probability of recidivism and predictors of recidivism among correctional populations (see Gendreau, Little, & Goggin, 1996, for systematic review). However, most of this work focuses on recidivism (defined as rearrest, reconviction, or readmission) among the prison population (see Bales & Piquero, 2012; Gendreau et al., 1996; Huebner, DeJong, & Cobbina, 2010; Langan & Levin, 2002). Much less is known about readmissions to jails, particularly for those who are readmitted for pretrial. This is most likely because, until recently, jails have received relatively little empirical attention compared with prisons.
Examining specific individual and criminogenic characteristics associated with higher levels of readmission is critical to providing support services, diversion alternatives, and reducing the jail population. A few studies have examined the prevalence of jail readmissions as well as the profiles of those readmitted. In 2010, in the Cook County Jail, Illinois, over 12,000 individuals were admitted 2 or more times in 1 year; 13% of males and 9% of females were admitted twice in 1 year (Olson, 2011). Furthermore, another 2,900 individuals (4%) were admitted 3 or more times in 2010. Of those released from the Cook County Jail in 2007, over half returned to jail within 3 years (Olson & Huddle, 2013). Between 2007 and 2011, 21% of individuals admitted to the Cook County Jail accounted for half of all admissions during that period. A similar trend exists for the New York City jail population. Between 2008 and 2013, 473 individuals were admitted to the New York City DOC 18 times or more, accounting for approximately 10,000 admissions over a 5-year span (Mayor’s Task Force on Behavioral Health and the Criminal Justice System, 2015). These studies do not distinguish between types of readmission (e.g., serving jail time, pretrial detention). The proposed study builds upon this work by focusing exclusively on pretrial readmissions.
Little is known about other individual or criminogenic characteristics associated with readmission. Ford (2005) provided a glimpse into 19 individuals in a Florida county jail who were frequent utilizers. She found that they had extensive jail admissions records (an average of 57 jail admissions). The majority of these frequent utilizers were male (78%), White (67%), and had an average age of 44 years. In addition, most of them had a history of substance abuse (90%). These individuals were more likely to be readmitted on misdemeanor charges such as public disorder, relative to felony charges.
Overall, research indicates that a small number of individuals are frequent utilizers of the system. This suggests that alternative programming and support services could reduce critical personal and fiscal costs associated with this “revolving door” phenomenon. Notably, many of the above studies take cross-sectional and retrospective approaches, further limiting our knowledge of predictors of readmission. To our knowledge, this is the first study to examine individual characteristics of those being readmitted pretrial and, more importantly, factors that predict pretrial readmission.
Research Questions
The main purpose of the current study is to obtain a portrait of the pretrial detention population in New York City, focusing on their pretrial readmissions. We follow individuals detained pretrial in New York City DOC for 10 years after discharge to explore the prevalence and frequency of pretrial readmission among those admitted pretrial between 2000 and 2002. Furthermore, we examine which individual and charge characteristics predict readmission counts. The specific research questions are as follows:
Method
Data and Sample
We use the New York City DOC data which document admissions and discharge records of the entire population admitted to DOC custody between 1995 and 2016. 1 In New York City, individual defendants are admitted to DOC custody when they are not released on their recognizance (ROR) at the first arraignment, capturing about 30% of the arrest population. 2 Types of admission to the DOC custody include pretrial detention, direct jail sentence (i.e., sentenced less than a year), parole violations, and immigration cases. Given that the focus of the current study is on pretrial detention, we limit our study sample to those who are admitted for pretrial detention at arraignment, which accounts for 75% of the admissions to New York City DOC.
The unit of analysis is an individual who is detained pretrial, and we limit our sample to those who are admitted for pretrial detention between 2000 and 2002 (N = 129,987) for two reasons. First, it allows us to use 5 years of prior admission records from 1995 to 1999 to create criminal history proxies for the sample. Second, it allows us to have a 10 year of follow-up period for every individual in the sample including those who were detained pretrial for an extensive period of time (e.g., 3 years) at the reference admission. For instance, if an individual was admitted in December 2002 and discharged in December 2005, we follow that individual until December 2015. Furthermore, we limit the sample to individuals between 16 and 80 years of age for the reference admission. Until recently, New York State was one of two states (the other being North Carolina) where 16 is age of criminal responsibility. We exclude individuals 81 years and older because of the small sample size (n = 59).
Independent Variables
Demographics and individual characteristics
Table 1 presents basic descriptive statistics for the predictor variables and the dependent variable in the model for all admissions and by top charge level at admission (i.e., felony versus misdemeanor). 3 Overall, the sample is primarily male (89.3%), and there are no notable differences between felony and misdemeanor admissions. We categorize race and ethnicity into three groups: non-Hispanic White (9.4%), non-Hispanic Black (54.3%), and Hispanic (36.2%). We exclude unknown race and ethnicity as well as other racial and ethnic groups such as Asian and Native American from the analysis due to small sample sizes (3.1% of the total study sample). There are more non-Hispanic Whites (11.3%) and non-Hispanic Blacks (56.9%) among misdemeanor admissions relative to the felony admissions. The mean age of the study sample is 31 years, but the mean age of individuals admitted for misdemeanors (M = 33) is older than individuals admitted for felonies (M = 30). In the model specification, we group age into 5-year intervals from 16 to 60 years, and group age 61 to 80 into a single group because of the small sample size. This 5-year age group enables us to explore the nonlinear relationship between age and readmission counts as found by other researchers (Demuth, 2003; Demuth & Steffensmeier, 2004). We also include an indicator of the self-reported drug use in the model. Less than one fifth of the study sample self-reported drug use in both misdemeanor and felony admissions. However, we recognize that this is likely an underestimation of the actual prevalence of drug use among the sample (Binswanger et al., 2010).
Descriptive Statistics for Study Sample for the Full Sample and by Charge Level.

Note. ROR = released on their own recognizance; CD = conditional discharge; ACD = adjourned in contemplation of dismissal.
Presented summary statistics include mean and standard deviation.
It refers to the number of readmissions conditional on readmission.
Crime characteristics
The majority of the sample (61.0%) is admitted for a felony level top charge at the admission. For charge characteristics at admissions, we include top charge crime type, having more than one charge, and having an open warrant. We code top charge into six categories to capture the diversity of charges which may involve different motives of offending and different probabilities of arrest: (a) person crime which includes homicide, sex offense, robbery, and assault; (b) property crime which includes burglary, larceny, and other types of theft such as stolen property, fraud, and forgery; (c) substance sale; (d) substance possession; (e) possession of dangerous weapons; and (f) other. The most frequent charges in the “other” category include motor vehicle crime, criminal contempt, and criminal mischief. The most common crime category among felony admissions is person crimes (30.5%) followed by substance possession (23.4%) and substance sale (20.7%). As expected, the crime distribution for misdemeanor admissions is different from felony admissions. Person crimes (32.3%) are still the most frequent of the six categories among misdemeanor admissions; other category (23.2%) is the second most frequent crime types. The DOC dataset documents up to four charges, and only a small proportion of the sample has two or more charges. The proportion of admissions with two or more charges is higher for misdemeanor cases (18.3%) than for felonies (13.9%). Having an open warrant is relatively rare for both felony (4.9%) and misdemeanor admissions (4.4%).
Criminal history proxies
We use the admission records from 1995 to 1999 to create criminal history proxies for the sample. We count (a) the number of admissions for pretrial detention, (b) the number of jail sentences (counted if a defendant was admitted for a direct jail sentence, or if the defendant was admitted for pretrial detention and discharged after serving time), and (c) the number of prison sentences (counted if a defendant was admitted to be transferred to an upstate prison, or if the defendant was transferred to prison after pretrial detention). In the model specification, we group the number of pretrial admissions and the number of jail sentences into three categories: no record, one prior record, and two or more prior records in the last 5 years. For the number of prior prison sentence, we categorize into no prison sentence and one or more prison sentence because the majority of the sample do not have a prior prison record in the last 5 years (92%).
Discharge type
Once an individual is admitted as pretrial to a DOC facility, he or she can be discharged before the case is disposed either by posting bail or by being released on their own recognizance (ROR). Getting ROR after admission to DOC custody is different from getting ROR at the initial arraignment in terms of the nature of release. In New York City, once in DOC custody, individuals are ROR when the prosecutor does not successfully proceed with further case processing such as issuing information (for a misdemeanor case) or an indictment (for a felony case) within a required timeline (Criminal Procedure Law [CPL] §170.70 and §180.80). If individuals do not post bail or get ROR, they are detained until the final case disposition. Those cases can be disposed in favor of defendants either by being dismissed, adjourned in contemplation of dismissal (ACD), conditionally discharged, or acquitted at disposition. If the defendant is found guilty, he or she serves time either in jail or prison, or already served time while awaiting trial. We use seven categories for discharge type: (a) bail paid; (b) ROR (after admission); (c) case dismissed, acquitted, or ACD; (d) conditional discharge, fine, or probation; (e) time served or sentence expired; (f) prison transferred; and (g) other. More than 60% of the sample was discharged before case disposition, either by posting bail (39.8%) or by getting ROR (22.7%). About four fifths of those who were detained pretrial until case disposition were convicted, and most of them either served time in jail (51.4%) or were sentenced and transferred to prison (27.3%). The “other” discharge category includes being delivered to officer, warrant lifted, transfer to state hospital, and so on, and it was a small proportion (3.3%).
Borough of arraignment
DOC facilities take individuals arraigned from the five boroughs (or counties) of New York City: Brooklyn, the Bronx, Manhattan, Queens, and Staten Island. Each borough is distinct in terms of population size, enforcement rates, and case processing procedures ( Chauhan, Welsh, Fera, & Balazon, 2015; Warner, Lu, Fera, Balazon & Chauhan, 2016). We account for the borough-level variation by including a variable for each borough in the model.
Dependent Variable
We define readmission as an additional pretrial detention after discharge from the reference pretrial admission, and count the number of pretrial readmissions 10 years after discharge. Given that the main focus of the analysis is pretrial detention, any readmissions, other than for pretrial detention, such as jail sentences, transfer to prison, or violating parole, are not counted as readmissions in the current study. On average, the sample had about two readmissions, with a higher mean for a misdemeanor admission (M = 2.4, SD = 3.5) relative to a felony admission (M = 1.7, SD = 2.6) for the reference admission. Conditional on readmission, individuals admitted for a misdemeanor had an average of four readmissions while individuals admitted for a felony had an average of three readmissions.
Analytic Strategy
First, we examine what proportion of the study sample is readmitted for pretrial detention by year up to 10 years after release. Then, we explore the average readmission counts by individual, charge, and discharge characteristics. To examine predictors of readmission counts, we estimate a regression model that predicts readmission counts as a function of individual characteristics, current charge and criminal history characteristics, discharge type, and borough of arraignment. We use a negative binomial regression model to account for the overdispersion of the count dependent variable (Berk & MacDonald, 2008). The effects of the predictors on readmission counts may vary for misdemeanor and felony admissions; therefore, we run two separate regression models.
Results
Prevalence and Frequency of Pretrial Readmission Among Pretrial Detention Sample
Figure 1 presents the cumulative probability of pretrial readmissions by year for a 10-year follow-up for the full sample and by charge level. Approximately one third of the sample was readmitted within 1 year of discharge, and half of the sample was readmitted within 5 years of discharge. There were some individuals who were first readmitted after 5 years of discharge, but the rate remained relatively low after the 5-year mark. Overall, 57% of the sample was readmitted for pretrial detention within 10 years of discharge. The misdemeanor sample had a higher prevalence of readmission than the felony sample throughout the follow-up period, although the difference between two samples was only marginal.

Prevalence of pretrial readmission by follow-up period.
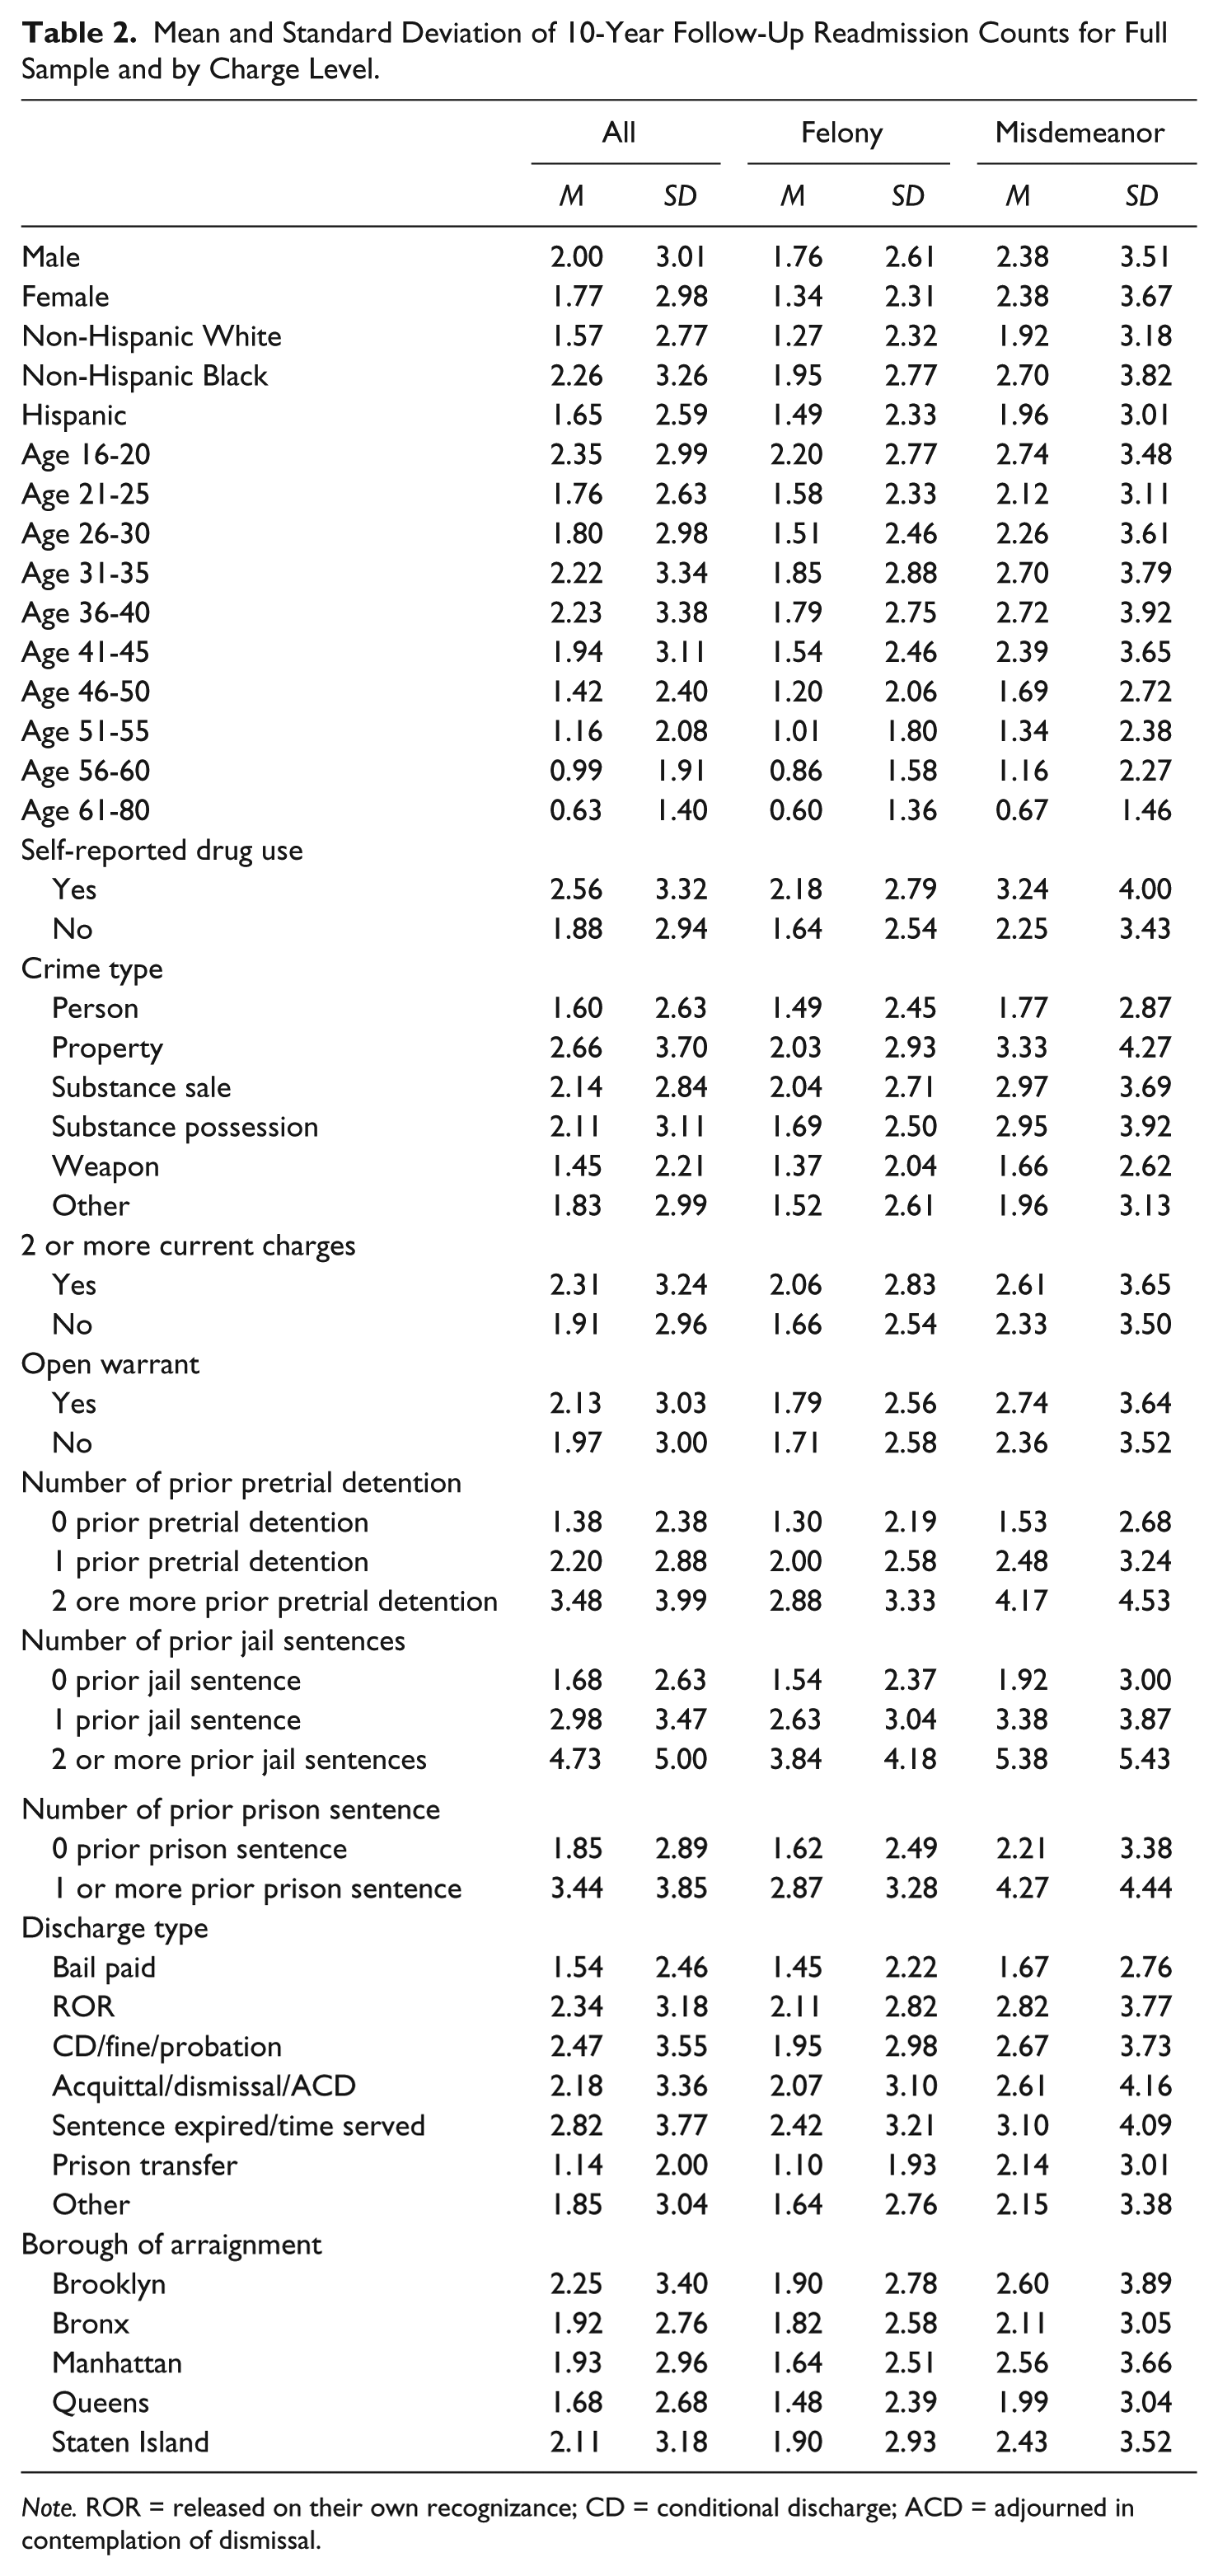
Table 2 presents the mean and standard deviation of pretrial readmissions by individual, charge, and discharge characteristics for the full sample and by charge level. Males had higher readmission counts than females in the total sample and among felony admissions. There were no sex differences in readmissions for misdemeanor admissions. Overall, non-Hispanic Blacks had higher readmission counts than non-Hispanic Whites and Hispanics, but the difference in the readmission counts between non-Hispanic Whites and Hispanics was less dramatic, especially for misdemeanor admissions. Readmission counts also differed by the age at admission. Notably, there was a nonlinear relationship between the age of reference admission and readmission counts. The youngest age group (age 16-20) had more than two readmissions during 10 years of follow-up, with the highest readmission counts among this age group regardless of charge level. Readmission counts did not show a consistent decrease with the age of defendant. Young adult groups (age 21-25 and age 26-30) had substantially lower readmission counts than the middle adult groups (age 31-35 and age 36-50), who had similar readmission counts as the youngest age group (ages 16-20). The readmission counts declined consistently for the remaining age groups. Individuals who self-reported drug use had higher readmission counts than those who did not self-report drug, regardless of charge level.
Mean and Standard Deviation of 10-Year Follow-Up Readmission Counts for Full Sample and by Charge Level.
Note. ROR = released on their own recognizance; CD = conditional discharge; ACD = adjourned in contemplation of dismissal.
Among six types of top charge at admission, property crime had the highest readmission counts, followed by substance sale and substance possession charges. Individuals who had a substance-related charge had, on average, two readmissions for a felony admission and three readmissions for a misdemeanor admission. Weapons charges had the lowest readmission count, regardless of charge level. Other charge characteristics such as having more than one charge and having an open warrant at the reference admission were related with higher readmission counts. Prior admission history had a positive relationship with readmission counts. Notably, individuals admitted for misdemeanors with extensive criminal histories had the highest readmission counts in our sample. Two or more jail sentences had the highest readmission counts, regardless of charge level. Furthermore, prior jail sentences had higher readmissions counts relative to prior pretrial detention and prior prison sentence. Among the seven discharge types, jail sentence (i.e., time served and sentence expired) had the highest readmission counts compared with other discharge types, regardless of charge level. Among the five boroughs, Queens had the lowest readmission counts compared with the other boroughs, regardless of charge level.
Models Predicting Readmission Counts for a 10-Year Follow-Up After Discharge
Table 3 presents exponentiated coefficients (incident rate ratio [IRR]) and standard errors of the negative binomial regression models predicting counts of readmission for a 10-year follow-up after discharge. To allow for the differences in the effect of predictors by charge level, we analyzed the data separately for felony and misdemeanor admissions.
Model Predicting Readmission Counts Within 10-Year of Discharge.

Note. IRR = incident rate ratio; ROR = released on their own recognizance; CD = conditional discharge; ACD = adjourned in contemplation of dismissal; AIC = Akaike information criterion; BIC = Bayesian information criterion.
p < 0.1. **p < 0.05. ***p < 0.01.
Regardless of charge level, males had significantly higher readmission counts relative to females, holding other factors constant. In the felony model, males were expected to have readmission counts 1.5 times greater than females, while the effect of male was slightly smaller (IRR = 1.3) in the misdemeanor model. In both felony and misdemeanor models, defendants’ age had a nonlinear relationship with readmission counts. The youngest age group (age 16-20), which was the reference group, was expected to have the highest readmission counts compared with all other age groups. The IRR of age group did not continuously decrease. Instead, the 31-35 age group showed the highest IRR which suggested that this group was the second most frequently readmitted after the reference group. In the felony model, non-Hispanic Blacks and Hispanics had significantly higher readmission counts than non-Hispanic Whites, although the difference between Hispanics and non-Hispanic Whites was marginal. In the misdemeanor model, non-Hispanic Blacks had significantly higher readmission counts than non-Hispanic Whites and Hispanics, and there was no difference between non-Hispanic Whites and Hispanics. Holding other factors constant, self-reported drug use predicted 1.5 times greater readmission counts in the felony model, while the effect of self-reported drug use in the misdemeanor model was slightly smaller (IRR = 1.3).
Predicted readmission counts varied by crime type. In both the felony and misdemeanor models, defendants who were admitted for a weapons charge had the lowest predicted readmission counts. Individuals charged with property crimes such as burglary and larceny had the highest predicted readmission counts. Readmission counts for property crime were 1.4 times greater than readmission counts for person-related crime in the felony model, and 1.5 times greater in the misdemeanor model. The effect of substance possession charge on readmission counts differed by model. Whereas a substance sale charge predicted significantly higher readmission counts than a substance possession charge in the felony model, there was no difference between substance sale versus substance possession in the misdemeanor model. Having more than one charge at admission predicted greater readmission counts for both felony and misdemeanor models. Having an open warrant significantly decreased the counts of readmission in the misdemeanor model, but not in the felony model.
All three measures of criminal records in the last 5 years had strong positive relationships with readmission counts. Of the three measures of criminal record, the count of pretrial detention in the last 5 years was the strongest predictor of readmission counts, after holding other factors constant. Two or more prior pretrial detention admissions, relative to no prior record, predicted 1.8 times greater readmission counts in the felony model, and 2.0 times greater readmission counts in the misdemeanor model. Two or more jail sentences, relative to no jail sentences, predicted 1.6 times greater readmission counts in the felony model, and 1.5 times greater in the misdemeanor model. Prior prison sentence, relative to no prison sentence, predicted 1.3 times greater readmission counts, regardless of charge level.
Predicted readmission counts differed by discharge type. In both the misdemeanor and felony models, prison transfer was the only discharge type that reported IRR below one, which suggested prison transfer predicted the lowest readmission counts among the seven discharge types. Predicted readmission counts of prison transfer were 0.6 times those of bail paid (reference category) in the felony model and 0.8 times in the misdemeanor model. Two discharge types indicating a release before final case disposition had significantly different predicted readmission counts: Depending on the model, ROR predicted 1.3 to 1.5 times greater readmission counts than bail paid. Moreover, favorable disposition outcomes such as acquittal, dismissal and ACD predicted significantly higher readmission counts than bail paid (IRR = 1.2-1.3). The effect of other discharge types on readmission count did not differ much by charge level with one exception: The time served or sentence expired discharge type (IRR = 1.3) predicted the highest readmission counts in the felony model, while ROR (IRR = 1.5) predicted the highest readmission counts in the misdemeanor model.
We found substantial differences in the predicted readmission counts across the five boroughs. In both the felony and misdemeanor models, the IRR for all boroughs except Staten Island was lower than one, which suggested arraignments in Brooklyn (reference) predicted the highest readmission counts among the five boroughs. Although the IRR for the Bronx, Manhattan, and Queens was not substantially different, arraignments in Queens predicted the lowest readmission counts in the felony model and arraignments in the Bronx predicted the lowest readmission counts in the misdemeanor model.
Discussion and Conclusion
Pretrial detention is one of the most understudied criminal justice contact points and warrants special attention from both academics and policymakers. Individuals who are detained pretrial are in a unique circumstance: Their legal status guarantees presumption of innocence until conviction, but sometimes they are detained due to a high risk for failure to appear or inability to pay bail. No matter how short a period of time those individuals are staying in jail, the negative consequences of incarceration can be substantial. The negative consequences of pretrial detention include, but are not limited to, unemployment, housing instability, child care and custody issues, and an increased risk of short- and long-term future criminal involvement (Heaton et al., 2017; Lowenkamp et al., 2013).
The goal of the current study was to better understand readmissions of the pretrial detention population in New York City, a major metropolitan area in the United States. New York City has experienced 47% decrease in jail admissions from 1995 to 2015 (Chauhan et al., 2016). In 2017, it was announced that there is a further commitment to further reducing the average daily jail population by 25%, to 7,000 by 2022 (New York City Office of the Mayor, 2017). Understanding how prevalent pretrial readmission is among this population and what factors are associated with readmission frequency is crucial for developing programs and strategies to reduce the number of individuals admitted pretrial, which comprises 75% of jail admissions. To our knowledge, this is the first study that prospectively examines readmissions of those detained pretrial over an extended period.
Even within the context of steady declines in jail admissions in New York City, we found that pretrial readmissions occurred for the majority of our sample. Approximately 60% of the sample was readmitted for pretrial detention at least once over the 10-year follow-up period. Moreover, the likelihood of readmission was highest within the first year of discharge, which emphasizes the need for early intervention efforts to prevent pretrial readmissions. Furthermore, if an individual is readmitted pretrial, they are readmitted on average 3 times during the 10-year follow-up period. This high frequency of readmissions further highlights the importance of examining factors associated with readmission counts to understand the mechanism behind it.
To some extent, our results on the effect of individual, charge, and discharge characteristics on readmission counts are consistent with previous recidivism studies using different criminal justice populations (Cottle, Lee, & Heilbrun, 2001; Durose, Cooper, & Snyder, 2014; Gendreau et al., 1996; Langan & Levin, 2002). As with previous recidivism studies on prison population, we found that prior criminal history and the age of defendant were the strongest predictors of readmission counts. Indeed, if an individual had a history of jail admissions of any kind in the past 5 years, they were more likely to be readmitted as pretrial in the future. Among our three proxy measures of criminal history, the count of pretrial detention admissions had the strongest predictive power in both felony and misdemeanor models. Future research, using full criminal records such as counts of arrest and conviction, will extend our current understanding on the effect of criminal history on pretrial readmission.
The relationship between age and the count of pretrial readmission is noteworthy. First, we did not find the traditional age–crime curve (Farrington, 1986) when examining the age distribution of readmission counts. Instead of a peak at adolescence and then a steady decline, the frequency of readmission was the highest among the youngest age group (age 16-20) followed by middle adult groups (age 31-35 and age 36-40). However, in a model that held other factors constant, the youngest age group had, by far, the highest predicted readmission counts. This may be a particularly high-risk group, given their higher prevalence for felony admissions. Nonetheless, the results suggest that intervention efforts targeted toward this youngest age group can be a valuable investment for preventing future criminal justice contact. Developmental stages of emerging adulthood (ages 16-25) may be ripe points of intervention particularly because personalities have not solidified and the prefrontal cortex has not fully matured (Blakemore & Choudhury, 2006; Romer, 2010; Steinberg, 2010). Furthermore, diversion strategies that prevent the attainment of a criminal record during this developmental period may also assist with better life outcomes such as employment. This may lead to desistence from criminal activity and fewer admissions for pretrial detention.
Non-Hispanic Blacks had the highest predicted readmission counts compared with other demographic groups, while the difference between non-Hispanic Whites and Hispanics was neither strong nor consistent across charge levels. To some extent, this is consistent with previous research on those released from state prisons that consistently found higher recidivism rates among Blacks relative to Whites measured as rearrest, reconviction, and readmission to prison (Langan & Levin, 2002). Socioeconomic status (SES) of an individual is a critical element as to whether an individual can pay bail at the initial arraignment and therefore avoid pretrial detention. The SES of individual defendants, which was not accounted for in our model, can be a confound with race and ethnicity. In 2011, in New York City, 30% of Hispanics and 24% of non-Hispanic Blacks were living below the poverty line compared with 12% for non-Hispanic Whites (Align, 2012). Therefore, SES may explain the differences between Blacks and Whites. However, this confound does not hold for Hispanics given they have a higher likelihood of living below the poverty line but lower likelihood of pretrial readmission. Notably, there is a body of research documenting the “Latino Paradox” which finds that Hispanic Americans function better on a range of social indicators than would be expected given their SES, possibly due to stronger social networks (Burchfield & Silver, 2013; Martinez, 2002; Nielsen, Lee, & Martinez, 2005; Sampson, 2008; Sampson, Morenoff, & Raudenbush, 2005). This same phenomenon may be present with pretrial readmissions. Future research should account for an individual’s SES to examine the extent to which SES is confounded with racial differences in readmission counts. Future research should also explore whether the strength of social supports explains the lack of differences in readmissions between Hispanics and Whites.
With regard to other risk factors, we found that self-reported drug use predicted substantially higher readmission counts, consistent with previous research findings (Greenberg & Rosenheck, 2008; Metraux, Roman, & Cho, 2007; National Health Care for the Homeless Council, 2013). We recommend correctional agencies add this self-report question to their intake process to better understand risk profiles of those detained pretrial. Even though this question may not accurately reflect actual drug use among the pretrial population, it functions as tool to screen for future readmission risk. Individuals who self-report drug use can be provided with additional resources while detained and upon release to lower risk for pretrial readmission. Unfortunately, we were not able to obtain other individual-level risk and protective factors that can be the focus of intervention strategies. For example, readmission risk may also be higher among those who have mental health issues, lower levels of education and vocational skills, and less work experience (Adler, 1992; Ditton, 1999; Hagan, 1993; James & Glaze, 2006; Nelson, Deess, & Allen, 1999; Sampson & Laub, 1993; Sullivan, 1989; Teplin, Abram, & McClelland, 1994; Western, Kling, & Weiman, 2001; Wilson, Draine, Hadley Metraux, & Evans, 2011). Future research that examines the effect of these factors on readmission can inform discharge plans to prevent the collateral consequences of detention and to develop relevant programs to reduce the risk of readmission.
Crime type at the reference admission also predicted readmission counts. A weapons charge predicted the lowest readmission counts in both felony and misdemeanor models. On the contrary, property crime and substance sale predicted the highest readmission counts. Given that both these crime types have a financial motive, the inability to pay bail might be an underlying driver of pretrial admission as well as readmissions. Using the same database, our post hoc exploratory analysis on bail amount supports this possibility. Even though median bail amount imposed for property crime ($1,500) was much lower than the median amount for person crime ($2,500), the proportion of individuals who were released because they paid bail was substantially lower for property crime (37.6%) than for person crime (49.4%). Moreover, among individuals whose bail set was relatively low ($2,000 or less), the proportion individuals who were released because they paid bail was lower among property crime (43.6%) than person crimes (59.1%). This suggests that individuals admitted for property crimes are more likely to have economic hardship which would reduce their chance of being released on bail. Moreover, the effect of pretrial detention for these individuals may have lasting effect which hinders future employment and other financial opportunities and may lead to continual engagement in financially motivated crimes. Future research should further unpack this complex relationship.
Prior research supports the notion that person-related crimes are less likely to result in recidivism (Durose et al., 2014; Langan & Levin, 2002). However, another possible explanation for the lower readmission counts of individuals admitted for person-related crimes is that these individuals have a higher probability of a prison sentence and a lengthier incarceration time. This leads to a lower “at-risk” street time relative to other charges which might impact our outcome of interest. Our post hoc exploratory analyses suggested that the probability of receiving a prison sentence did not differ for individuals admitted for person crimes compared with individuals admitted for property or substance crimes. However, according to a report on the New York State prison population, the average and median minimum sentence length was the longest for those who were convicted of violent felony crimes (New York State Department of Correctional Services, 2007). Our data are limited by our inability to account for the actual exposure time for each individual during the 10-year follow-up. Future research should account for the actual sentence length to control for the exposure time in the model, especially given that the sentence length can vary by the severity of crime and criminal history of individual defendants.
Accounting for the actual prison sentence length in the future analysis will also deepen our understanding on the effect of discharge type on readmission counts. Our study found the lowest predicted readmission counts for those who were transferred to prison. This is not a surprising finding given that those who were incarcerated in prison for an extended period of time will have shorter time “at-risk” for readmission relative to others. Except for prison transfer, bail paid predicted significantly lower readmission counts than other discharge types in both misdemeanor and felony models. This suggests that those who frequently utilize local correctional facilities are the ones who are less likely to make bail. Given their inability to pay bail, these individuals may be more likely to plead guilty for the reference admission, and are more likely to plead guilty in subsequent admissions (Heaton et al., 2017; Lowenkamp et al., 2013).
As discussed above, the mechanisms influencing pretrial readmissions are multifaceted. We were able to examine one piece of this complex system with jail data. Still, our study has implications as it extends the current knowledge of readmission of the pretrial population, an unexplored topic in criminology and criminal justice. Our study results were somewhat consistent with studies examining recidivism such as rearrest and reconviction. Nonetheless, pretrial readmission should be distinguished from recidivism because of the unique nature of the legal status (unconvicted) and the role of bail. Future studies on jail readmission with more comprehensive data including criminal histories, individual risk and protective factors, and sentence length should examine the mechanisms of pretrial readmissions especially financial components which may play a crucial role here.
The current study has several implications with regard to criminal justice policy. Our results suggest that the probability of readmission for unconvicted individuals is high and this is particularly true for those admitted for misdemeanors. Given that these are nonviolent lower level crimes, it is worth calculating the personal, public safety, and fiscal costs for detaining these individuals pretrial. Furthermore, policymakers and research should explore the various opportunities that exist for diversion, substance abuse treatment, and other alternatives to incarceration for lower level charges. Such programs may decrease the likelihood of rearrest and/or readmission. As jurisdictions begin examining the cost-effectiveness of jails, future work can also utilize this research as a starting point for examining other core issues involving pretrial detention such as employment, and weigh jail admissions and their impact on individuals and communities as a whole.
Footnotes
Acknowledgements
We would like to thank the Laura and John Arnold Foundation for funding this work as well as for funding the Misdemeanor Justice Project (MJP), particularly to Virginia Bersch for her ongoing support of MJP. We are especially grateful to the New York City Department of Correction for providing us with the data. A special thanks to Anna Marzullo, Alex Foard, Eric Sorenson (formerly with DOC), Diane Firstman, and Karen Eggleson for their valuable feedback and comments on our analyses. We would also like to thank Victoria Lawson and Kevin Wolff for comments on earlier version of this manuscript.
Declaration of Conflicting Interests
The author(s) declared no potential conflicts of interest with respect to the research, authorship, and/or publication of this article.
Funding
The author(s) disclosed receipt of the following financial support for the research, authorship, and/or publication of this article: This paper was commissioned by the Misdemeanor Justice Project—Phase II funded by the Laura and John Arnold Foundation. Points of view or opinions contained within this document are those of the author and/or the participants and do not necessarily represent the official position or policies of the Laura and John Arnold Foundation and the Misdemeanor Justice Project.