
Abstract
Most use-of-force policies utilized by U.S. police agencies make fundamental ordinal assumptions about officers’ force responses to subject resistance. These policies consist of varying levels of force and resistance along an ordinally ranked continuum of severity. We empirically tested the ordinal assumptions that are ubiquitous to police use-of-force continua within the United States using 1 year’s use-of-force data from a municipal police department. Applying a quantitative technique known as categorical regression with optimal scaling, we found the assumptions of ordinality within the studied department’s use-of-force continuum (which is similar to many police use-of-force continua within the United States) are not met. Specifying physical force as a “lower” force option than less-lethal tools is associated with increased officer injury and decreased subject injury. Our findings call into question use-of-force continua featuring ordinal rankings for varying categories of less-lethal force.
Most police agencies utilize a force continuum within their use-of-force policies, but the exact configuration of these continua varies considerably (Terrill & Paoline, 2012b). Use-of-force continua are meant to provide officers with guidance on how to take progressively forceful action (e.g., officer presence, issuance of verbal commands, use of physical force, batons, pepper spray, taser, firearms) based on subject resistance. These continua are used by police departments to specify the highest level of force allowed for a given level of a subject’s resistance (Crawford & Burns, 1998; Garner et al., 1995). Although the scenarios and actions they are intended to address are undeniably complex, these guidelines are often presented as if they are explicitly ordinal scales (Terrill, 2005, p. 110 emphasis added): “Thus, a standard force continuum ordinally ranks varying levels of force and resistance along a continuum in terms of severity, with the explicit purpose of offering guidance on how to respond to specific forms of resistance.”
The extreme ends of force continuums—officer presence and deadly force—are universally agreed upon. However, while officer presence and verbal commands are “lower” levels of force available to officers than discharging a firearm, there is no agreed-upon placement of less-lethal forms of force available to the police—namely physical force, pepper spray, conducted energy devices (CEDs), and batons—within a force continuum (Terrill & Paoline, 2012b). Individuals (practitioners and researchers alike) disagree regarding whether striking someone on the head with a closed fist is a more severe form of force than striking someone on the leg with a baton. There is also disagreement regarding where to place pepper spray and CEDs on a force continuum, thereby removing the need for the actual use of physical force. These are crucial, reality-based assessments faced by line officers and their administrators, and ones that frequently arise because many law enforcement agencies’ force continua situate physical force “below” these less-lethal compliance tools.
Our study aims to test the fit of ordinal use-of-force continua in the context of actual police use-of-force. Conceptually, a use-of-force policy represents a theoretical model of using force, and it makes sense to compare theoretical expectations with reality. Using an administrative data set providing comprehensive coverage from a single agency, we provide empirical evidence strongly suggesting that most forms of less-lethal force are conceptually very similar, and those use-of-force continua that place less-lethal force on an ordinal scale are based on questionable logic. Moreover, while police use of physical force is associated with fewer injuries to subjects compared with the use of other less-lethal types of force, physical force corresponds with increased injuries to officers. This presents the following question: How should law enforcement agencies (as well as society) balance the risks to officers or subjects when less-lethal force is used? This question is, in part, answered by use-of-force policies.
The Legal-Policy Dichotomy
The police are the state’s primary agent of coercive force, and the police are often called because someone observing some event believes that coercive force may be necessary to resolve a problematic situation (Bittner, 1970; Herbert, 2006). Officers are trained and expected to use the amount of force reasonably required to arrest individuals based on the prevailing circumstances. The use of sanctioned violence by the State against its citizens is in accordance with society’s acceptance of the social contract: People relinquish their individual right of reparation in exchange for the State’s undertaking of that responsibility (Rousseau, 1762/1968). The State enacts laws to avoid a state of nature in which society would live in “continual fear and danger of violent death, and the life of man, solitary, poor, nasty, brutish, and short” (Hobbes, 1651/2012, p. 102). To ensure that laws are abided by, the State delegates enforcement responsibility to agents with limited powers (i.e., police officers). However, to protect citizens from excessive government actions, such as excessive police use-of-force, accountability mechanisms are both necessary and ubiquitous (Shane & Swenson, 2019).
The two primary accountability mechanisms employed to deter excessive police use-of-force are the redress of grievances through the legal system and police department use-of-force policies. The most important legal consideration for police officers charged with using force is the U.S. Supreme Court case Graham v. Connor (Graham v. Connor, 490 U.S. 386, 1989). The Graham doctrine provides a professional and legal understanding of reasonableness viewed as an objective evaluation of the totality of prevailing circumstances. Under the Graham scaffolding, the putatively objective evaluation is “. . . based solely on the objective circumstances of the event and the conclusion that would be drawn by any ‘reasonable officer at the scene’” (International Association of Chiefs of Police [IACP], 2006, p. 2).
Graham (Graham v. Connor, 490 U.S. 386, 1989) provides a general framework for the legal system to evaluate whether an officer’s actions are “objectively reasonable” based on the circumstances confronting an officer, not the officer’s subjective intent or motive. More precisely, the legal question is as follows: Given the totality of the objective circumstances presented to the officer at the scene, would a reasonable officer take the same actions (Shane & Swenson, 2019)?
The formulation of the reasonable officer standard, however, has remained problematic on several fronts from Graham’s very inception (Alpert & Smith, 1994; Terrill & Paoline, 2012b). The definitional ambiguity of what a “reasonable officer” is, and the quite often-experienced differences between what is deemed reasonable by police and what is deemed reasonable by the community, are two of the issues often pointed to when discussing the reasonable officer standard promulgated by contemporary American jurisprudence (Mourtgos & Adams, 2020). In response to both articulated public concerns and to mitigate civil liability, police departments have developed use-of-force policies to administratively guide their officers on what force (i.e., tactics and weapons) can be used under specified circumstances. Indeed, law enforcement agencies desiring national accreditation from the Commission on Accreditation for Law Enforcement Agencies (CALEA), or that follow the guidelines of the IACP, must have well-formulated use-of-force policies that clearly govern use of deadly force, use of less-lethal force, rendering medical aid subsequent to force being used, training and proficiency with authorized weapons, and reporting and review of use-of-force incidents (McEwen, 1997).
While police departments’ use-of-force policies invariably incorporate prevailing legal standards (i.e., the Graham doctrine), they are often more restrictive than legal standards require (Shane & Swenson, 2019). Moreover, these policies are often much more specific and detailed than what is found in case law surrounding police use-of-force adjudication. Often departmental use-of-force policies address the specifics of how force is to be used (e.g., how long an officer can allow a CED cycle to continue), whereas case law generally confronts the issues more abstractly (i.e., the “reasonableness” of the situation). As such, while legal standards addressing police use-of-force are crucial for officers to understand and attempt to follow, their own department’s use-of-force policy is what generally guides their application of force.
Use-of-Force Continua
As noted above, most law enforcement and corrections agencies within the United States utilize a use-of-force continuum within their use-of-force policy. Force continua are guidelines that inform officers which type of force they are authorized to use based on the level of subject resistance experienced in an encounter (Terrill & Paoline, 2012b). That is, “[f]orce continua include varying levels of resistance and force arranged along an ordinal scale in terms of the potential severity of harm it presents to the other person” (Terrill et al., 2003, p. 154). Thus, a use-of-force continuum implies a proportional and incremental response as resistance increases (Terrill, 2005).
The above explanation may leave those who are not familiar with use-of-force continua unclear with precisely what is meant by “proportional” and “incremental” responses to varying levels of resistance. To answer this question, we draw primarily from a comprehensive study conducted by Terrill and Paoline (2012b) examining use-of-force policies developed by U.S. law enforcement agencies. Their study employs responses from a National Institute of Justice–funded survey examining a wide range of police use-of-force issues. The sampling frame criteria in Terrill and Paoline’s study ensured that police agency selection included more than 90% of all full-time sworn officers in the United States. While the generalizability of their results most accurately reflects mid- to large-size police agencies (50–749 officers and >750 officers, respectively), sufficient responses were obtained from small-scale police agencies (10–49 officers) to permit broad generalization to U.S. law enforcement. Terrill and Paoline’s study should be referred to for additional details on the survey methodology.
Subject Resistance
We first examine the matter of the ordinal ranking of subject resistance. Recall that in a force continuum, the level of resistance experienced by officers is what determines the type(s) of force they are authorized to use. Table 1 provides the two most common progressions of subject resistance found in Terrill and Paoline’s (2012b) study.
Progression of Subject Resistance.
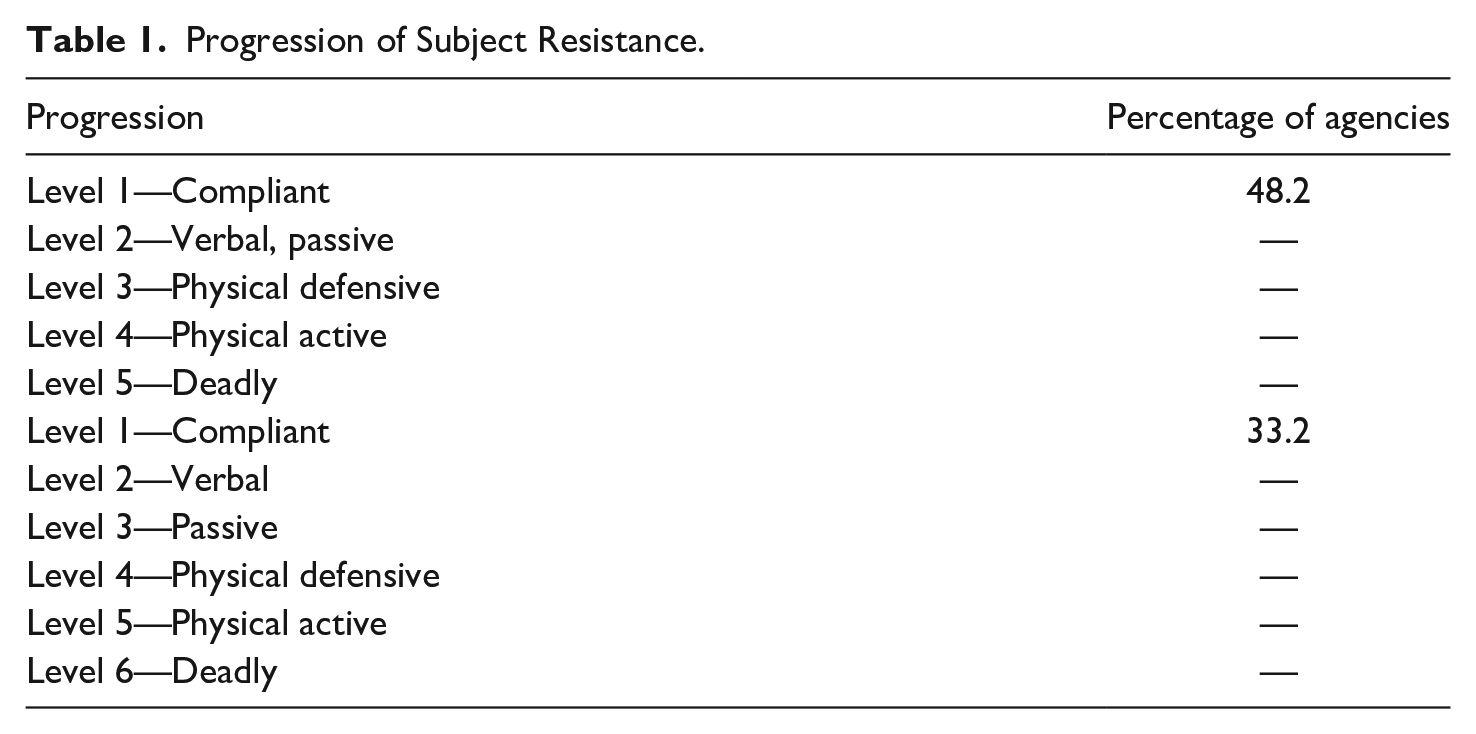
As can be seen in Table 1, 81.4% of agencies were identified as using one of the two outlined progressions of subject resistance. The difference between the two sequences is that the most frequently used progression combines verbal and passive resistance into one level, where the second most frequently used progression separates verbal and passive resistance.
Whereas compliant behavior and deadly resistance are self-explanatory, the other types of resistance require some clarification. Verbal resistance can consist of either verbal rebuts to commands or verbal threats toward officers. Passive resistance consists of noncompliance with an officer’s commands without any form of active or violent resistance (e.g., failing to place one’s hands in the air, but not taking any other actions). Defensive resistance includes actions such as running from officers or struggling to keep one’s arms from being placed behind the back for handcuffing. Active resistance consists of assaultive actions such as kicking, punching, or otherwise using force against an officer.
With the establishment of the two most common ordinal rankings of subject resistance, we examine the ordinal rankings of officer force options. This ordinal ranking of different force options, as will be seen, lacks the clarity found in the widespread agreement in the ranking of resistance levels.
Progression of Force
Table 2 provides the four most common permutations of force progression found in Terrill and Paoline’s (2012b) study. There is much less agreement among agencies with the ordinal ranking of different types of force than was the case with levels of subject resistance.
Progression of Force.
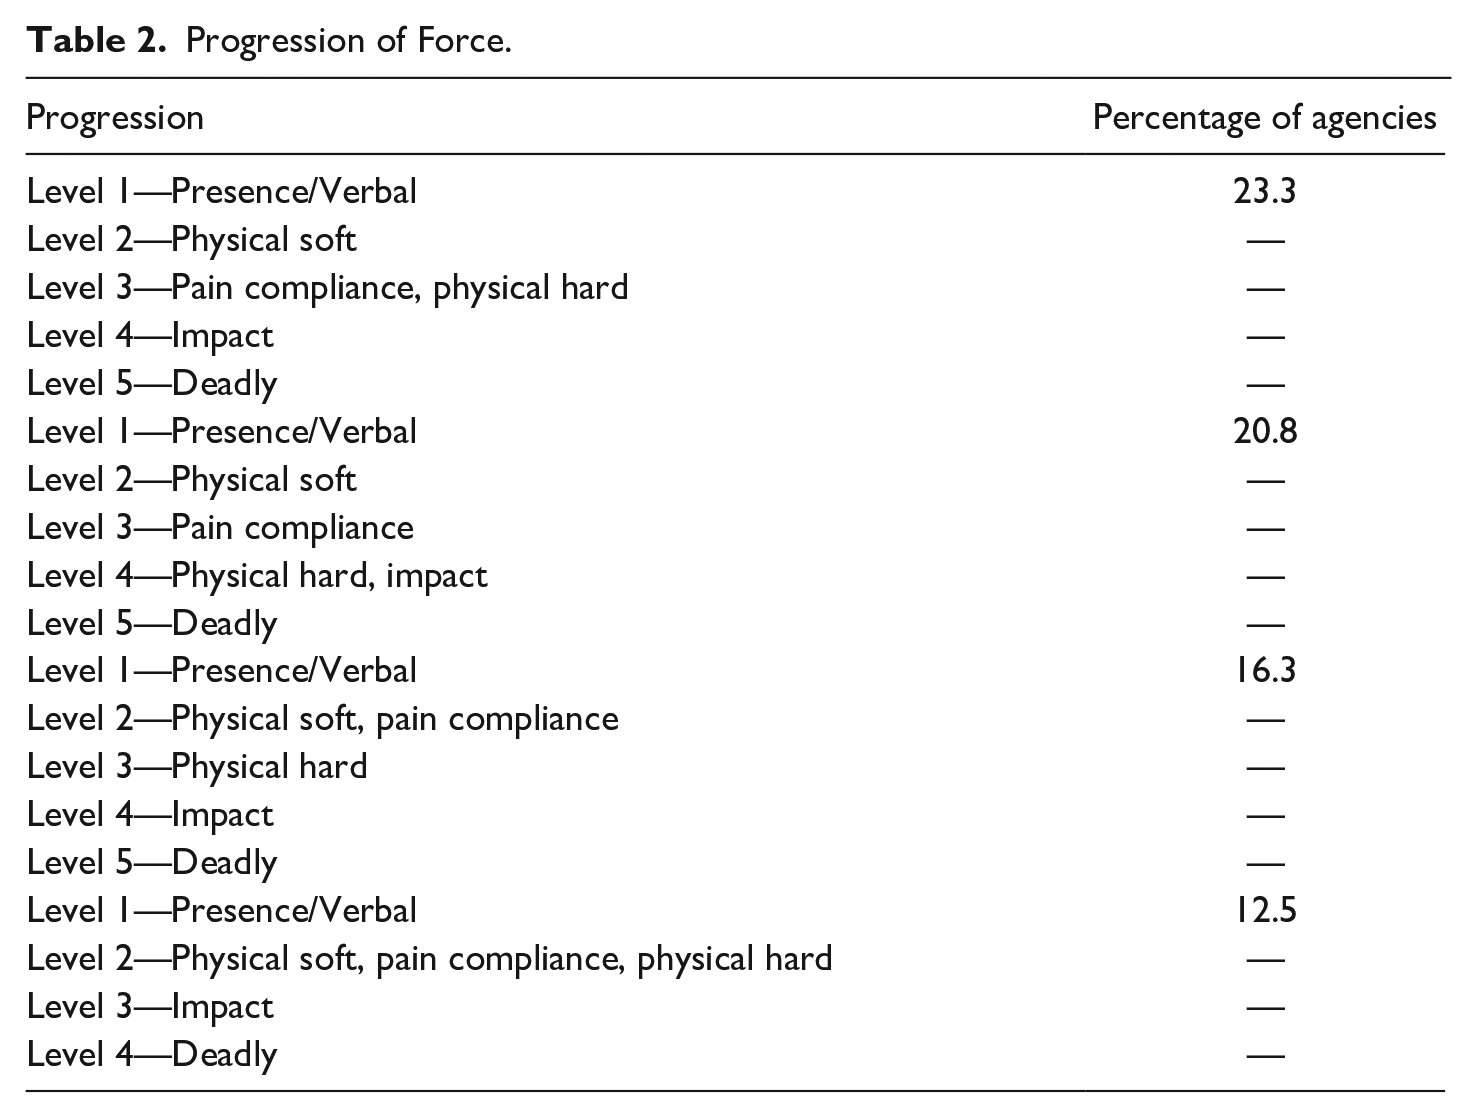
Much like with levels of resistance, some explanation of force category terminology is beneficial. While “presence/verbal” and “deadly force” is self-explanatory, the other categories are both less intuitive and less uniform in placement. “Physical soft” can encompass grabbing, pushing, escort holds, and stabilization techniques; “physical hard” typically refers to punches, kicks, and knee and elbow strikes; “pain compliance” often refers to pressure point manipulations but may also include use of pepper spray and CED application in “stun” mode where prongs are not used; and “impact tools” (i.e., batons).
Regarding category placement, some agencies comingle physical force with impact tools. While some place physical force before impact tools, others distinguish pain compliance from physical force and arrange the options in various ways between different levels of physical force. To further complicate the picture, as outlined by Terrill and Paoline (2012b), there is no standard agreement on where less-lethal tools fall in the above force categories. They found that approximately 30% of agencies place pepper spray in the pain compliance category, another 29.2% in the physical hard category, and 35.3% in the impact weapons category. Furthermore, approximately 60% of agencies place CEDs in the impact tools category, 24.6% in one of the physical force categories, 13.1% in the pain compliance category, and 2% in the deadly force category (p. 48).
Terrill and Paoline (2012b) convincingly demonstrate a lack of consensus among U.S. agencies regarding where less-lethal force should be placed in a force progression. The impact of this finding is better appreciated when combining the progression of subject resistance and type of force into a force continuum.
Ordinal Force Continua
Using the national survey of law enforcement agencies within the United States, Terrill and Paoline (2012) established that a vast majority of police departments utilize linear force continuum designs (73.4%), followed by a matrix/box method (10.1%) and a circle/wheel-shaped approach (9.3%). A linear design is modeled in the form of hierarchical steps, and explicitly reinforces the idea of an ordinal ranking with linear progression. A linear continuum approach relies “first on the officer’s presence to quell a situation, and if that fails, to move to increasingly severe types of force” (McEwen, 1997, p. 49).
The decision matrix and wheel approaches instruct officers not to assume linear progression (Terrill & Paoline, 2012b). While each available option should be considered, when possible, the circumstances, situational variables, and subject’s actions may, in part or whole, dictate an officer’s immediate use of the highest option prescribed for a given level of resistance. For example, if an officer arrives at the scene of a shooting-in-progress, they are not required to attempt less-lethal means of force (e.g., pepper spray, baton, CEDs) before applying deadly force to prevent further serious injury or death. Even those agencies that use a linear force continuum design include these instructions. On this point, Terrill and Paoline found that departments that utilize a linear continuum design include an “out-clause” (p. 52) to allow for officers to match the force used with the resistance being experienced or observed, rather than a requirement to progress sequentially through each step of the force hierarchy. Regardless of the “shape” (i.e., linear, matrix, wheel) of the continuum, all continua provide ordinally ranked force options ranked by severity. This is the “incremental” aspect of force continuums described by Terrill (2005).
Table 3 presents a simplified version of a force continuum, where a given level of force is authorized at a given level of subject resistance. In this example, for a compliant individual, an officer’s presence and verbal communication is the authorized level of force. Alternatively, in the situation where an individual is passively resisting, soft physical force is authorized. Each level of increase in resistance increases the level of permissible force (as conceptualized in this continuum). This is the “proportional” aspect of a force continuum to which Terrill (2005) refers.
Force Continuum Sample.

The progression of subject resistance and progression of police force in Table 3 follows the most widely used ordinal rankings found in Terrill and Paoline’s (2012b) study. However, note that they observed 123 different permutations of force progression, ranging from three to nine different levels, and they further observed 23 different permutations of subject resistance progression, ranging from three to seven different levels. This complexity reinforces the perception that little agreement exists among U.S. police agencies about which types of less-lethal force are more severe than others, nonetheless adopting the ordinal assumptions associated with a continuum.
While Terrill and Paoline (2012b) found much consistency across American police agencies in the area of subject resistance progressions, they found little consistency in the ordinal ranking of force progression. Poor conceptualization of the various elements of force leads to unending questions for officers, administrators, legal scholars, and researchers alike. Is striking someone in the head with a closed fist less or more severe than hitting them in the leg or arm with a baton? Or is it possibly the same level of severity? Is applying pepper spray to a subject more or less severe than applying a CED? Are they also possibly the same with respect to severity? Which of the options are more likely to cause injury to subjects, and which results in more extended periods of pain? Are these outcomes even the right metrics by which to rank force categories?
In the conventional ordinal frame, there are no clear answers to the above pertinent questions. Ordinal variables require an explicit ordering of the available categories, and with the 123 different permutations of force progression found across the United States by Terrill and Paoline (2012b), this ordinality assumption may be questioned. Perhaps some of these less-lethal options, and the differences between them (if any), should be characterized as nominal rather than ordinal.
In fact, proposed methods of evaluating the reasonableness of a given use-of-force incident are based mainly on ordinal assumptions, with researchers quantifying a mathematical difference score between the ordinally ranked resistance levels and force levels found in force continua to evaluate the proportionality of a particular force incident (Alpert & Dunham, 1999, 2004; Alpert & Smith, 1994; Bazley et al., 2007; Garner et al., 1995; Hickman et al., 2015; Hine et al., 2018). This particular method is referred to as the “force factor” (Alpert & Dunham, 2004). While utilization of the force factor has shown promise and proven beneficial to police agencies and researchers alike (Hickman et al., 2015), its measure is derived by explicitly arranging types of force and levels of resistance along an ordinal scale (Bazley et al., 2007). That is, much like use-of-force continua, the method assumes “a clear and uncontested assignment of actions” to ordinal severity levels (Celestin & Kruschke, 2019, p. 291). We submit this assumption to empirical testing and investigate the ordinal ranking of less-lethal force categories. We accomplish this by submitting the model of force continua to categorical regression with optimal scaling (CROS) analysis, described in some detail below. Briefly stated, this type of statistical analysis allows us to place various force options that are plausibly nominal variables on a hypothesized interval scale. By doing so, we can test for statistical differentiation between and among force categories. These empirical results will allow us to address the conceptual ambiguity noted above with respect to use-of-force ordinality.
Research Proposition and Hypotheses
From the literature reviewed above, we are able to derive one testable research proposition and two hypotheses. The research proposition pertains to assumptions of ordinality in use-of-force continua. The two hypotheses pertain to the use-of-force continua viewed as policy tools employed to reduce injuries to subjects of arrest and police officers. Based upon the findings of Terrill and Paoline (2012b), and our conceptual reasoning outlined above, we propose that less-lethal options are not true ordinal variables, and are more appropriately considered nominal categories. The existence of widespread variation in force progressions across the United States demands that greater clarity be brought to this area of policing (Thomas et al., 2010). The research proposition in question is as follows: Research proposition: Less-lethal force continua are better framed as having nominal properties rather than ordinal properties.
We test this proposition and follow with two testable hypotheses to assess the practical utility of the initial guidance from the research proposition. To that end, we examine whether different types of less-lethal force result in more or fewer injuries to officers and subjects. Some research finds that the use of physical force results in an increased propensity for injury to both officers and subjects (Stroshine & Brandl, 2019). Other research conducted across several police agencies finds that use of CEDs and batons results in suspect injury as often as physical force, and the occurrence of injury to officers using a baton is similar to the use of physical force. However, once other factors are controlled for (i.e., subject race, sex, age), only use of pepper spray and physical force reduces subject injury at statistically significant levels. In contrast, use of CEDs, pepper spray, and physical force reduces officer injury at statistically significant levels (Taylor et al., 2009). Additional research finds that use of CEDs increases the risk for subject injuries (Terrill & Paoline, 2012a).
Different definitions of injury can largely explain these mixed findings. For example, in some agencies, when a subject experiences pepper spray, the resulting irritation and temporary pain is the documented injury. Similarly, the successful application of a CED almost always results in either small probe lacerations or burn marks. While some argue against classifying these outcomes as an injury, others advocate for their inclusion (Terrill & Paoline, 2012a). The studied department requires documentation of an “injury” whenever an action is taken that results in, or is alleged to have resulted in, injury. This includes a complaint of injury by a subject, excluding minor discomfort resulting from the application and general wearing of handcuffs. Accordingly, probe lacerations or burn marks resulting from CED use counts as an injury within the present analysis. In addition, the pain and irritation resulting from application of pepper spray is also considered to be an injury. Whether one classifies these outcomes as a legitimate “injury” or not affects the interpretation of our results and should be kept in mind. However, this limitation is not disqualifying for this study, as our aims were not to model the phenomenon of injury generally, but rather examine whether the main focus of study (the question of ordinal force rankings) has practical utility.
Recall that the reasoning underpinning ordinal force continua is for proportional and incremental responses to increases in resistance (Terrill, 2005). However, if less-lethal force options do not consist of a true underlying ordinal structure, and certain force options cause more or less injury in a manner that is out of sync with how a given force continuum is conceptualized, then there exists good reason to question the ordinal ranking of less-lethal force categories within a use-of-force continuum. For example, physical force is consistently placed below other nonlethal categories of force (Alpert & Smith, 1994; Terrill, 2005), yet the use of physical force has, at times, been shown to result in injury more often than other nonlethal categories (Stroshine & Brandl, 2019; Taylor et al., 2009). This underlying tension between goals and outcomes prompts two related hypotheses:
Data
The data for this study were obtained from a municipal police department in the United States. The agency provides full-spectrum policing services to an estimated 200,000 residents living in a mixed urban core and suburban service area environment. The department employs approximately 600 sworn officers.
Officers at the studied department are required to report every instance where force is used, regardless of whether injury occurred or not. Use-of-force is defined by agency policy as “the application of physical techniques or tactics, chemical agents, or weapons to another person. It is not a use-of-force when a person allows him/herself to be searched, escorted, handcuffed or restrained.” 1 Furthermore, any time an officer “draws a firearm and acquires a target (i.e., person),” (meaning the firearm is pointed directly at an individual rather than being unholstered or held at the low ready) it is considered a use-of-force incident.
Officers enter the details of their use-of-force incidents into the agency’s electronic use-of-force management system. The information officers are required to enter into the management system includes (a) the type of force used; (b) the type of resistance experienced (i.e., compliant, passive resistance, defensive resistance, active aggression); (c) race of subject; (d) sex of subject; (e) subject injury; and (f) officer injury. Upon submittal of a use-of-force report, the report is reviewed and approved by a sergeant. Furthermore, if a subject is injured during the use-of-force incident, the sergeant is required to examine the accompanying body-worn camera footage.
In 2018, there were a total of 720 incidents that involved use-of-force as defined. Four of those incidents included the use of deadly force, which were excluded from this study as our purpose was to examine the ordinal nature of less-lethal force. With those four cases excluded, 716 use-of-force incidents are included in the study.
Variables
The two primary variables of interest in this study are the type of less-lethal force used by officers and the degree of resistance provided by subjects. Both variables are central to this study because we are attempting to ascertain if the type of less-lethal force used by officers is arranged in a statistically ordinal manner based on the force continuum used by the department in question. The types of less-lethal force authorized for use by officers at the studied department include pointing a firearm at a person, physical force, pepper spray, baton, CEDs, and discharging a firearm. Following past research designs, only the most serious type of use-of-force and level of subject resistance reported by an officer in a given incident were used in the analyses of these data (Alpert & Dunham, 1997, 1999; Bazley et al., 2007, 2009; Garner et al., 1995; Garner & Maxwell, 1999). Like this past research, it was not uncommon to find physical force used in conjunction with another less-lethal weapon. While theoretically possible for officers to employ multiple types of less-lethal weapons in the same incident (e.g., baton and CEDs), we did not note any such occurrences within our data set. The most serious type of force used within an incident was decided by using the studied department’s ranking in their force continuum (described below). Accordingly, if only physical force was used during an encounter, physical force was used in the analysis. If a CED was deployed, and physical force was also used, the CED deployment was used in the analysis.
Similar to most U.S. police departments, the studied department utilizes a force continuum. The department’s ordinal rankings of corresponding force and degrees of resistance are reported in Table 4. 2
Force Continuum From Studied Department.

Recall that departments vary across the country with what types of force they place in force categories (i.e., locating pepper spray in the pain compliance category vs. the impact weapons category). At the studied department, a physical, soft category includes pushing, grabbing, pressure points, immobilization techniques, and escort techniques. A physical, hard/pain compliance category includes punches, kicks, knee/elbow strikes, and takedowns. Finally, an intermediate weapons category includes baton, pepper spray, and CEDs.
Similar to three of the four most common permutations of force progression found in Terrill and Paoline’s (2012b) study, the studied department ordinally ranks both types of physical force below intermediate weapons. This is an important consideration, as the department’s use-of-force management system only offers “physical force” as a reporting category, rather than dividing reporting options into physical, soft and physical, hard. While this limits our ability to examine the ordinal ranking of the two types of physical force, we can still analyze if physical force generally has an ordinal relationship with all other types of less-lethal force.
The types of resistance officers can report in the use-of-force management system include compliant, psychological intimidation, verbal threats, passive resistance, defensive resistance, and active aggression. While providing officers the option of reporting “psychological intimidation” and “verbal threats,” the studied department categorizes both resistance types within their force continuum as passive resistance. As such, psychological intimidation, verbal threats, and passive resistance were all collapsed into one variable of passive resistance.
It is not uncommon to find resistance level information missing from officers’ reports when conducting use-of-force research. Of the 716 use-of-force instances reported during the study period, 26 entries (4%) had missing information on subject resistance. This is well below the percentages found in other related research (Bazley et al., 2007). As such, our total sample was reduced to 690 occurrences. Table 5 provides the descriptive statistics for the type of force used, resistance level experienced, and injuries to both officers and subjects. Table 6 provides a cross-tabulated view of what types of force were used in response to different levels of resistance. 3 Note that the majority (72.5%) of force used within our sample is categorized as physical force, confirming previous research that physical force is the category of force most often used by police (Stroshine & Brandl, 2019; Torres, 2018). This finding further reinforces the theoretical contribution of investigating the empirical ordinality of police use-of-force. Moreover, the large discrepancy of physical force over less-lethal tools suggests that officers within the studied department largely follow the agency’s use-of-force policy, where physical force is ranked below less-lethal tools. This is congruent with findings that officers are responsive to agency policy making (Mummolo, 2018).
Descriptive Statistics.
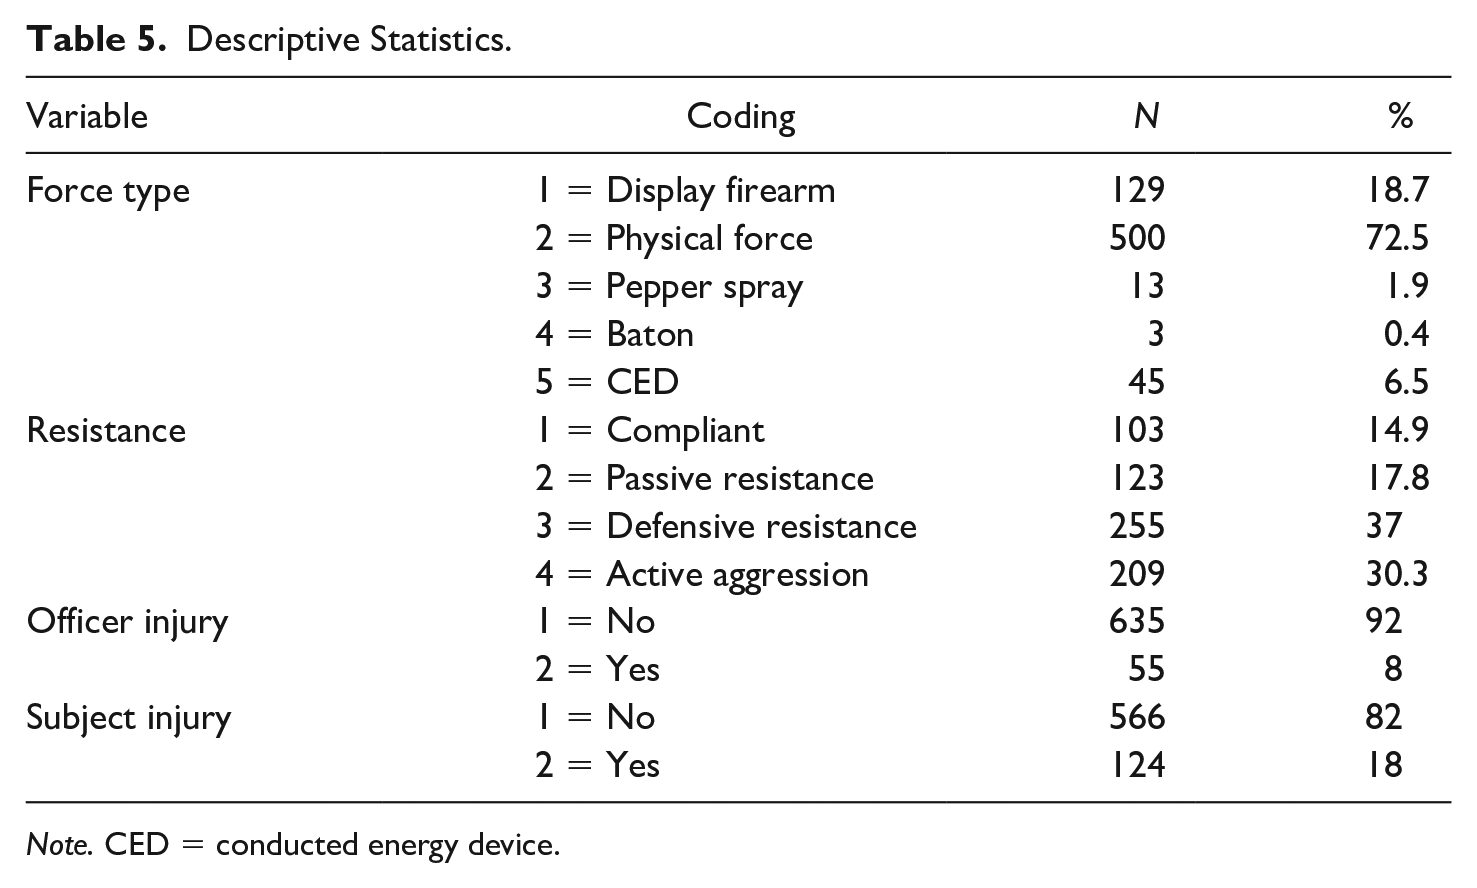
Note. CED = conducted energy device.
Cross-Tabulation of Force and Resistance.

Note. CED = conducted energy device.
One challenge that exists for this data set is the mismatch in size between use-of-force categories. Specifically, while there are 500 data points coded as physical force, there are only 13 data points coded as pepper spray, and even fewer for the use of a baton. While this does mean that the sampling error is larger with respect to the smaller categories (Pitard, 2019), it does not mean that conclusions cannot be drawn from the comparisons. This is primarily because the goal of this research is to study the entirety of the less-lethal use-of-force spectrum, and therefore, the smaller subsets must be interpreted in relation to the broader context of the continuum. As a result, any robust conclusions that are drawn from this data set must be applied to general use-of-force and not any one specific category of force operating in a vacuum. Moreover, we argue that it is vital to ensure that the data set reflects reality as closely as possible. Having a sample that approximates the correct proportion of the types of force used, even though some types of force are rare, takes precedent over having an equally balanced (and unrealistic) data set.
A final note about our core variables: Pointing a firearm at a person is considered a use-of-force by the studied department. However, pointing a firearm at a person is not explicitly ranked within their force continuum. Pointing a firearm at a person may be reasonably used across various resistance types, and pointing a firearm is considered good practice in situations where no actual subject resistance is offered. This reality is, perhaps, why pointing a firearm is not explicitly ranked within the force continuum. For example, across the United States, officers conduct “high hazard” traffic stops with their weapons drawn and pointed at subjects. This course of action is taken in situations such as pulling over an individual in a stolen vehicle, or where the occupants of a vehicle have been reported to have committed a crime with a firearm. The occupants may be fully compliant during the traffic stop but will still have firearms pointed at them until they are safely taken into custody. On the other end of the possible spectrum, an individual may be assaulting an officer or someone else (either physically or with a weapon) to the point where serious bodily injury or death may occur. In this instance, an officer may point a firearm at an individual to get them to stop the assaultive behavior.
While most less-lethal use-of-force research omits firearm pointing from analysis, pointing a firearm at an individual is considered a use-of-force by the studied department. As such, it is included in our analyses, and it allows us the opportunity to examine its location in the force continuum. Conceptually, we posit that pointing a firearm at a person lies toward the bottom of the less-lethal options in the force continuum because, while indeed intimidating, actual physical force is not used, and injury does not occur. Axiomatically, if a firearm was used (as it was 4 times during the study period), the incident was dropped from our analysis of physical and less-lethal force. We recognize that this conceptualization is not without controversy among use-of-force scholars. However, in this study, we must match agency policy to the study’s structure to test the underlying ordinality. We therefore deliberately sidestep debates on whether firearm display or pointing “counts” as a use-of-force—in the studied department, the policy framework assumes as much, and so a study of that policy must assume the same structure.
Analysis
CROS
Social science research relies on noninterval data. Observations are often quantified on “scales” with uncertain units of measurement; frequently, the zero points of the scales are unknown, and the ordering of scale categories is regularly assumed rather than verified (Meulman, 2015; Shrestha, 2009). This immediately poses a challenge from a mathematical perspective, as statistical manipulation of data must follow a basic principle of conservation of information; no model applied to create such ordinal scales can provide additional information without making constraining assumptions. CROS is a relatively recent advance in scaling statistics that attempts to address the above-mentioned concerns when working with categorical data. The method results in quantified categorical variables with interval scale values for each category of every variable, allowing them to be “optimized” with respect to the regression. That is, the method creates an estimation of parameter sets for each distinct class such that one coefficient is estimated for each category within a variable. This is an omnibus scaling method across variable types, and simultaneously scales nominal, ordinal, and numerical variables, treating quantified categorical variables in the same way as interval variables (McCormick et al., 2017; Shrestha, 2009).
The categorical regression process maximizes the squared correlation between the transformed dependent variable and the predictor variable(s). This method is a modified version of a traditional least-squares optimization strategy, creating conventional linear regression fit lines while providing a framework in which to give the nominal variable the best chance at being ordinal. In other words, CROS maximizes the correlation between the dependent variable and the weighted summation of the independent variables, with the resulting coefficient values assuming the best possible ordinal structure (Shrestha, 2009). As a result of this maximization process, interval scale values are assigned to each variable to account for as much variance as possible in the dependent variable. The interval scale values for each category of every variable are referred to as “quantification scores.” It is these quantification scores that are used in the linear regression analysis. Regardless of whether a variable is nominal or ordinal, categorical regression transforms the scores for each variable such that variables are measured on an interval scale and can be used in linear regression (McCormick et al., 2017).
It is important to note that the least-squares method that is used for optimization, in this case, is only one of a wide selection of strategies that can be used to optimize results. More formal mathematical structures focused on optimization are reliant on the use of ordinary differential equations (ODEs) or partial differential equations (PDEs), which would necessitate the a priori assignment of differentiable functions to curve fit the data before analysis (Chong & Zak, 2013; Granville et al., 1941; Rogawski, 2011). Regularly, these functions can be drawn from families of functions, such as the commonly used Bernstein polynomial basis (Farouki, 2012). While an ODE/PDE approach is more conventional, the structure of our data makes the least-squares approach the best method of limiting the number of assumptions that must be made.
In situations where the outcome variable is nominal, binary or multinomial logistic regression is generally recommended; when a dependent variable is ordinal, linear regression or logistic regression is typically used (McCormick et al., 2017). However, the ability to leave variables in their original categories and still employ them directly in linear regression without violating the assumptions for linear regression is promising for meaningful, easily interpretable results. Where analysis of data sets comprising nominal, ordinal, and numerical data is required, CROS may be preferred over general linear models because it allows both nominal and ordinal variables to be used directly in linear regression models (Adewale et al., 2019). Beyond the obvious benefit of being able to analyze data at any level of measurement, CROS also reduces multicollinearity and models nonlinear relationships. This is possible because categorical predictors receive a different score for each variable category rather than one coefficient for the variable as a whole (McCormick et al., 2017).
To date, there is limited to no published policing research employing CROS, but the method has been successfully used in studies related to business (Figini et al., 2010), environmental design (Adewale et al., 2019; Kwon et al., 2019), and health (Shrestha, 2009). Moreover, the concept of least-squares optimization has existed for centuries, being first defined by Gauss in the 18th century (Bretscher, 2012). This analytical technique holds promise for policing studies in which categorical variables (such as types of force) are prevalent, and scaling is uncertain, as in this study.
Results
Our analysis proceeds as follows. First, we regress the type of force used on the resistance level. This allows us to explore the ordinal conditions of less-lethal force types, thus providing statistical evidence of whether the studied department’s force continuum is genuinely based on an ordinal scale as intended, or is more consistent with nominal force categories, as posited in our research proposition. Second, we examine how each less-lethal force type affects injury rates for officers and subjects. Finally, we control for theoretically relevant variables in our original bivariate regression as a robustness check.
Force and resistance
We begin our analysis by regressing the type of force on the resistance level using the CROS method. In this analysis, based on the above discussion, the force variable is defined as a nominal scale, and the level of resistance is defined as an ordinal scale. Because at least one of our variables is coded as a nominal-level variable, we use a random initial configuration (McCormick et al., 2017). The regression is statistically significant, F(3, 686) = 578.61, p < .001. The R2 for the regression is .72, indicating subjects’ resistance levels account for a large portion of the variance in the type of force used; this is what one would expect if officers’ use-of-force is based on the level of resistance being experienced. This method transforms and standardizes the values of the variables, and so only beta coefficients are provided. The beta coefficient for level of resistance = .847. A thorough description of all regression model results is included in Table 7 below.
Regression Models.

Note. CED = conducted energy device.
Significance levels reported at *p ≤ .05. **p ≤ .01. ***p ≤ .001.
More interestingly for our purposes, we examine the transformed scores for the different types of force. Recall the transformed scores are the interval scale values assigned to each variable and take into account the relationship between the predictor and outcome variable. This allows us to scrutinize whether the different force types are indeed ordinal, as conceptualized within force continua. As seen in the top panel of Figure 1, some ordering is inherent in the force progression, but it is not ordinal in the manner outlined in the studied department’s force continuum, thus supporting our research proposition. To that point, pepper spray is lower on the interval scale than physical force, and there is a clear separation between baton and CEDs. If there were a true underlying ordinal ranking that aligned with the conceptualization of the department’s force aspect of the force continuum, physical force would be below pepper spray, and all intermediate weapons would be more similar than observed here. Furthermore, Figure 1 confirms our discussion that firearm display is at the bottom of the force type progression. The bottom panel in Figure 1 also demonstrates the department’s conceptualization of resistance levels is indeed ordinal.

Transformed Quantification Scores for Force and Resistance.
Injury
Having demonstrated that the force categories within the studied department’s force continuum are not ordinal as optimally conceptualized, an essential related inquiry is whether specific categories of force are associated with more or fewer injuries to officers and subjects. 4 If physical force, for example, (which is the lowest force option on the studied department’s force continuum but above pepper spray empirically) is associated with more injuries than the use of pepper spray when scrutinized statistically, then perhaps the studied police department should consider reevaluating their force continuum. 5
We examine this question by first regressing officer injuries on type of force and level of resistance with the same technique previously outlined. The regression is statistically significant, F(6, 683) = 6.999, p < .001. The left-hand panel of Figure 2 indicates that using physical force is associated with an increased likelihood of officer injury compared with pepper spray, baton, or firearm display. Keep in mind that this is the case after controlling for the level of subject resistance.
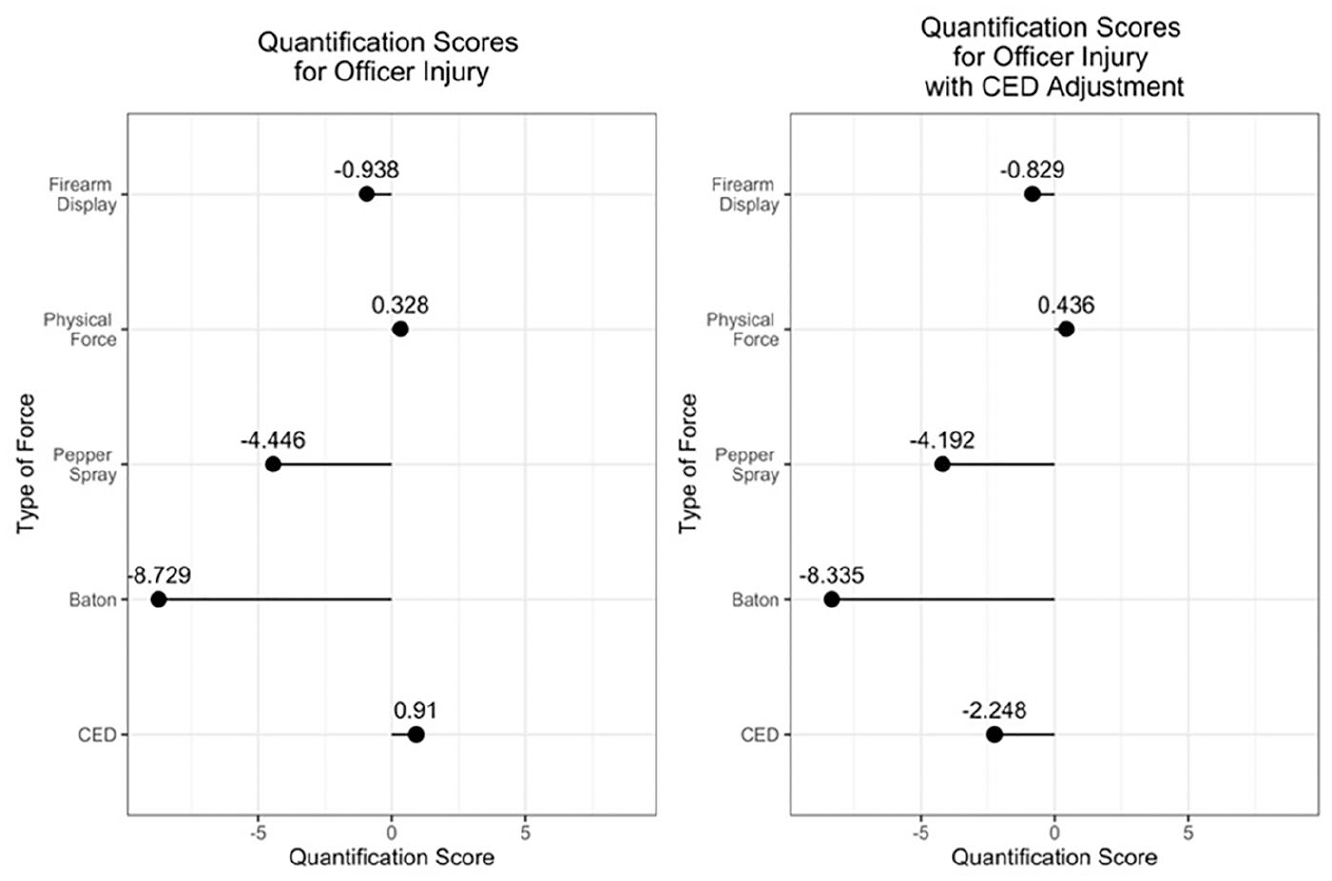
Quantification Scores for Officer Injury.
Curiously, CED use is the highest quantified injury score. This finding runs counter to expectations because CEDs are intended to reduce the need to engage with a resisting subject physically, and have been found in previous research to reduce officer injury (Paoline et al., 2012; Stroshine & Brandl, 2019; Womack et al., 2016). Due to this conceptual and empirical inconsistency, we examined closely the cases in which a CED was used. We found that in many instances of CED use, the devices were unsuccessful, resulting in an officer having to return to the use of physical force. It is at this point that injury typically occurred. We recoded these instances of unsuccessful CED use to physical force and reran the officer injury regression. Again, the regression was statistically significant, F(6, 683) = 7.089, p < .001. Moreover, once the CED inconsistency is accounted for, it is clear that physical force, when controlling for subject resistance, is much more likely than other less-lethal options to be associated with officer injury, thus supporting Hypothesis 1 (see the right-hand panel of Figure 2). 6 This finding is in line with previous research that found when CEDs are used alone, officer injuries decrease; when CEDs are used in combination with other types of force, the probability of officer injury increases (Paoline et al., 2012).
The association between type of force and officer injury may not parallel the association with subject injury. Moreover, officer injury is not the only outcome to which one should attend when considering use-of-force continua. To examine the likelihood of subject injury as a function of type of force, we regressed subject injury on type of force used and level of subject resistance. The regression was statistically significant, F(7, 682) = 17.400, p < .001. When quantification scores are transformed (Figure 3), we observe that subject injury is more likely when less-lethal tools are used in comparison with physical force, thus failing to support Hypothesis 2 (this remained true even when we ran the regression with the adjustment mentioned above for CED deployment).
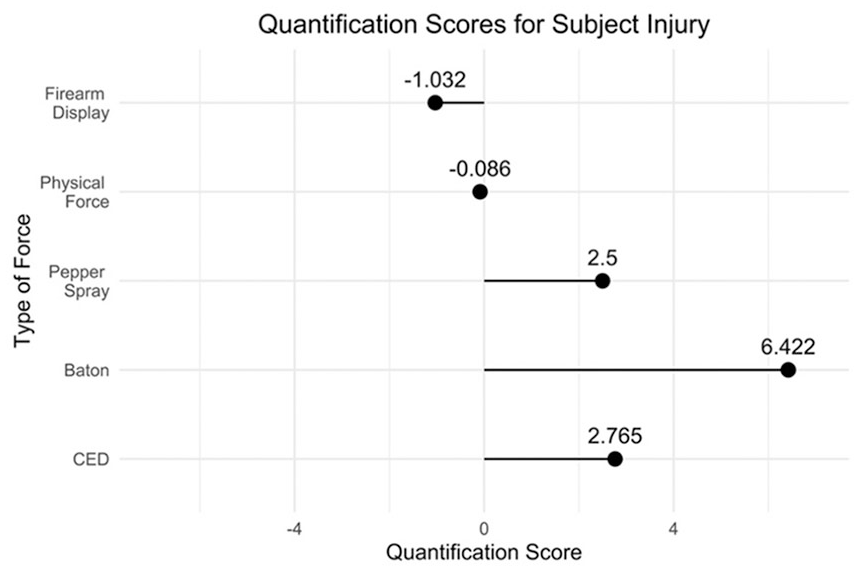
Quantification Scores for Subject Injury.
Robustness check
Finally, due to recurrent concerns about demographic factors influencing police use-of-force (Shjarback & Nix, 2019), we conduct a robustness check of the analysis by including subject race and sex as control variables into our original regression. Due to the nonreporting of sex and/or race information for 100 cases, our number of observations is reduced to 590. When these control variables are included, the regression remains statistically significant, F(11, 578) = 122.567, p < .001. Furthermore, the amount of variance explained in the dependent variable is not improved by including the control variables (R2 = .70). Finally, the ordering of force type severity remains largely the same, with the sole exception of the distance between baton and CEDs decreasing (see Figure 4).
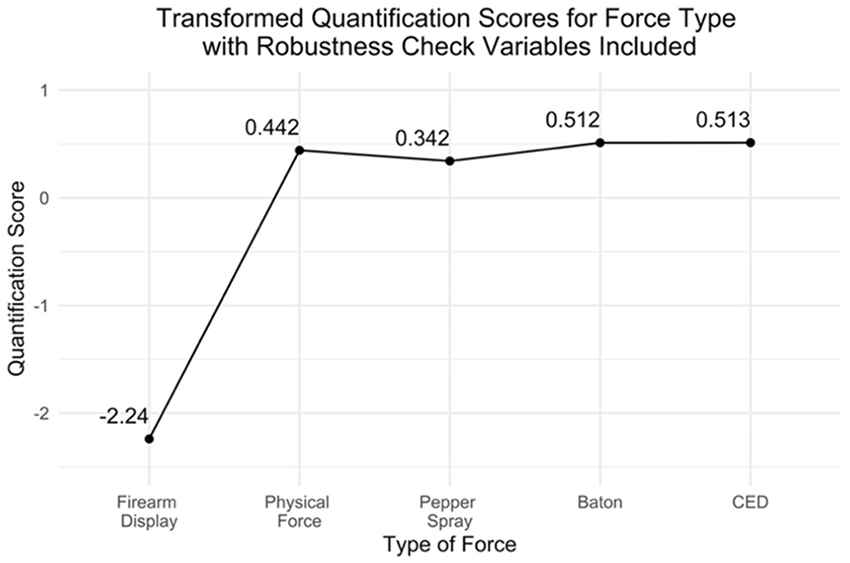
Robustness Check.
Conducting the same robustness check for the injury regressions, we find no substantive changes. All models (i.e., officer injuries and subject injuries) remain statistically significant, with quantification score direction and order unchanging. All regression model results are included in Table 7. 7
Discussion
The vast majority of police agencies utilize a force continuum within their use-of-force policies (Terrill & Paoline, 2012b). Use-of-force continua are meant to provide officers with policy guidance on utilizing progressively increasing categories of force based on subject resistance. “Thus, a standard force continuum ordinally ranks varying levels of force and resistance along a continuum in terms of severity, with the explicit purpose of offering guidance on how to respond to specific forms of resistance” (Terrill, 2005, p. 110).
Despite widespread use-of-force continua by law enforcement agencies, little research has been conducted on whether the empirical rankings of type of force used in the continua match the assumptions of ordinality. This gap is somewhat surprising as proposed methods of evaluating the reasonableness of a given use-of-force incident are based mainly on the ordinal assumptions within use-of-force continua (Alpert & Dunham, 1999, 2004; Alpert & Smith, 1994; Bazley et al., 2007; Garner et al., 1995; Hickman et al., 2015; Hine et al., 2018). Our analysis suggests that these ordinal assumptions are not met and that “in actuality [force continua] are ordered categories that do not contain information about the distance between levels of force nor about differences within categories” (Celestin & Kruschke, 2019, p. 291). If the conceptualized “rankings” of force within these continua are having adverse effects, essential policy questions arise. As discussed at the outset, no agreed-upon placement of less-lethal forms of force available to the police exists (Terrill & Paoline, 2012b). Our findings provide insight into the outcomes associated with less-lethal force and physical force and contribute to meaningful policy discussions within policing and the broader criminal justice discipline.
The analysis reported here complicates the assumptions of ordinal progression of less-lethal force found in many police agencies’ use-of-force continua. Our findings mirror recent evidence that lay people also do not well-distinguish between different types of less-lethal force (Celestin & Kruschke, 2019). As with three of the four most common permutations of force progression found in Terrill and Paoline’s (2012b) national study of use-of-force policies, the studied department ordinally ranks both types of physical force below intermediate weapons. Yet, when subjected to empirical examination, pepper spray scores below use of physical force, and dimensionally, very little separates the use of physical force, the use of a baton, and the use of CEDs. Based on the analysis, it may be prudent for agencies to consider authorization of the use of pepper spray before physical force in their use-of-force policies.
Police agencies, however, do not exclusively take into account the severity of force categories within their force continuums. Bound by the realities imposed by constitutional liberties and tort claim exposure, they must also consider the potential for injury resulting from the use of force by police. When examining the type of force used and its association with officer injuries, while controlling for subject resistance levels, the likelihood of officer injury is significantly reduced when less-lethal options other than physical force are employed. This finding is supported by prior research that also found that physical force is the category most likely to result in officer injury (Stroshine & Brandl, 2019).
However, the opposite outcome was found for subject injuries—the likelihood of injury increased with the use of less-lethal tools other than physical force. One must note, however, that for some types of less-lethal force, subject injury is assumed and part of the very definition of that type of force. For example, when a subject experiences pepper spray, the resulting irritation and temporary pain constitute the documented (by policy) injury. However, this injury is transitory and does not entail lasting effects. Indeed, it has been argued by some scholars that pepper spray should be placed low on the force continuum because it does not show a propensity for serious medical injury (Lumb & Friday, 1997). Another example in this frame is that of injury related to CED use. The successful application of a CED almost always results in either small probe lacerations or burn marks. Again, the resulting injury to the subject of arrest is part of the very definition of that type of force but is short-lived and does not have a lasting effect. While some argue against classifying these outcomes as an injury, others advocate for their inclusion (Terrill & Paoline, 2012a). 8 Regardless, it seems uncontroversial when examining the trade-off between officer injury and subject injury for a particular less-lethal tool, that an individual evaluation should be made about the type of injury most likely to occur. While outside the scope of this article to analytically consider injury type and severity, this is an area ripe for future research building on the findings presented here.
This study has implications for a variety of unanswered questions. How have police agencies determined where different types of force should be located within their force continua? Are these decisions based on personal preferences of agency administrators? Are these decisions based on lawsuits and other liability exposure? Do newer less-lethal tools get placed higher on the continuum as they are introduced to the policing industry because they are new and therefore perceived as a more “serious” force option (i.e., CEDs)? This last possibility merits serious consideration as we reviewed the history of the introduction of pepper spray and CEDs to the field of policing (Haskins, 2019a, 2019b; Lumb & Friday, 1997; Thomas et al., 2010).
Another possibility is an inherent desire for police agencies to avoid the optics of their officers using such “weapons” because of public relations concerns, as well as worries of overuse (Thomas et al., 2010). Research consistently demonstrates that subject resistance tends to be higher than the levels of police force employed (Alpert & Dunham, 2004; Bazley et al., 2007). This outcome (based on use-of-force policies and the force continua within them) may be by design, however, as the primary purpose of use-of-force policies is to ensure that the minimum amount of force is applied, regardless of whether greater force could have been used (McEwen, 1997). However, the placement of less-lethal tools (specifically CEDs) higher on force continua has been found to decrease their use (Thomas et al., 2010) and increase officer injuries (Womack et al., 2016).
Implementing the best scientific evidence available into government policy is not as simple as pointing to findings (Weingart, 1999). Policy construction is often an exercise in managing value conflicts (Stone, 2012). Do policymakers choose an increased likelihood of police officer injury, or, alternatively, do policymakers choose an increased likelihood of subject injury? Our study was not designed, nor is it able, to offer an answer. Reasonable individuals likely prefer neither to occur, but within the realities of police use-of-force, one option must be chosen. While the primary purpose of this article is not to explore in a comprehensive way this particular trade-off, our analysis does raise the profile of this dilemma when considering police agency force continua and how they are operationalized.
Finally, our analysis contributes to a better understanding of the location of firearm display within a force continuum. In all iterations of analysis, firearm display was at the bottom of an ordinal ranking of force and was less likely than other forms of force to injure subjects. This finding does not suggest that police officers should more actively employ the display of firearms in place of other less-lethal types of force in high-stress situations; reasonableness and proportionality will always play a primary role in that type of decision. We simply offer that this particular type of force was consistently found to be at the lowest level of force options within these data. Low levels of weapon pointing may be related to the studied department’s policy that requires officers to document when they point their weapon at a human subject. This type of policy is consistent with that recently studied by Shjarback et al. (2021) in the Dallas Police Department, where the authors found the policy was associated with a reduction in both weapon pointing overall and deadly force encounters.
In sum, the ordinal nature of force implicated by police agency policies is not aligned with the empirical experiences of using force. While outside our scope or intent to comprehensively answer the questions we raise in this section, our findings suggest that greater attention should be devoted to how these policy determinations are made. The fact that 123 different permutations of force progression, ranging from three to nine different levels, found in Terrill and Paoline’s (2012b) national study exist calls our attention to this important area of research.
Limitations
We have demonstrated the use of a statistical technique to examine less-lethal force within force continua in a novel but practically useful manner. Despite significant contributions, there are limitations to be kept in mind in weighing the findings. First, due to data restrictions, the most significant limitation is that we were forced to collapse two types of physical force (physical, soft; physical, hard) into one physical force variable. This is problematic because these two types of force are explicitly labeled as different categories in the use-of-force continuum and can have very different consequences. If we could decouple these two types of physical force in our analysis, we think it likely that the quantification score for physical, hard would increase, and the quantification score for physical, soft would decrease. In what magnitude, relative to other types of force, needs to be examined with more granular data.
Second, our analysis was conducted with use-of-force data from a single police agency. Although the agency is broadly similar to national demographic comparisons, it is unclear what factors unique to the department might make the analysis generalize poorly. The quantification scores reported here through CROS are only appropriate with the particular set of variables included in this study. Our methods should be replicated in other departments with similar and dissimilar use-of-force continua to determine if the results are generalizable across departments and force continua. Another limitation of agency data is that the model assumes use-of-force was used in accordance with policy. In a counterfactual where a substantial portion of use-of-force was used inappropriately, either across categories or in a specific category, the analysis and findings would be likely to shift. While our inquiry revealed no such pattern, and there are no significant agency or judicial findings that would suggest a trend of inappropriate deployment of pepper spray, taser, or baton, the findings presented here do rest upon an assumption of stable adherence to agency use-of-force policy by officers. To the degree that patterns of inappropriate force use appear in an agency, the findings here should not be considered generalizable.
Third, there is always the threat of omitted variable bias when assessing police use-of-force. Possible omitted variables that may affect what force is used include location of incident, number of (if any) backing officers, officer proximity to the subject, and more. Decision-making in police use-of-force scenarios is highly complex, and no statistical model is likely to account for all possible contributing variables, nor are all variables likely to be directly measurable or present in administrative data. However, by accounting solely for subject resistance, the model explains over 70% of the variance in the studied use-of-force encounters. Furthermore, this study aimed not to explain what type of force was used and why, but rather where each less-lethal force type ranked on an ordinal scale. We accomplished this with the use of CROS.
Fourth, while the officer and subject injury models were statistically significant, the R2 for both were not particularly impressive (.06 and .15, respectively). Furthermore, in both regressions, the level of resistance played a more significant role than the type of force used when examining standardized regression coefficients. This limitation is not disqualifying for this study, as its aims were not to model the phenomenon of injury generally. However, the type of force did play a significant role in injury, and future studies interested in that outcome should take note that there are undoubtedly other substantive factors to consider.
Finally, it is recognized that administrative data obtained from use-of-force reports may suffer from a lack of accuracy. Furthermore, use-of-force reports only provide one view of the interaction—that of the officer. Four realities protect against this limitation, however. First, officer reports are mandatorily reviewed by a supervisor. Second, if a subject is injured during a use-of-force incident, the officer’s supervisor must review the body-worn camera footage of the incident. Third, if a complaint or allegation of misconduct is made, the report is reviewed by a supervisor as well as the internal affairs unit. Finally, and admittedly less routinely, use-of-force incidents are commonly reviewed by defense attorneys (when civil rights and/or criminal cases are implicated in the underlying case), and plaintiffs’ attorneys do the same when a civil case is considered. Our inquiries did not reveal any reason to believe that officers’ input tainted the administrative data studied here. However, there is no realistic way of verifying the accuracy of the individual underlying reports. In all limiting cases, we recommend due caution until other researchers are able to undertake similar studies.
Conclusion
Despite police use-of-force being extremely rare (Eith & Durose, 2011; Pate & Friddell, 1993), well-publicized use-of-force events can evoke widespread community and professional concern (Adams, 1999; Alpert & Dunham, 2004; Klinger & Brunson, 2009). In the last 30 years, even lawful, nonlethal use-of-force by police has become less accepted among the general American public (Mourtgos & Adams, 2020). Furthermore, while lethal use-of-force events tend to garner more pronounced attention, nonlethal force is the type of force most commonly used by police officers (Stroshine & Brandl, 2019). As such, policing researchers should strive to better understand how less-lethal force is used and how and why police agencies create the policies governing its use. In our study, we examine just that and find that the studied department’s placement of less-lethal options within its force continuum does not meet the inherent ordinal assumptions. Furthermore, the policy choice reflected in the continuum is associated with increased officer injuries. While we refrain from calling on police agencies to conform their force continuums exclusively to statistical evidence, policymakers should reexamine their force category placements through the lens of our findings, while simultaneously engaging with the policy trade-offs in officer and subject injuries.
Footnotes
Acknowledgements
The authors give special thanks to Dr. Nicholas P. Lovrich for his help and insight in the preparation of this manuscript.
Declaration of Conflicting Interests
The author(s) declared no potential conflicts of interest with respect to the research, authorship, and/or publication of this article.
Funding
The author(s) received no financial support for the research, authorship, and/or publication of this article.