



Abstract
When a dozen new countries joined the European Union in the mid-2000s, political tensions spiked over disparities in corporate income tax rates. Since the time of enlargement, leaders have tried repeatedly to enhance corporate tax coordination within the EU, as a result of fears of downward pressure on corporate tax rates and states’ weakening ability to collect revenues. At the same time, leaders from new member states in Eastern Europe with low corporate tax rates have contended that regional efforts to coordinate tax policies are not worthwhile, given that corporate tax competition is a global phenomenon. This article argues that corporate tax competition is more acute at the regional than the global level. While corporate tax rates are falling inside and outside the EU, we demonstrate using a large multiyear, multiregional data set that Eastern European countries have extremely low corporate tax rates relative to other EU and non-EU countries, even when controlling for multiple domestic economic and political factors. These findings support the potential efficacy of pursuing regional corporate tax reform to address the downward spiraling of rates in the EU.
When a dozen new countries joined the European Union in the mid-2000s, political tensions spiked over the great disparities in corporate income taxes across the enlarged economic space, with some politicians in the West accusing the new members in the East of “tax dumping.” This anxiety over nationally determined corporate income tax (CIT) rates across the EU attracted substantial media attention and hype, but these concerns were not new. Even before the eastern enlargement, EU leaders frequently expressed concern over the uncoordinated taxation of corporations with operations across Europe. The European Commission had devoted many years of research and attention to the problems associated with the variation in company taxation, and European scholars have focused on the issue of corporate tax competition, globally and within Europe. 1 The many applicable CIT regimes produced high transaction costs as firms attempted to meet (or minimize) their tax obligations. Compliance with multiple systems of corporate taxation is costly for firms conducting business across EU states, with each country imposing different rules, involving different fiscal bodies, levying different rates, and requiring different filing dates.
At the time of accession, however, the tremendous complexities, distortions, and inefficiencies for companies conducting transnational business were not the main concerns that politicians and bureaucrats emphasized in their attacks. Rather, the politicians who spoke out on this issue tended to stress the emergence of harmful tax competition and the erosion of an important source of tax revenue, given that so many new East European members had particularly low rates. Leaders feared that after enlargement, tax competition in Europe would become much more severe.
The calls from leaders in Germany, France, and Sweden for harmonizing corporate tax policy around the time of enlargement prompted several East European leaders to assert the necessity of maintaining low taxes to remain attractive to investors in a globally competitive environment. For example, former Slovak Finance Minister Ivan Mikloš warned, “Tax and other competition from new EU member countries only highlight the structural and policy shortcomings in the preparedness of many of the old EU member countries to face severe global competition.” 2 This reaction insinuated that the CIT rates of older member states were above global averages and thus not internationally competitive, while the policies of new EU member states were more consistent with world trends and hence more competitive. The reaction also suggests that the impetus behind governments lowering rates is the need to respond to global competition rather than to regional pressures or domestic concerns.
Without a doubt, corporate tax competition is a global phenomenon and corporate tax rates have been falling throughout much of the world. The average nominal tax rate of the 51 (European and non-European) countries with available data in 1985 and 2012 fell 38.2 percent: from 43.7 percent to 27 percent. The overall global average for the 117 countries with available data in 2012 is even lower—at 23.3 percent. 3 Nonetheless, intra-European tax competition has been particularly intense given very high firm mobility. What especially concerned policymakers leading up to enlargement was the growing disparity in rates among European Union member states. For example, Ireland has maintained a low CIT rate of 12.5 percent since 2003 as part of a broad strategy to attract investment and help its economy catch up with wealthier countries in the union. Even lower, Cyprus and Bulgaria’s rates have been 10 percent since 2003 and 2007 respectively. By comparison, the CIT rate at the time of the first wave of enlargement in France was 34.3 percent, in Spain 35 percent, in Italy 37.3 percent, and in Germany 38.3. 4 West European leaders may have grudgingly tolerated Ireland’s low corporate tax rate, when Ireland was the exception. The eastern enlargement beginning in 2004, however, significantly increased the number of low-tax EU countries. Of the ten eastern enlargement countries in the 2004 and 2007 rounds combined, eight have rates at or below 20 percent and three have rates at or below 15 percent. 5 While this worried West European politicians and led to recriminations and threats in the mid-2000s, 6 leaders in large West European countries failed to convince low-tax countries to adjust their CIT rates. Their inability to persuade East European governments to raise their corporate tax rates may be surprising given how persuasive the EU had been during the accession process. 7 The demands for corporate tax coordination in 2004 came too late in the accession process to be influential, however, as membership for most of the countries was already a done deal. Moreover, the efforts to pursue European corporate tax coordination that gained momentum during the height of the recent European financial crisis have stalled now that the crisis has subsided.
The EU’s pursuit of a regional solution to help Europe cope with downward pressures on corporate taxes may be misplaced, however, given that many scholars and policy specialists understand falling corporate taxes, and corporate tax competition in particular, as global phenomena. 8 After all, what is the value in pursuing a tax harmonization program in Europe if the dynamics causing competitive undercutting of corporate tax rates stem from global competition, not regional competition? Are there data to support the claims by West European leaders that East European governments have undercut the rates in older member states more than global pressures generally?
In order to gain insight into the domestic, regional, and global influences on corporate tax trends, this paper examines corporate income tax rates in Europe, comparing the trends in West European countries first to trends in a set of Eastern European new member states and then to a set of non-EU countries, using a large multiyear, multiregional data set spanning twenty-eight years and containing data for 123 countries. 9 The data analysis provides insight into claims of East European leaders that stress the globally uncompetitive corporate tax rates in Western Europe and the need for East European corporate taxes to remain in line with global averages. Based on our analysis of the data, we confirm that nominal corporate income tax rates are falling in Western Europe, Eastern Europe, and globally over the sample period. That said, we also find that the set of new members in Eastern Europe impose low tax rates compared to other European countries and compared to a large global set of countries, suggesting these new member states may be a crucial source of pressure for large, high tax states within the EU. This finding holds even when other domestic factors in Eastern European countries are taken into account. As a result, we argue that the pursuit of a regional solution to tax competition may in fact be an especially effective approach to slow the downward spiral of corporate tax rates in Europe.
Corporate Tax Trends: Assessing the Appropriateness of a Regional Solution
The nearly universal downward trend in nominal rates is incontrovertible. Figure 1 displays the average nominal CIT rate for EU-15 countries and non-EU countries from 1985 to 2012, along with the average rate for new Eastern European members from 1996 to 2012. 10 The figure plots the downward trend in rates in all three subgroups. The plot indicates that East European countries have dramatically lower average corporate income tax rates than those of the older West European (EU-15) countries and a lower average than non-EU countries. Figure 1 also demonstrates that EU-15 countries have an average CIT rate that is higher than non-EU countries; the difference is not large and as several multiple linear regressions discussed later and presented in Table 2 indicate, it is not statistically significant.

Average CIT Rates
We quantify the plotted trend with a simple linear regression of the corporate tax rate on year for each subgroup. The results in Table 1 indicate that for each subgroup the downward trend in averages plotted in Figure 1 is statistically significant. The strongest trend is found in East European countries, where each year corresponds to a decrease of more than a percentage point in the CIT rate. The plots and simple regressions of tax trends provide the basic context for tax policy differences, while more detailed regression analysis demonstrates that the trends are statistically significant.
CIT Time Trends
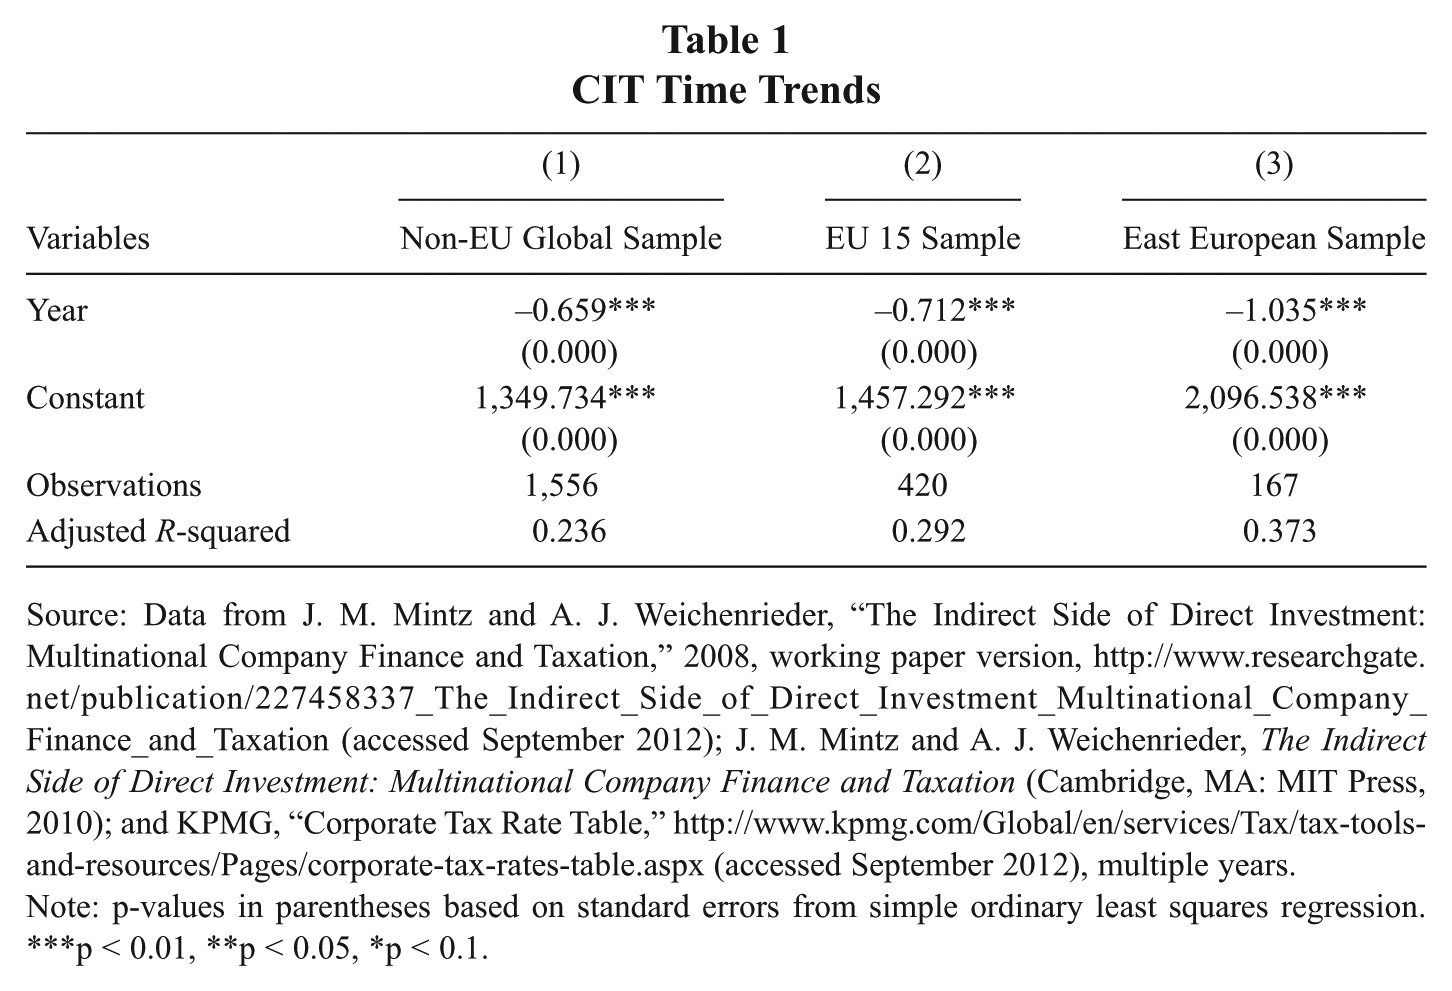
Source: Data from J. M. Mintz and A. J. Weichenrieder, “The Indirect Side of Direct Investment: Multinational Company Finance and Taxation,” 2008, working paper version, http://www.researchgate.net/publication/227458337_The_Indirect_Side_of_Direct_Investment_Multinational_Company_Finance_and_Taxation (accessed September 2012); J. M. Mintz and A. J. Weichenrieder, The Indirect Side of Direct Investment: Multinational Company Finance and Taxation (Cambridge, MA: MIT Press, 2010); and KPMG, “Corporate Tax Rate Table,” http://www.kpmg.com/Global/en/services/Tax/tax-tools-and-resources/Pages/corporate-tax-rates-table.aspx (accessed September 2012), multiple years.
Note: p-values in parentheses based on standard errors from simple ordinary least squares regression. ***p < 0.01, **p < 0.05, *p < 0.1.
While these observations do reveal the relatively lower tax rates in Eastern Europe, they still beg the question of whether East European countries have lower rates, not so much because they reside in a particular region (where a trend in low rates has emerged), but simply because East European countries share national-level traits that are found in developing countries in other regions with similar political systems or levels of wealth. The regression analysis presented below offers insight into whether the differences are simply attributable to country-level economic and political characteristics, such as wealth, population size, levels of trade, foreign investment flows, level of democracy, or the ideology of the government, or instead are specific to Eastern Europe. The regression’s inclusion of domestic-level variables serves to link our analysis to a central debate in the tax competition literature that focuses on the mediating effect of domestic-level factors on tax competition, especially the influence of domestic political factors. We discuss the relevance of our findings to this debate below.
Multivariate Regression Analysis
We measure differences among the three groups of interest using two indicator variables, one for Eastern Europe and one for EU-15 countries, similar to the approach of Genschel, Kemmerling, and Seils. We also include an imitation variable, 11 to test whether CIT rates in one country are related to rates (of the prior year) in other countries. Imitation is an important component of any analysis of the diffusion of policy ideas, and in this study it captures the relationship between the tax rate in a given country and the rates of other countries (in the previous year).
We use a panel data set of between 1413 and 1920 observations from up to 111 countries over the period 1986–2011 to fit regression models based on the following baseline statistical model: 12

The country-level factors included in the model are the ratio of exports and imports over GDP (
We estimate four different model specifications using the entire global sample, all variations of the baseline model. The first model is a stripped-down economic model including only country-level economic and demographic variables. This model establishes the importance of these economic factors. Model 2 includes all variables listed in equation (1). Model 3 builds off of the baseline model by including a measure of democracy, polity2 from the Polity IV project. 14 The polity2 measure ranges from –10 (autocratic) to 10 (democratic); values above 0 can be classified as generally being a democracy. In the final model, we also include a measure of the ideology of the government (i.e., the partisan character of the parliament or the legislative house). We compute this measure from the World Bank’s Database of Political Institutions. 15 The database provides the ideology in terms of right, left, or center for each of the three leading governing parties; it also includes the number of legislative seats each of these parties control. We assume these three parties have dominant power and thus aggregate their ideology (weighted by seat share), we rescale the original variable so that our aggregate number varies between 0 and 1, where 0 is liberal and 1 is conservative. For each model in Table 2, we use clustered standard errors across time and country to test for significance. Although not shown here, we conducted similar analysis using Newey-West standard errors; the results are similar in all models. 16
Global Regressions: Dependent Variable CIT Rate a

Source: For tax data, J. M. Mintz and A. J. Weichenrieder, “The Indirect Side of Direct Investment: Multinational Company Finance and Taxation,” 2008, working paper version, http://www.researchgate.net/publication/227458337_The_Indirect_Side_of_Direct_Investment_Multinational_Company_Finance_and_Taxation (accessed September 2012); J. M. Mintz and A. J. Weichenrieder, The Indirect Side of Direct Investment: Multinational Company Finance and Taxation (Cambridge, MA: MIT Press, 2010); and KPMG, “Corporate Tax Rate Table,” http://www.kpmg.com/Global/en/services/Tax/tax-tools-and-resources/Pages/corporate-tax-rates-table.aspx (accessed September 2012), multiple years; for democracy, Polity IV project (M. G. Marshall and T. R. Gurr. “Polity IV Project: Political Regime Characteristics and Transitions, 1800-2012,” http://www.systemicpeace.org/polity/polity4.htm [accessed September 2013]); for ideology, World Bank’s Database of Political Institutions (T. Beck, G. Clarke, A. Groff, P. Keefer, and P. Walsh, “New Tools in Comparative Political Economy: The Database of Political Institutions.” World Bank Economic Review15, no. 1 (2001): 165-176 [Updated January 2013, accessed September 1, 2013]. http://econ.worldbank.org/WBSITE/EXTERNAL/EXTDEC/EXTRESEARCH/0,,contentMDK:20649465~pagePK:64214825~piPK:64214943~theSitePK:469382,00.html); for all others, World Bank’s World Development Indicators (World Bank: World Development Indicator database, http://data.worldbank.org/data-catalog/world-development-indicators [accessed September 2012 and April 2013]).
Note: p-values in parentheses based on standard errors clustered by country and year, estimated using cluster2 command in Stata (M. Petersen, “cluster2” [code], 2006, http://www.kellogg.northwestern.edu/faculty/petersen/htm/papers/se/se_programming.htm [accessed September 13, 2012]). ***p < 0.01, **p < 0.05, *p < 0.1.
We exclude Luxembourg 2005 from the regressions because it is an overly influential outlier that would bias our results, with DFFITS and DFBETA above 1. For robustness checks excluding other potentially overly influential observations, see Appendix B.
In model 1, we test the correlation between all of the economic and country-level variables and the corporate tax rate. As one might expect, inflows of foreign direct investment (FDI inflows) are negatively correlated with CIT rates. Although the economic significance of this coefficient is not particularly strong, a 1 unit increase in FDI inflows, as percentage of GDP, is associated with decrease in the mean (predicted) CIT rate by only 0.21 units (percentage points). 17 Trade is also statistically significant, but economically weak. A 1 unit increase in trade, as percentage of GDP, is associated with less than a tenth of a percent increase in CIT rate. Consistent with the large countries’ political efforts to reduce downward pressure on CIT rates, population size is positively correlated with CIT rate: roughly a 1 percent increase in population is associated with 2.3 unit increase in CIT rate. In the stripped down model, wealth is not significantly associated with CIT rates.
Model 2 provides a complete baseline specification including all economic country level factors, the global imitation variable, and the regional indicator variables. All coefficients (except the EU-15 indicator) are statistically significant and the correlations are in the intuitively expected directions. Namely, increases in trade and FDI inflows are associated with a decrease in the mean CIT rate, while an increase in wealth and population is associated with an increase in CIT rate. Additionally, a 1 unit increase in the average CIT rate of all other countries in the previous year is associated with a 0.77 unit increase in CIT rate. The regression coefficient for EU-15 implies that being a member of the EU-15 is not statistically associated with higher CIT rates, ceteris paribus. While on the other hand, the indicator variable for Eastern European countries indicates that being an East European country is associated with a lower CIT rate of more than 4 percentage points, ceteris paribus. The imitation effect and the indicator variables also dramatically increase the explanatory power of the model. The adjusted R-squared for model 2 is nearly 43 percent as compared to 24 percent for model 1.
In models 3 and 4, we control for two distinctly political variables, level of democracy and government ideology. An important question raised in the corporate tax competition literature is whether domestic political variables overpower or diminish the impact of global corporate tax competition. 18 While some studies emphasize the impact of regional and global tax competition on corporate tax rates, 19 others emphasize the significant influence of domestic political factors. 20 Our intuition is that democracy, if significant, would be negatively correlated with corporate tax rates. In democratic environments, politicians may vote for low corporate taxes when the corporate sector can use campaign contributions to support candidates favoring low tax rates. 21 We use the polity2 measure of democracy described above. 22 The results in model 3 indicate that democracy is negatively associated with CIT rates, but the relationship is not statistically significant. In model 4 we include government ideology. An early study by Hibbs 23 argues that right-leaning parties are more likely to support cutting capital taxes because capital generators are considered strong supporters of these parties; left-leaning parties are more likely to incur political costs associated with lowering capital tax rates. Our analysis does not confirm a positive relationship between rates and government ideology, and the relationship is far from achieving statistical significance. The coefficients for the indicator variables for these four models are mostly as expected; however, the East Expansion ID is not significant in model 4. This is likely due to sample restrictions incurred by including the ideology variable. Among the 395 observations lost from the baseline model 2 to model 4 are observations for Bulgaria from 2002 to 2009. Since Bulgaria is among the Eastern European countries with the lowest tax rates (10 percent since 2007 and below 20 for the four years before that), the exclusion of these countries’ observations likely has a marked impact on the results. Even given these sample limitations, the coefficient is not so far from the 1 percent significance level. In fact, in the Newey-West version of these regressions, this coefficient is significant at the 5 percent level.
In sum, our global regression findings show that EU-15 countries do not have tax rates that are on average higher than the global averages, even when controlling for economic and political factors. By contrast, Eastern European countries do have tax rates that are inconsistent with global rates. These new member states have markedly lower tax rates even when controlling for country size, wealth, and degree of global integration. In addition, we find that a country’s CIT rate is highly correlated with global average rates. Importantly, we find that regional dynamics, global imitation, and country-level economic and demographic variables are all significantly associated with CIT rates in at least some of the model specifications, while domestic political factors—democracy and governing ideology—are not.
From Nominal to Effective Tax Rate Trends in Europe
Many scholars have identified the limitations of using nominal tax rates to measure dynamics in corporate tax policy. 24 After all, a country can lower the nominal rates while eliminating exemptions or closing loopholes, thereby actually increasing the burden on corporations, despite the lower rates. Given these concerns, we supplement the empirical work above, which uses nominal tax rates, with further analysis using effective tax rates. Figure 2 documents the trends in effective tax rates within the EU. In Table 3 we present the results from an EU only sample using effective average tax rate (EATR); 25 in Table 4 we present similar results using nominal rates as the dependent variable in order to link the EU-level results to other analysis in the paper. The independent variables are the same as the global sample, although we exclude the EU-15 indicator variable, since that group and the Eastern European countries constitute the entire sample. We also modify the imitation variable. We calculate the variable as the lagged average rate of countries in the EU with EATR and CIT rates available. We define the imitation variables this way so that the two sets of regressions are comparable.
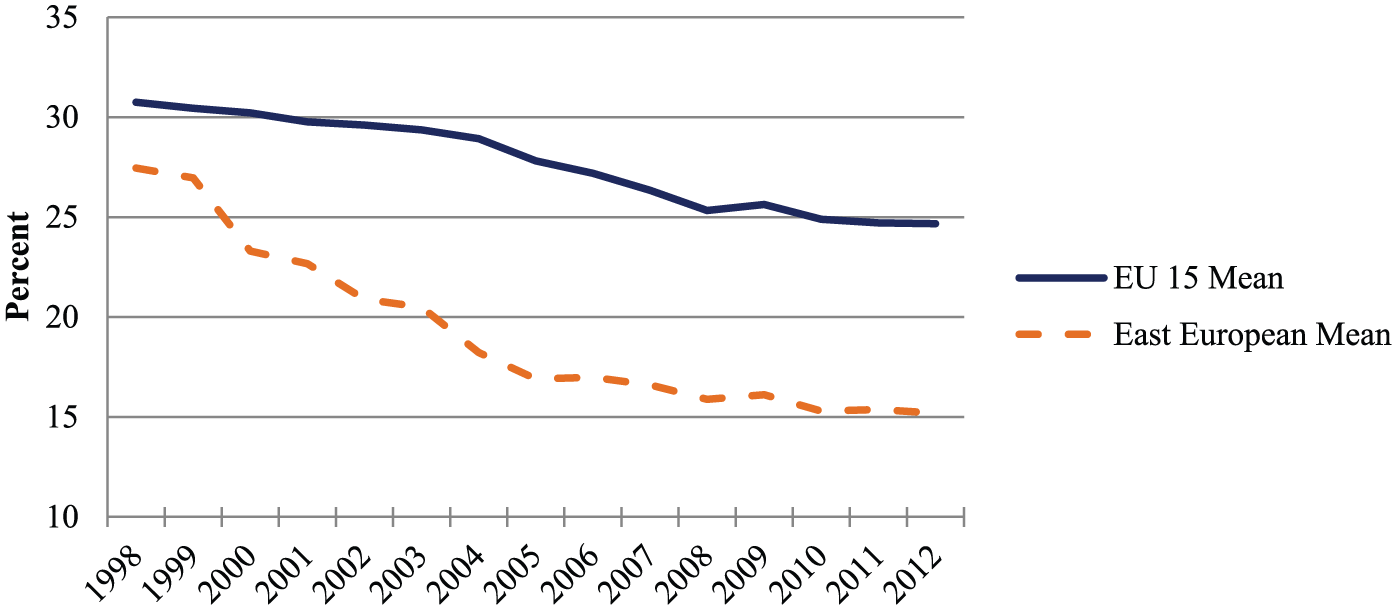
Effective Average Tax Rates
EU Regressions: Dependent Variable EATR

Source: For tax data, Eurostat (European Commission http://ec.europa.eu/eurostat/data/database [Accessed September 1, 2013]); for democracy, Polity IV project (M. G. Marshall and T. R. Gurr. “Polity IV Project: Political Regime Characteristics and Transitions, 1800-2012,” http://www.systemicpeace.org/polity/polity4.htm [accessed September 2013]); for ideology, World Bank’s Database of Political Institutions (T. Beck, G. Clarke, A. Groff, P. Keefer, and P. Walsh, “New Tools in Comparative Political Economy: The Database of Political Institutions.” World Bank Economic Review 15, no. 1 (2001): 165-176 [Updated January 2013, accessed September 1, 2013]. http://econ.worldbank.org/WBSITE/EXTERNAL/EXTDEC/EXTRESEARCH/0,,contentMDK:20649465~pagePK:64214825~piPK:64214943~theSitePK:469382,00.html); for all others, World Bank’s World Development Indicators.
Note: p-values in parentheses based on standard errors clustered by country and year, estimated using cluster2 command in Stata (M. Petersen, “cluster2” [code], 2006, http://www.kellogg.northwestern.edu/faculty/petersen/htm/papers/se/se_programming.htm [accessed September 13, 2012]). EATR = effective average tax rate. ***p < 0.01, **p < 0.05, *p < 0.1.
EU Regressions: Dependent Variable CIT Rate
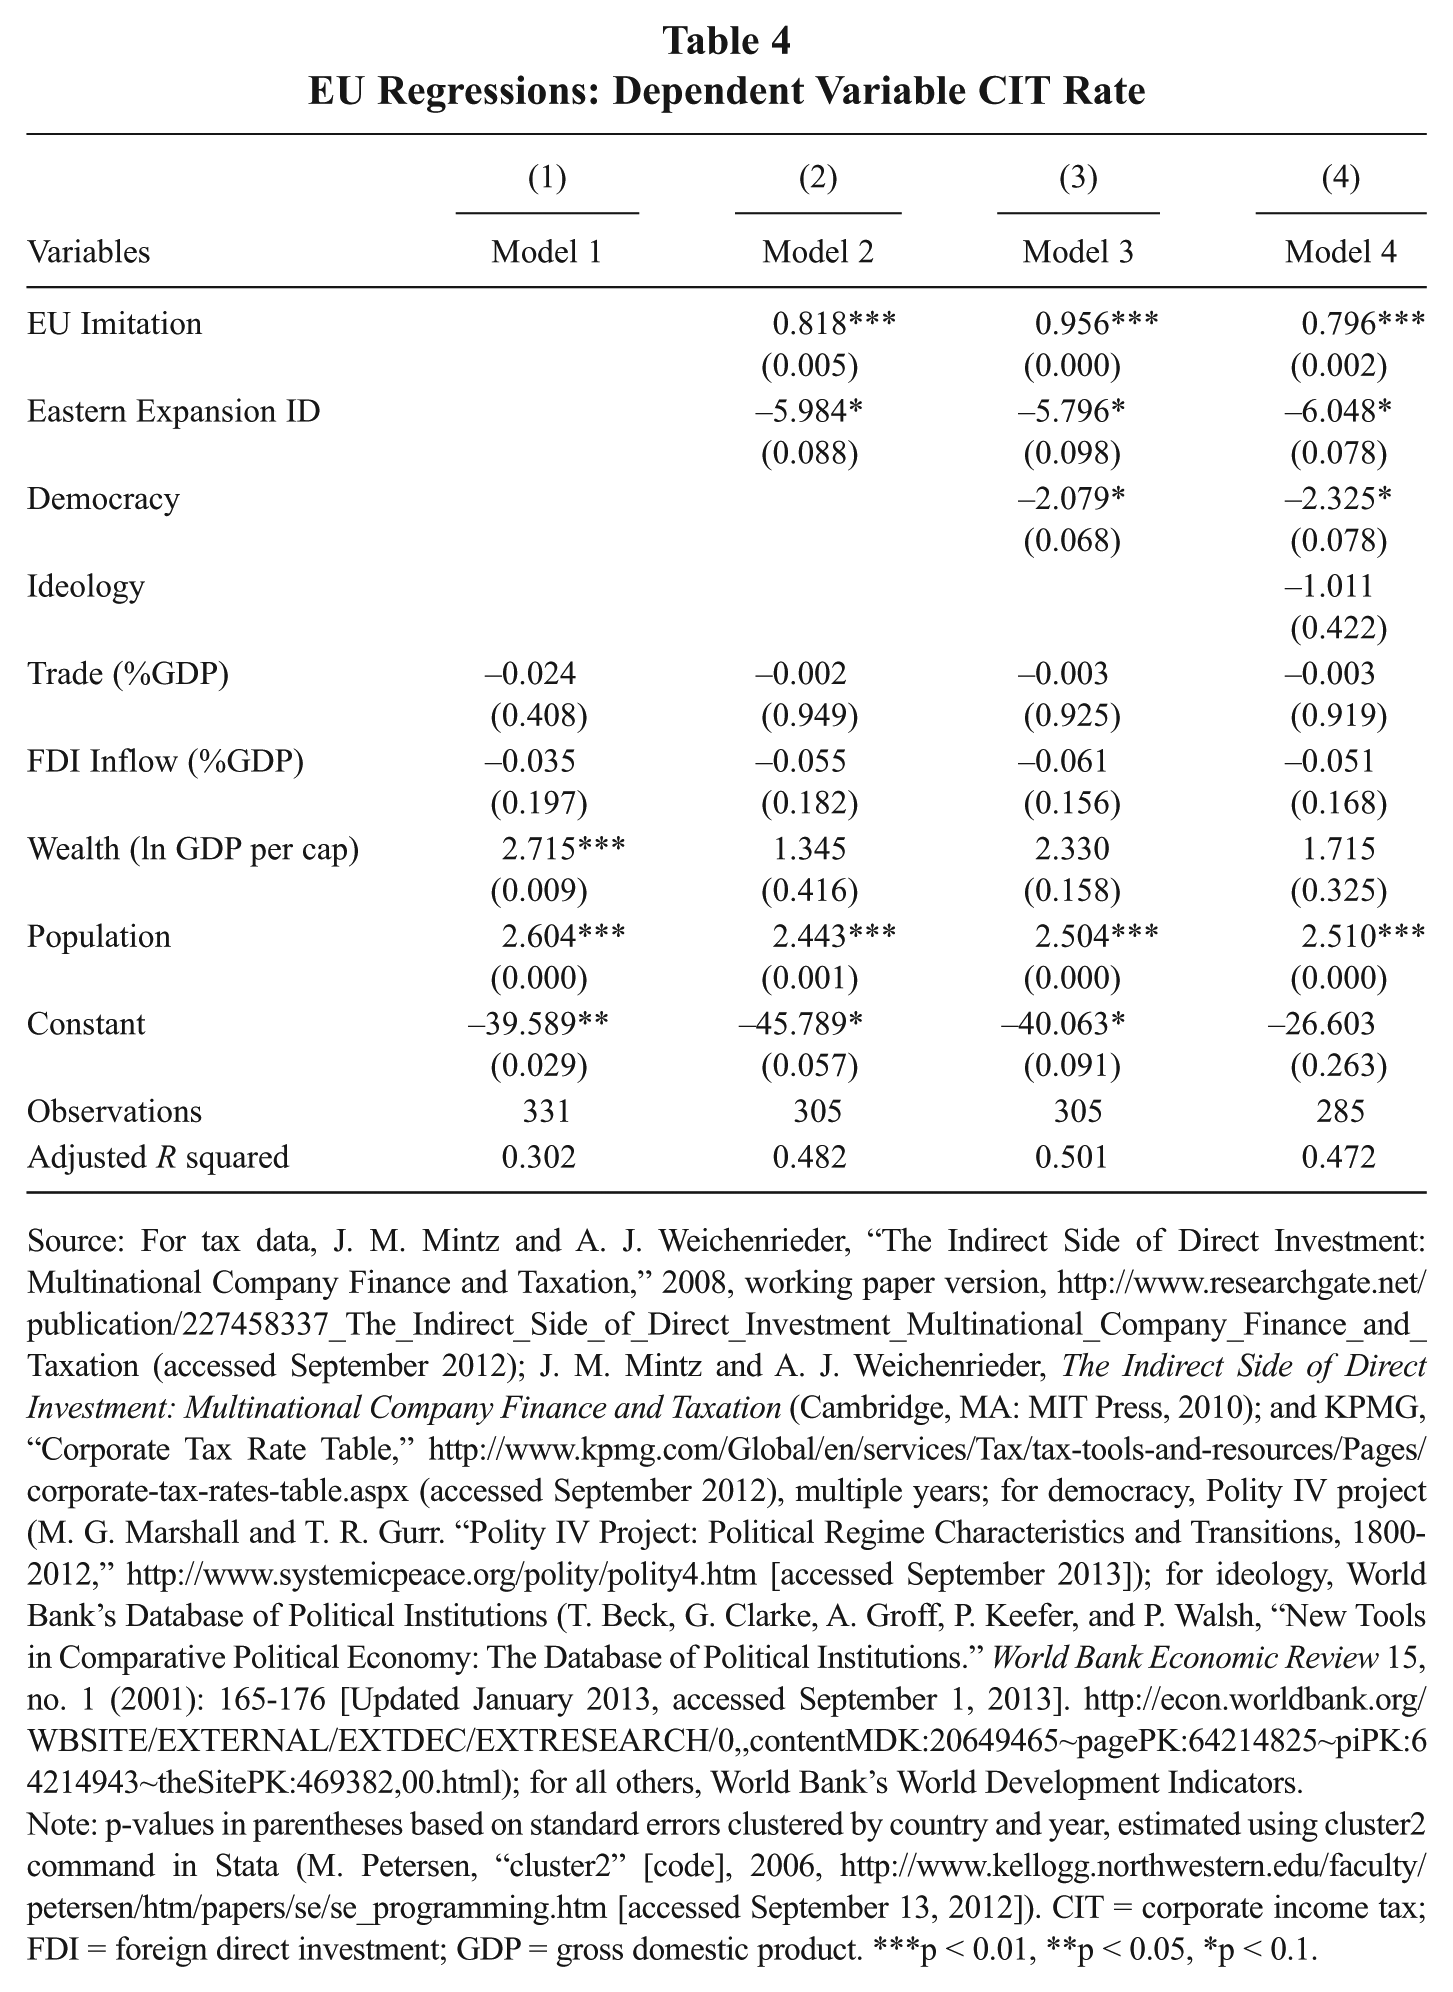
Source: For tax data, J. M. Mintz and A. J. Weichenrieder, “The Indirect Side of Direct Investment: Multinational Company Finance and Taxation,” 2008, working paper version, http://www.researchgate.net/publication/227458337_The_Indirect_Side_of_Direct_Investment_Multinational_Company_Finance_and_Taxation (accessed September 2012); J. M. Mintz and A. J. Weichenrieder, The Indirect Side of Direct Investment: Multinational Company Finance and Taxation (Cambridge, MA: MIT Press, 2010); and KPMG, “Corporate Tax Rate Table,” http://www.kpmg.com/Global/en/services/Tax/tax-tools-and-resources/Pages/corporate-tax-rates-table.aspx (accessed September 2012), multiple years; for democracy, Polity IV project (M. G. Marshall and T. R. Gurr. “Polity IV Project: Political Regime Characteristics and Transitions, 1800-2012,” http://www.systemicpeace.org/polity/polity4.htm [accessed September 2013]); for ideology, World Bank’s Database of Political Institutions (T. Beck, G. Clarke, A. Groff, P. Keefer, and P. Walsh, “New Tools in Comparative Political Economy: The Database of Political Institutions.” World Bank Economic Review 15, no. 1 (2001): 165-176 [Updated January 2013, accessed September 1, 2013]. http://econ.worldbank.org/WBSITE/EXTERNAL/EXTDEC/EXTRESEARCH/0,,contentMDK:20649465~pagePK:64214825~piPK:64214943~theSitePK:469382,00.html); for all others, World Bank’s World Development Indicators.
Note: p-values in parentheses based on standard errors clustered by country and year, estimated using cluster2 command in Stata (M. Petersen, “cluster2” [code], 2006, http://www.kellogg.northwestern.edu/faculty/petersen/htm/papers/se/se_programming.htm [accessed September 13, 2012]). CIT = corporate income tax; FDI = foreign direct investment; GDP = gross domestic product. ***p < 0.01, **p < 0.05, *p < 0.1.
The EU sample regression results for EATR as the dependent variable generally demonstrate weaker economic and demographic results. In fact, only population is significant in all of the models, and wealth is significant in only the base model. While still controlling for potential relationships between country-level economic, political, and demographic factors, we seek to understand whether the relationships still hold between effective tax rates, the Eastern European indicator variable, and the imitation variable. In other words, we seek to discern whether East European average effective tax rates are still especially low relative to average rates in Western Europe and whether a country’s effective CIT rate is related to the previous year’s rates of other countries. For these coefficients, the results are quite similar for the nominal and the effective tax rates. In sum, being a member of the Eastern European bloc of countries is strongly associated with dramatically lower CIT rates—up to 6 percent lower for effective and nominal rates. The imitation variable is also statistically associated with effective tax rates, which suggests that a fall in a country’s effective tax rate is related to the fall in rates in other EU countries. A decline (increase) in the average effective tax rate among other EU countries of 1 percentage point is associated with a decline (increase) in a given country’s tax rate by about 0.8 percentage points. There is a similar relationship for nominal rates.
In the models 3 and 4 of Table 4, the level of democracy is (weakly) significant. In this country subset, the direction of association is negative, which is consistent with our initial intuition. Higher levels of democracy are associated with lower tax rates. Given the European sample, this result is logical. Generally speaking the newer EU member states are likely to have lower democratic scores while the older more established members are likely to have higher democratic scores. We have already established that we expect lower rates from the former, and higher rates from the latter. In both full models, once again ideology is not statistically associated with tax rates (effective or nominal). 26 In sum, the results of the effective tax rate tests are consistent with our global findings. The Eastern European countries have low corporate tax rates, and countries are imitating the rates of other countries.
Altogether, our findings show that older EU member states do not have nominal corporate income tax rates that are on average higher than the global averages, even when controlling for economic and political factors. By contrast, Eastern European countries do have tax rates that are inconsistent with global rates. These new member states have markedly lower tax rates even when controlling for country size, wealth, and degree of global integration. Moreover, the significance of the imitation variable suggests that a country’s CIT rate is related to the average rate in other countries in the previous year. Hence, West European fears of intensifying downward pressure on CIT rates following EU enlargement were well founded. By the same token, claims by East Europeans that West European states are losing competitiveness globally in the area of corporate tax policy are not supported by the analysis. Within the European common market more narrowly, however, older member states on average offered significantly less favorable corporate income tax rates than the new Eastern European members, both in terms of nominal and effective rates.
Concluding Discussion: Contextualizing Tax Trends in Regional Policy Efforts
Calls for harmonizing corporate income taxes have been around for decades; they reached new heights at the time of EU enlargement, and peaked again following Europe’s financial and sovereign debt crises. Given the discrepancy of the corporate income tax rates across EU member states, it is not surprising that fears of tax competition and lost revenue are important issues for leaders in high-tax countries like Germany and France. Even though corporate tax competition became a salient political challenge for high-tax countries at the time of the 2004 enlargement, little could be done. Leaders in low-tax countries in Eastern Europe felt their corporate tax regimes were an important part of their growth and development strategies. Corporate taxation was not part of Community law, and thus not part of the obligatory adoption of the acquis communautaire.
The recent financial and sovereign debt crises created a renewed opportunity to reexamine corporate taxation in Europe and pursue fiscal policy reform more broadly. Low corporate tax rates once again became the focus of politicians responding to popular frustrations with economic conditions and large-scale bailouts across Europe. Calls for a common corporate tax rate and a financial transactions tax became popular in many elite political circles. 27 Even the international financial institutions acknowledged the need to rely more significantly on underutilized sources of tax revenue, including the wealthy. 28 Faced with this acute economic crisis and the potential collapse of the euro, key members of the European Commission openly supported deepening fiscal coordination rather than reducing the degree of economic interdependence in Europe. At the 2012 annual conference of the Brussels Tax Forum, the EU Tax Commissioner Algirdas Šemeta stated, “It is time to reflect on whether the specificity of a monetary union could mean that more has to be done in the field of tax competition,” and Sharon Bowles, the chair of the Committee on Economic and Monetary Affairs (ECON) of the European Parliament, stated, “to many it seems logical that after many steps of European integration some form of closer coordination in tax policy is at least, inevitable, if not desirable.” 29 During one of the many heated moments of the protracted debt crisis, leaders in Germany and France asserted that monetary integration without further fiscal coordination would mean continuing economic problems as well as resentful taxpaying citizens. Additionally, they pledged to pursue corporate tax harmonization bilaterally, hoping to spur a regional movement. 30
For a while, corporate tax harmonization in Europe seemed to have finally become a real possibility. In March 2011, the European Commission proposed the Council Directive on a Common Consolidated Corporate Tax Base (CCCTB). The proposal encouraged companies that conducted business in more than one EU country to file a single return. The base for calculating corporate tax obligations would be the same for all countries, but the rate paid to each country would be determined by a sharing formula. When the European Parliament later considered the proposal, it surpassed the Commission’s enthusiasm, mandating that countries adopt a common corporate tax regime within five years for all companies conducting business activity across national borders. 31 While the European Parliament voted in favor of the CCCTB proposal on the first reading in April 2012, the adoption of the CCCTB stalled once it was taken up by the European Council. 32 Member states could not agree on the specific details of the reform, with many lower tax states continuing to express their opposition. The European Commission and the European Parliament each once again took up the issue of corporate tax coordination in 2015, following some high-profile media coverage of aggressive tax planning and tax evasion. 33 In June 2015, the European Commission announced plans to relaunch the CCCTB and began a period of formal consultations in October. 34 In November 2015, the European Parliament overwhelmingly passed a resolution to reform corporate taxes, improve transparency and reporting by individual member states on how they tax corporate profits, and recommended implementing as soon as possible a mandatory EU-wide adoption of a common consolidated corporate tax base. These efforts may result in regional reform, but there are many political and institutional hurdles remaining. The differences in country-level preferences and interests will continue to confound efforts to find a regional solution to aggressive tax planning across twenty-eight states, in particular because fiscal policy making at the European level requires unanimous approval of all treaty members.
Without a regional solution, downward pressure on CIT rates in Europe is likely to continue. Our analysis suggests that a regional approach may be an appropriate level on which to counter corporate tax competition in Europe, at least in the near term. The data show that corporate tax rates in East Europe are not just lower than rates in West Europe on average, they are lower than global averages, even taking into account a set of economic factors that correlate with low tax rates globally, like country size (in terms of population), country wealth, the extent of foreign trade, and the extent of foreign direct investment. Our analysis shows that the likelihood of a country having a lower tax rate increases when other countries have lower corporate tax rates. In other words, the assertions by worried politicians about European tax rate competition—at least in terms of tax rate emulation—find some support in the data. These results are also consistent with the literature on policy diffusion that finds that states tend to emulate the policy choices of neighboring states within concentrated periods of time. 35
Corporate tax trends in Eastern Europe reflect a widely shared strategy of using low corporate tax rates and other neoliberal policy signals to attract foreign investors. 36 Not all countries in the region are adopting the same strategy to win over investment and not all countries are equally neoliberal in capitalist development. Without a doubt, important variation has emerged in the institutional landscape of post-Communist Europe. 37 Low corporate taxes in particular, however, permeate the fiscal systems in the vast majority of former Communist countries. Given the low levels of domestic capital in former communist countries, their efforts to become more competitive environments for foreign direct investment is understandable. Indeed, it is much easier for Eastern Europe to compete with Western Europe on tax rates than on the quality of infrastructure and productivity advantages. In short, whereas France and Germany see tax competition as harmful to their national interest, Bulgaria and Slovakia see their tax regimes as offering at least some competitive advantage.
Given the overwhelming need to raise domestic capital—regardless of who holds power—it is unsurprising that our data analysis did not show partisan politics significantly affecting corporate tax trends. Granted, domestic politics may have shaped the ease with which leaders could pass corporate tax cuts or the willingness of European politicians to consider fiscal innovations, but there was little to no evidence in our analysis to support the contention that partisan politics drove a country’s move to cut corporate tax rates. In sum, our findings suggest that leaders from countries like Germany and France have been justified in their fears about heightened tax competition on the continent following the Eastern enlargement, and the continued coordination efforts after the recent sovereign debt and financial crises were rational responses to an intensifying EU regional problem.
Footnotes
Appendix A
Appendix B
Appendix Notes
1. C. Bellak, M. Leibrecht, and R. Romisch, “On the Appropriate Measure of Tax Burden on Foreign Direct Investment to CEECs,” Applied Economics Letters 14 (2007): 603–6; C. Bellak and M. Leibrecht, “Do Low Corporate Income Tax Rates Attract FDI?—Evidence from Central-and East European Countries,” Applied Economics 41 (2009): 2691–2703. For an analysis of FDI and corporate tax policy, see R. Gropp and K. Kostial, “The Disappearing Tax Base: Is Foreign Direct Investment Eroding Corporate Income Taxes?” European Central Bank Working Paper Series, Working Paper No. 31 (2000); R. A. DeMooij and S. Ederveen, “Taxation and Foreign Direct Investment: A Synthesis of Empirical Research,” International Tax and Public Finance 10 (2003): 673-693.
2. Bellak et al., “On the Appropriate Measure.”
3. Genschel et al., “Accelerating Downhill”; Ganghof and Genschel, “Taxation and Democracy.”
4. Genschel et al., “Accelerating Downhill.”
5. Note that although Cyprus and Malta are excluded from the regression (since they do not fit into one of the three categories being tested: EU-15, Eastern European, non-EU), they are included in the calculation of the imitation variable since their respective tax rates may influence other countries in the sample. For the same reason, the imitation variable also includes countries that do not have the other regression variables. Since Luxembourg is excluded from the regression for methodological reasons, we do not include it in the imitation calculation. Not shown here, we did perform similar analysis for a variety for imitation variables (i.e., only including countries and years that are in the regression and including all countries for which we have CIT rates, even Luxembourg) the results were all very similar to those shown in Table 2.
6. Appel, Tax Politics in Eastern Europe.
7. Marshall and Gurr, “Polity IV Project.”
8. Keefer, “Database of Political Institutions 2012.”
9. We calculate the DFFITS and DFBETA using the global baseline regression detailed in equation 1.
10. Kutner et al., Applied Linear Statistical Models, 5th ed. (McGraw-Hill/Irwin, 2004), 401, 405.
11. The same countries are eliminated from the European sample, but not all 377 are European.
12. Appel, Tax Politics in Eastern Europe.
Acknowledgements
We would like to thank Ben Ansell, Juliet Johnson, Rachel Epstein, Sven Steinmo, and seminar participants at the European University Institute, Free University in Berlin, McGill University, and Midwest Political Science Association, for the helpful comments and suggestions on earlier drafts of this article. Any remaining errors are our own.