
Abstract
This article discusses political state capture in the context of party patronage. Evidence of this is delivered from state-owned enterprises (SOEs) and the rotations of members of their management and supervisory boards. In this case, it is deemed that an interest group, which consists of politicians and representatives in the government administration, decides about the appointment and dismissal of board members through the corporate governance of SOEs and ownership policy of the state. We analyzed the scale and intensity of rotations in Poland of about twelve thousand joint-stock companies in the years 2001–2017 according to their ownership structure. We show that changes of managers and supervisory board members in state-owned enterprises are higher than in private companies and are related to political elections. We estimated that on average three months after a new government is formed, a peak of changes in the composition of boards is observed, though they are earlier in the case of a supervisory board. We conclude that this can be regarded as an example of state capture by politicians.
Keywords
Introduction
This article aims to explore the phenomenon of the political capture of the state in the context of rent-seeking by politicians. The main mechanisms of political state capture are party patronage and clientelism, 1 which are manifested to a great extent in state-owned enterprises (SOEs). We treat politicians and their representatives in government administration as an interest group that decides the appointment and dismissal of managers by controlling state-owned enterprises. In this way, political elites capture SOEs in order to achieve gains for themselves and their parties, which could decrease economic performance and negatively impact the corporate governance of these companies. Gliniecki and Zaleska-Korziuk claim that the practice of replacing SOEs’ managers and supervisory board members after parliamentary elections seems to be “a bonus for the winning party”; 2 therefore, we expect that such a rotation is related to political elections. In this article, we suggest that the rotations of managers and supervisory board members in state-owned enterprises could be evidence of political state capture. We explore this empirically by introducing a unique and large data set of changes in the composition of the boards of Polish joint-stock companies in 2001–2017.
In this article, we address the following research questions: (1) What is the scale of the changes in composition of management and supervisory boards in Poland? (2) Are there substantial differences in rotations of board members in state-owned enterprises as compared to their privately owned counterparts in Poland? and (3) Is there a relationship between the rotations of board members and political events in Poland?
To assess the political capture of SOEs in Poland, we collected a data set about all the changes in the members of management and supervisory boards in 11,995 joint-stock companies in 2001–2017. Data about the changes were retrieved from the National Court Register. Since we concentrate on SOEs, we checked manually the ownership structure of all companies and also took into account changes of ownership status in the period analyzed. By the end of 2017, our data set covered 9,208 active joint-stock companies, of which 415 were state-owned.
There are a number of reasons why post-socialist countries, inter alia Poland, provide the right environment for such research. Firstly, post-socialist countries, as a result of their initial state weakness and the process of changing their legal and institutional frameworks, have been particularly exposed to rent-seeking behaviour in the form of state capture. Some evidence suggests that ties between politics and business are strong in these countries. 3 Secondly, Szarzec and Nowara show that the scale of SOEs in post-socialist EU member countries appears to be fairly stable and is the effect of purposeful economic and ownership policies. 4 Thirdly, there have been a number of cases where politicians have been observed to seek personal gain and to attempt to benefit their own parties in breach of the principles of corporate governance. 5 Finally, SOEs are treated as “electoral booty” or “political sinecures,” and to make matters worse, the majority of the public fail to recognize such behaviour as reprehensible. 6 Bearing these arguments in mind, political state capture seems to be an experience shared by all post-socialist countries.
We believe that by discussing the issue of capturing SOEs by politicians, we present arguments for the importance of investigating the role of such enterprises in the national economy and their proper management. Through the ownership policy, political elites have a significant impact on the economic performance of SOEs and on introducing good corporate governance in them. 7 Assessing the scale of rotations in state-owned joint-stock companies in Poland since 2001 is particularly important for at least two reasons. First, it enables us to describe the full picture of rotations due to political elections. This seems to be persistent or even increasing. Governments usually justify changes in the management of SOEs in terms of improving economic performance and hiring better managers, but in practice it is not so obvious and meritocracy does not always prevail. Second, by comparing SOEs with private companies, we check whether there are substantial differences in corporate governance between them. If so, this could be determined by political factors.
We contribute to the still very scarce empirical literature on the rotation of management and supervisory boards in SOEs in the context of political state capture. On one hand, this topic is discussed in the literature and in the media, but on the other, there are few empirical studies about the topic because of a lack of data. We present a full picture of changes in management and supervisory boards in Polish state- and private-owned enterprises. Contrary to previous studies that were not peer reviewed, 8 or were limited to a few of the biggest enterprises, 9 our data set is not limited to the largest enterprises in the country but covers the full set of joint-stock companies over a long period of time. What is more, we control for the changes in the ownership status of enterprises (i.e., nationalizations and privatizations) as well as employ a group of privately owned entities as a reference group in order to compare changes of board members due to political elections. This allows us to provide evidence on political state capture based on a solid empirical base. Higher-up changes in the composition of boards in SOEs in comparison to private companies could be explained by political factors.
This article consists of the following sections: following this introduction, in the second section, based on the literature, we discuss state capture in the context of rent-seeking by politicians via state-owned enterprises. In the third section, we introduce the construction of the data set and stylized facts as well as present the scale of changes in the composition of management and supervisory boards, while in the fourth section, we formulate the hypothesis and show our research methodology. In the fifth section, we compare political elections and changes in the composition of boards both in state-owned and private companies. Finally, we draw conclusions.
Political Capture of State-Owned Enterprises: A Literature Review
The concept of state capture has been in use for some time. It was coined in 1999 in a research project conducted by the European Bank for Reconstruction and Development and the World Bank. 10 They used data for post-socialist countries from the Business Environment and Enterprise Performance Surveys (BEEPS) to distinguish state capture from other forms of corruption. Hellman, Jones, and Kaufmann defined state capture as “the efforts of firms to shape the formation of the basic rules of the game (that is laws, rules, decrees and regulations) through illicit and non-transparent private payments to public officials.” 11 In this process, politicians provide rents to firms in return for economic gains. The concept of state capture is derived from that of regulatory capture introduced by Stigler 12 and is an example of collective action in the pursuit of economic rents. 13
The definition proposed by Hellman, Jones, and Kaufmann 14 was regarded as very narrow because they viewed state capture only in terms of businessmen buying favors from political and public officials, so private companies were always the active side in this process. However, there are many examples of state capture and business–political networks in which politicians are the active side of the transaction. Therefore, the definition of the state capture evolved to take into account these cases. 15 In this article, we follow Godinho, Hermanus, and Eberhard and define state capture as “a political-economic project whereby public and private actors collude in establishing clandestine networks that cluster around state institutions in order to accumulate unchecked power, subverting the constitutional state and social contract by operating outside of the realm of public accountability.” 16 In other words, state capture is the system or network of corrupt relations between politicians and firms that creates informal institutions for funnelling influence and private gains by hijacking a state function that had been originally developed to serve the public interest. All this happens at the expense of the general public. This phenomenon is a result of repeated corrupt interactions between businessmen and politicians, which over time get institutionalized and create a set of informal institutions to regulate behaviour, expectations, and opportunities for action. 17 As a result of such state capture, politicians or businessmen gain uncontrolled power to take decisions about access to economic resources, which is not regulated by the laws. What is more important, they do not take any legal or political responsibility for these decisions. In this way, state capture is an example of rent-seeking and is a specific form of grand corruption.
Taking into consideration the active side of the process, two kinds of state capture can be identified: business state capture and political state capture. However, one should remember there is no hard rule to distinguish whether “it is business capturing the state, or the other way around, or both at the same time.” 18 Business state capture is a process initiated by business entities that use corruption to shape the “rules of the game” (legislation and the implementation of legislation) in order to obtain privileged status or preferential treatment. 19 The main mechanisms of business state capture identified in the literature are corruption and influence. 20 Companies bribe politicians or exert influence over them. Business capture is typically associated with weak governments and strong firms. 21 Political state capture is a process in which the active side is state officials or political parties who use the institutions of the state to take hold of business entities in order to extract corruption rents. 22 The main mechanisms of political state capture are party patronage and clientelism. 23 The former involves the allocation of jobs in public institutions such as the civil service or state-owned enterprises in exchange for political loyalty and support. 24 The latter is a phenomenon by which politicians release public resources—such as state subsidies, contracts, legislation—to close friends and political allies. 25
The consequences of state capture are inherently damaging and include poor quality of public services, biased distribution of economic resources, erosion of market competition, slower economic growth, and higher inequality. 26 What is even more important, they are damaging to democracy itself because the unequal and selective distribution of benefits to narrow groups at the expense of others erodes confidence and trust in democracy as a desirable political system. For these reasons, a fight against state capture and all kinds of corruption have been placed high on the agendas of the World Bank 27 or European Union, 28 and of international non-governmental organizations such as Transparency International. 29
Although the literature on state capture from the beginning focused on the post-socialist countries, this specific form of grand corruption can also be identified in other countries 30 where politics and business have very close connections and transparency is lacking. 31 State capture may also be a problem in countries with weak political institutions where the military, ethnic groups, or organized criminal groups are powerful and use the state to extract rents. However, post-socialist countries especially appeared to be a good research group for studying state capture. 32 In these countries, huge institutional change and large-scale privatization of state assets in the 1990s, often leading to a growth in income inequality, was combined with weak legal and political institutions. 33 The fragility of democratic institutions and the state’s poor accountability to the public as well as undeveloped civil society made those countries easily captured by vested interests. 34 There is of course a huge variation in state capture and business–political connections across post-socialist countries. A longer history of sovereignty, stronger civil society, and traditions of democracy, made states less vulnerable to rent-seeking behaviour and capture by a concentrated set of private interests, while concentration of national wealth in a few highly productive assets, especially natural resources, tempted powerful individuals or economic groups to engage in state capture. 35
Studying political state capture can be difficult because this act presupposes informal and hidden relations that can hardly be identified and quantified. It manifests itself in a variety of forms of party clientelism and patronage. Very good evidence of such political–business interactions is provided by state-owned enterprises in which both clientelism and party patronage meet. SOEs represent an asset in which political elites exploit the state and collect different kinds of economic rents. Based on the literature, we identify the following examples of SOEs being used by politicians (so-called political capture of SOEs):
– offering jobs in SOEs to people associated with the ruling political party or their families; 36
– offering positions in management and supervisory boards of SOEs to people with political connections; 37
– financing political parties or electoral campaigns; 38
– a complete replacement of members of the management and supervisory boards of SOEs before elections in order to receive high severance payments, and after having won parliamentary elections by the new ruling party;
– employing people associated with the ruling political party or their families in private companies that regularly provide services (e.g., in the consulting and marketing sector) to SOEs; 39
– influencing the selection of private partners cooperating with SOEs and providing them services (e.g., in the consulting and marketing sector); 40
– increasing salaries in SOEs after winning parliamentary elections with no increases in productivity;
– financing by SOEs (directly or indirectly via foundations established by them) of various social and cultural events and the provision of “red carpet” treatment to politicians; 41
– influencing the choice of non-governmental organizations cooperating with SOEs;
– credits given from state-owned banks to companies owned or governed by political supporters of a government or a party; 42
– increasing lending from state-owned banks to companies in election years; 43
– displaying higher rates of job creation and lower rates of plant destruction in election years; 44
– increasing construction permits issued by municipal government in the run-up to elections, in order to distribute patronage and to boost economic performance; 45 and
– overstaffing in order to limit unemployment and maintain social peace and political support. 46
In this article, we are interested in the rotation of managers and supervisory board members in the state-owned enterprises that we regard as examples of political state capture. The reasons for changes in the composition of management and supervisory boards could be various. 47 Among them, there are poor unsatisfactory economic performance of a company, a change of a company’s owner, voluntary departures of members, or termination of a contract. They occur in all companies notwithstanding the ownership structure. There are no premises in the literature that these reasons cause rotations in SOEs more often than in POEs or vice versa. However, in the case of SOEs, political factors appear. Positions in management and supervisory boards of SOEs are regularly filled by the clients of politicians who manifest their loyalty. This is a common experience of post-socialist and developing countries, in which the quality of institutional environment is low. Anecdotal evidence indicates that SOEs are treated as “political sinecures” or “electoral booty.” 48 This practice provides an opportunity for milking SOEs through various channels. When politicians and representatives in the government administration decide on the appointment and dismissal of managers through the corporate governance of SOEs, it is called party patronage. It means that jobs in the public and semi-public sectors are allocated at the discretion of political parties. This phenomenon is an example of “party rent-seeking within the state” and is known in the literature as the capture of the state by parties. It relates to the extent to which parties penetrate and control the state and use public offices for the purposes of party organizational building and advancement. 49 If this political factor causes rotation in the managements and supervisory boards in SOEs, then these rotations will be higher in SOEs than in POEs.
The literature on senior management turnover and executive successions is large. However, it is concentrated on management turnover in the private sector, bureaucracy, or government agencies. 50 There are many papers on rotation in the composition of the boards of private and state-owned enterprises in which rotation is discussed more in the context of economic performance than as evidence of political state capture. 51 However, there are only a few studies about the rotation of management and supervisory boards in SOEs in the context of political state capture. The main reason for this is the lack of data. Therefore, most researchers discuss case studies rather than present a more comprehensive and quantitative approach. Kopecký et al. proposed a way of measuring party patronage based on face-to-face interviews with respondents familiar with patronage practices in different policy areas and different sets of state institutions. 52 Their results were presented in many articles 53 and have been recently updated and extended to cover 22 countries. 54 One indicator introduced by them measures party patronage concerning jobs in the public and semi-public sectors (not only in SOEs) and does not cover Poland. The political capture of SOEs was investigated in a project titled “State-Owned Enterprises—Preventing Corruption and State Capture” presented by a consortium of six NGOs financed by the European Commission. The authors published reports about SOEs in three post-socialist countries: Bulgaria, 55 the Czech Republic, 56 and Romania, 57 They delivered case studies and presented recommendations about corporate governance. Volintiru et al. showed that in the fourteen largest companies in Romania in 2008–2017, changes in management boards were correlated with political elections. 58 Ennser-Jedenastik explored the impact of political determinants on the survival of managers in eighty-seven SOEs in Austria between 1995 and 2010. The results strongly support the proposition that partisan affiliation drives managerial survival. 59 Kim and Hong explored whether changes in political leadership affect the survival of chief executive officers (CEOs) of eighteen South Korean SOEs during 2000–2015. 60 They demonstrated that political change is significantly associated with CEO turnover, even in the presence of institutional systems designed to achieve political insulation. Kuzman et al., using a data set of two hundred SOEs in six countries of the former Socialist Federal Republic of Yugoslavia from 2010 till 2014, found that board member changes within SOEs are politically motivated rather than performance induced. 61 They revealed that SOEs with higher levels of board member changes demonstrate lower productivity and profitability levels. The political capture of SOEs and public institutions in Poland was analyzed by Kopińska. 62 It is a case study of the personnel policy in SOEs and public institutions after the latest political election (November 2015–October 2017). There is also some empirical evidence of rotations in SOEs. However, those analyses are based on a very limited number of enterprises. Błaszczak analyzed changes of CEOs for the forty-two largest SOEs in Poland from 2001 to 2018. 63 Skuhrovec collected data on all the changes of supervisory board members of 150 major SOEs in the Czech Republic from 2001 to 2012. 64 Peaks in personnel changes in SOEs are reported in the first year after an election. 65
The Changes in the Composition of Management and Supervisory Boards: Data Set Construction and Stylized Facts
In eleven Central-Eastern European (CEE) countries, in spite of the privatization processes, the state has remained a significant owner of (mainly large) enterprises, most of them being of socialist origin. According to the estimate made by Matuszak and Szarzec (2020) in 2015, there were 239 majority and minority very large non-financial companies owned by the national government. 66 They had a share of 19 percent in total operating revenue and 35 percent in total assets of all very large enterprises in any given country. According to the number of SOEs, Poland leads with seventy-three companies, followed by Slovenia (twenty-eight), Romania (twenty-five), Hungary (twenty-three), and the Czech Republic (twenty-one). 67 It shows that the state is still a significant player in the national economy of the CEE countries, though the scale of state ownership varies. Therefore, the competence of management is of great importance for the economic performance of SOEs and their contribution to economic development.
The national model of corporate governance and the ownership policy of the state have an impact not only on the efficiency of SOEs but also on the possibility of political capture of SOEs. 68 Corporate governance in Poland is based on a two-tiered Continental-European model. In this model, the management board runs the day-to-day operations and is controlled by the supervisory board. The supervisory board is mainly responsible for reviewing and evaluating strategies and major business decisions, hiring management board members, and determining their compensation. 69 It is responsible for selecting management board members with the most desirable competencies who will run the company according to the best interests of the stakeholders. 70
According to Polish law, management board members are appointed and dismissed by a supervisory board but can be also dismissed or suspended by a general meeting of shareholders. Members of the supervisory board are appointed by a general meeting of shareholders. These regulations refer to POEs and SOEs as well. However, in the case of SOEs, additional regulations have to be applied. SOE management board members have to fulfil requirements indicated in the Act on Rules of State Property Management. 71 According to this, the management board member has to have higher education, be employed for at least five years, and have at least three years of experience in managerial or expert positions. He or she cannot be an employee or volunteer in the bureau of members of the lower or upper chamber of the parliament or the European Parliament, belong to a political body representing the party or be a political party employee, and cannot have been elected to a position in the company’s trade union organization. According to the law, candidates for an SOE supervisory board need to have higher education, be employed at least for five years, or have certified qualifications. He or she cannot be employed by the company, be a shareholder in the subsidiary, be employed by the subsidiary, perform activities that are in conflict with the duties of a supervisory board member or could be seen as harboring bias or self-interest, or cause a conflict of interest with company’s activities. Moreover, candidates for an SOE supervisory board have to receive a positive opinion from the Committee for Companies with the Treasury Shareholding and State Legal Entities (Rada do spraw spółek z udziałem Skarbu Państwa i państwowych osób prawnych), which was created only in 2016. Its main aim is to improve corporate governance in SOEs and reduce nepotism. All these restrictions shape corporate governance of SOEs in Poland. However, they are regarded as “extremely soft,” and the law enables a deep politicization of SOEs’ corporate governance. They do not prevent politicians from treating positions in supervisory and management boards as electoral booty, and they are tempted to offer them to political supporters and members of their families. As a result, decisions in SOEs are often driven by non-economic factors. There is still space for the political capture of SOEs, which is a serious economic problem.
To assess the political capture of SOEs in Poland, we combined two sources of information: (1) one about changes in the composition of the management and supervisory boards in joint-stock companies and (2) the other concerning the ownership structure of companies. As a result, we developed a large and unique data set about changes within the ownership structure of each company over the period of 2001–2017. We proceeded as follows.
First, we collected data about all the changes in the composition of the management and supervisory boards in financial and non-financial joint-stock companies in 2001–2017 in Poland. A “change” is defined as an appointment or a dismissal of a member of the management or the supervisory boards. It is an important distinction since in the literature on corporate governance 72 the term turnover is commonly used and is defined as the replacement of one person by another on the management board, in particular, top executives. In our research, we focused on the scale of rotating so that we analyzed all changes of board members, not only replacements. Therefore, we also included cases when a board is enlarged and a new person is appointed or a person is dismissed and her or his position falls vacant for some period.
Data about changes were retrieved from the Polish National Court Register (NCR). The NCR is a centralized, electronic database in which the registration of a new entity and changes of important details of an entity are subject to report according to the Polish Commercial Companies Code. It covers all changes in the composition of the management and supervisory boards of any given joint-stock company. Initially, our data set covered 12,512 companies in which at least one change in the composition of the boards occurred in 2001–2017. We decided to exclude 407 companies in liquidation and 110 sports clubs. The former is connected with the fact that bankruptcy proceedings distort the rotation of managers, and the latter is justified by a firmly held opinion that changes depend on sports results rather than the economic situation. Our data set ultimately covered 11,995 companies.
Secondly, we supplemented the data set with information about the dates (month and year) of registration of a company in the National Court Register, and of removal from the Register (when a company closed their business). Based on this information, we describe companies as active or non-active depending on their operating status in any given month of the period of 2002–2017. 73
Thirdly, we checked the ownership structure of all companies. The classification of enterprises as state-owned is non-trivial because of the different definitions of state ownership and the various means that the government uses to influence the companies. 74 We applied the following two definitions of an SOE. The majority state-owned enterprises are defined as entities in which the state holds directly or indirectly an ownership stake of more than 50 percent (SOE50). The minority state-owned group consists of enterprises with at least 25.01 percent up to 50.00 percent of a state ownership stake, and a dominant position of state shareholders and a dispersed ownership structure (SOE25). When we treat these two groups combined, we indicate them as an SOE. Privately owned enterprises (POEs) are controlled by private entities. Companies were classified manually, considering both direct and indirect state ownership. We used official company reports, information provided by the Ministry of the Treasury of the Republic of Poland, the Amadeus database, 75 and EMIS. 76 In such cases where the data on the ownership structure differed between sources, the official reports were decisive. Because of privatizations and nationalizations, the ownership structure of several companies changed in the period of 2001–2017 from an SOE into a POE (and vice versa). In order to track these changes, we constructed a Privatization/Nationalization Database in Poland from 2001 onwards. The main sources were the following: the data set designed by Szarzec, Dombi, and Matuszak, 77 the official website of the Ministry of the Treasury of the Republic of Poland, 78 the Privatization Barometer data set, 79 and the World Bank privatization data set. 80 We identified 171 cases of privatizations and 18 cases of nationalizations in total where the ownership structure changed significantly (between SOE50, SOE25, and POE).
Applying a monthly basis enables us to consider changes of status from an active to a non-active company and also changes in structure due to privatization and nationalization. We assigned an ownership status (POE, SOE25, SOE50) to each active company in each month. At the end of 2017, our data set covered 9,208 active privately owned enterprises, 82 minority SOEs, and 333 majority SOEs. 81
Finally, we combined all the aforementioned information in the month-long intervals into a data set including the appointments and dismissals of members of the management and supervisory boards, a company’s registration and removal dates, and the ownership structure of companies (considering also its changes). There are 11,995 joint-stock companies in total in our data set, the majority of them being privately owned. Since some companies were established or dissolved during the period analyzed, the panel employed in this study is unbalanced. Therefore, we decided to apply a “company–month unit” that encompasses the number of active companies in a month. 82 We calculated the total number of company-months for POE, and the majority and minority SOEs. Subsequently, we estimated how often in a month a change in the composition of management or supervisory boards occurs on average. We did this by dividing the number of changes by the number of company-months. Taking into account the ownership structure, our results are presented in Table 1.
Changes in the Composition of Boards in the Years 2001–2017 by Ownership Structure

Source: Authors’ calculation based on the National Court Register.
The number of companies is expressed in company-month units (any company in any given month).
In total, in our data set we have 1,303,207 company-months and 204,636 changes in the composition of the boards of companies in the period of 2001 to 2017. Among them, 145,646 changes occurred in the composition of the supervisory boards and 58,990 changes in the composition of the management boards. In the Polish joint-stock companies, the average number of changes per company per month is 0.112 and 0.045, respectively. In the case of the SOEs, shareholders made 23,904 changes in the composition of the supervisory boards, and afterwards, they took decisions to make 8,433 changes in the composition of the boards of directors.
Subsequently, we compared the scale of changes depending on the ownership structure. POEs account for 93.4 percent of the total company-months and SOEs for 6.6 percent. Comparing these observations with the changes, we observe that the share of changes in the POEs is lower and amounts to 83.6 percent in the case of supervisory boards and 85.7 percent in the case of management boards. At the same time, these shares in SOEs are 16.4 percent and 14.3 percent, respectively.
We investigated the relationship between the scale and frequency of changes in the composition of boards and political elections or prime minister replacements in Poland. In the period of 2001–2017 in Poland, five parliamentary elections were held (marked as E1–E5 in Table 2). Only in one case (E4) was the government formed by the ruling coalition parties. Since 2001, nine prime ministers (PMs) have been designated by Parliament.
Political Elections and Prime Minister Replacements in Poland (2001–2017)

Source: Authors’ construction.
Note: PM = prime minister; SLD = Democratic Left Alliance; PiS = Law and Justice; PO = Civic Platform.
We performed a study of the distribution of changes in the composition of the boards in SOEs between 365 days before the election and 365 days after (Figure 1) to discuss the link between elections and changes of board members in SOEs.

Histograms of changes in the composition of the boards in SOEs before and after elections
Dismissals and appointments on the boards of SOEs could not only be determined by political elections but also by a change in the position of who is the prime minister. We can argue that a prime minister has also some partisans whom he or she wants to gratify. Changes of a prime minister that are not induced by changes of a ruling coalition are not just changes of a person; they reflect shifts in the balance of power between fractions within the ruling political class, changes in the political strategy, etc. According to this, we analyzed whether the rotation of managers and supervisory board members in SOEs are related to the nine cases of changes of prime ministers. We studied the distribution of changes in the composition of the boards in SOEs six months before and after the replacement of a prime minister (Figure 2).

Histograms of changes on boards in SOEs before and after any change of a prime minister
We compared the frequency of changes of managers and supervisory board members between SOEs and POEs. We estimated the average number of changes per company in each month of the research period. For each month, we computed an SOE–POE ratio by dividing the average number of changes in the SOEs by the average number of changes in the POEs. We argue that the global economic situation faced by any given company in Poland was similar notwithstanding its ownership structure, so we could expect similar activities. The SOE–POE ratio enables us to reduce the impact of external factors, such as the business cycle or seasonality of changes in the boards. The ratio equals 1 when there are no differences between the SOE and the POE. If the ratio is higher (lower) than 1, it means that the scale of changes is higher (lower) in the SOEs than in the POEs.
In Figures 3 and 4, we present the average numbers of changes in the composition of the supervisory and management boards of joint-stock companies according to their ownership structure in any given month. We also indicate the dates of political elections and prime ministers’ replacements.

Average number of changes in the composition of management boards per company in any given month

Average number of changes in the composition of supervisory boards per company in any given month
Based on those stylized facts, we show that the scale of rotation on boards can be related to either political elections or prime ministers’ replacements. There are peaks in the changes of the supervisory and management board members after all parliamentary elections and prime ministers’ replacements. However, in the case of the fourth election (E4) the scale of changes was the lowest because the ruling coalition remained in power for a second term of office. The SOE–POE ratio is above 1 permanently, which shows a higher scale of changes on the boards of SOEs than on POEs.
Hypotheses and Research Methodology
The literature review in the second section as well as the stylized facts presented in the third section led us to design a quantitative study of differences in the intensity of changes in the composition of boards between SOEs and POEs, controlling for the different political events. We formulated the following research hypotheses:
Hypothesis 1: The scale of changes in the composition of management and supervisory boards is higher in state-owned enterprises than in private-owned ones.
Hypothesis 2a: The number of changes in the composition of management and supervisory boards of state-owned enterprises increases after parliamentary elections.
Hypothesis 2b: The number of changes in the composition of management and supervisory boards of state-owned enterprises increases after prime ministers’ replacements.
We used two methods to assess the political capture of SOEs in Poland. The first is the t-test to verify equality of means of the average number of changes in the composition of SOE and POE boards. We estimated the statistic t using formula proposed by Welch (1947) due to unequal variances in the both groups. We calculate as follows: 83

where
The second method is the difference-in-differences (also called diff-in-diff or DID, or DD) approach. 84 Zhou et al. showed that the diff-in-diff can be used when two periods of data are available at least for two groups. 85 The DID calculation allows the comparison of differences in outcomes before and after a “treatment” between groups which can (“treated” group) and cannot (“control” group) be affected by the treatment. 86 The DID estimator measures the treatment effect by comparing the difference between the average outcome in the control and treated groups over time. 87
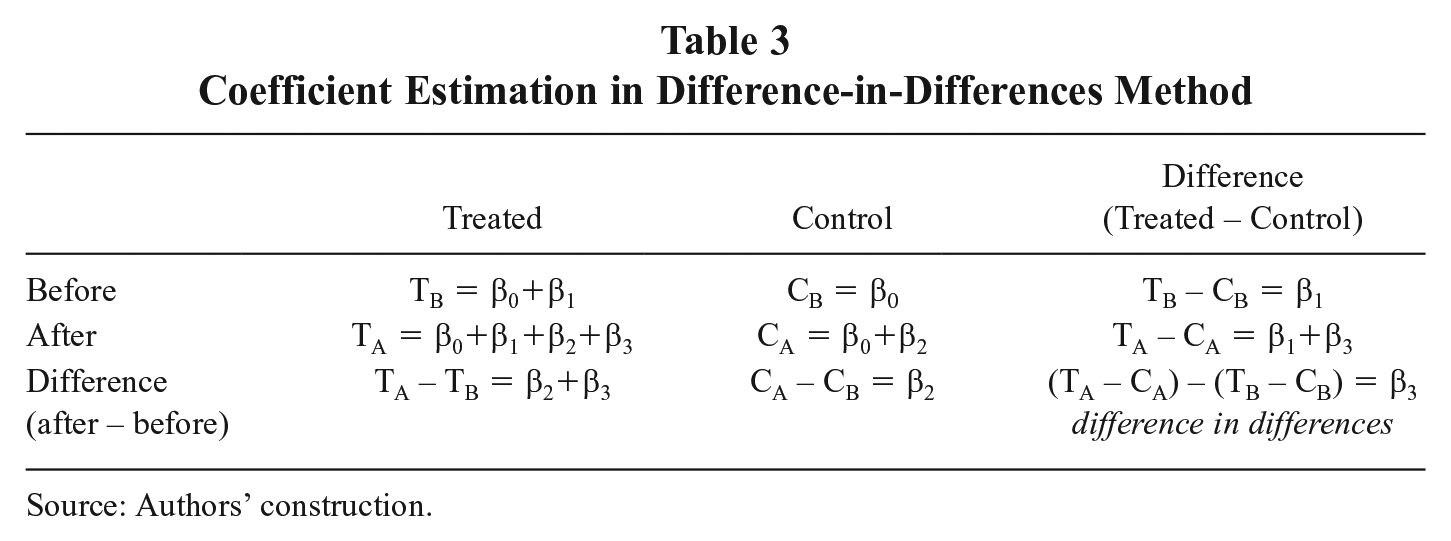
We used parliamentary elections and prime minister replacements as a treatment (threshold). Each of the elections or replacements is regarded as a “political event.” There were five political elections and nine prime ministers’ changes in Poland in the years 2001–2017 (see Table 3). All Polish joint-stock companies were divided into the two groups: state-owned enterprises (a treated group) and private-owned enterprises (a control group). Every appointment or dismissal in the composition of management and supervisory boards is defined as one change.
Coefficient Estimation in Difference-in-Differences Method
Source: Authors’ construction.
The DID method allows us to measure the difference between the treated (SOEs) and control (POEs) groups, of the differences in the number of changes in the composition of boards before and after any political event. Using this method, we investigate whether there are any differences in the scale of boards’ composition changes between SOEs and POEs (hypothesis 1). We also study the difference in differences before/after parliamentary elections (hypothesis 2a) and prime minister replacements (hypothesis 2b). To test the research hypothesis, we run diff-in-diff models and estimate the following equations:

where rot is the number of rotation, i = company, own = binary value for ownership structure (0 = control group, POE; 1 = treated group, SOE), and pc = binary value for the treatment (0 = before political event, 1 = after political event).
We calculate also coefficients for the control and treated groups before and after political events (see Table 3).
Based on that, we can compare the intensity of rotations between SOEs and POEs before any political event, which is characterized by β1 coefficient (TB – CB), as well as after (β1+β3 or TA – CA). The difference-in-differences effect is represented by β3, or (TA – CA) – (TB – CB), coefficient.
Results and Discussion
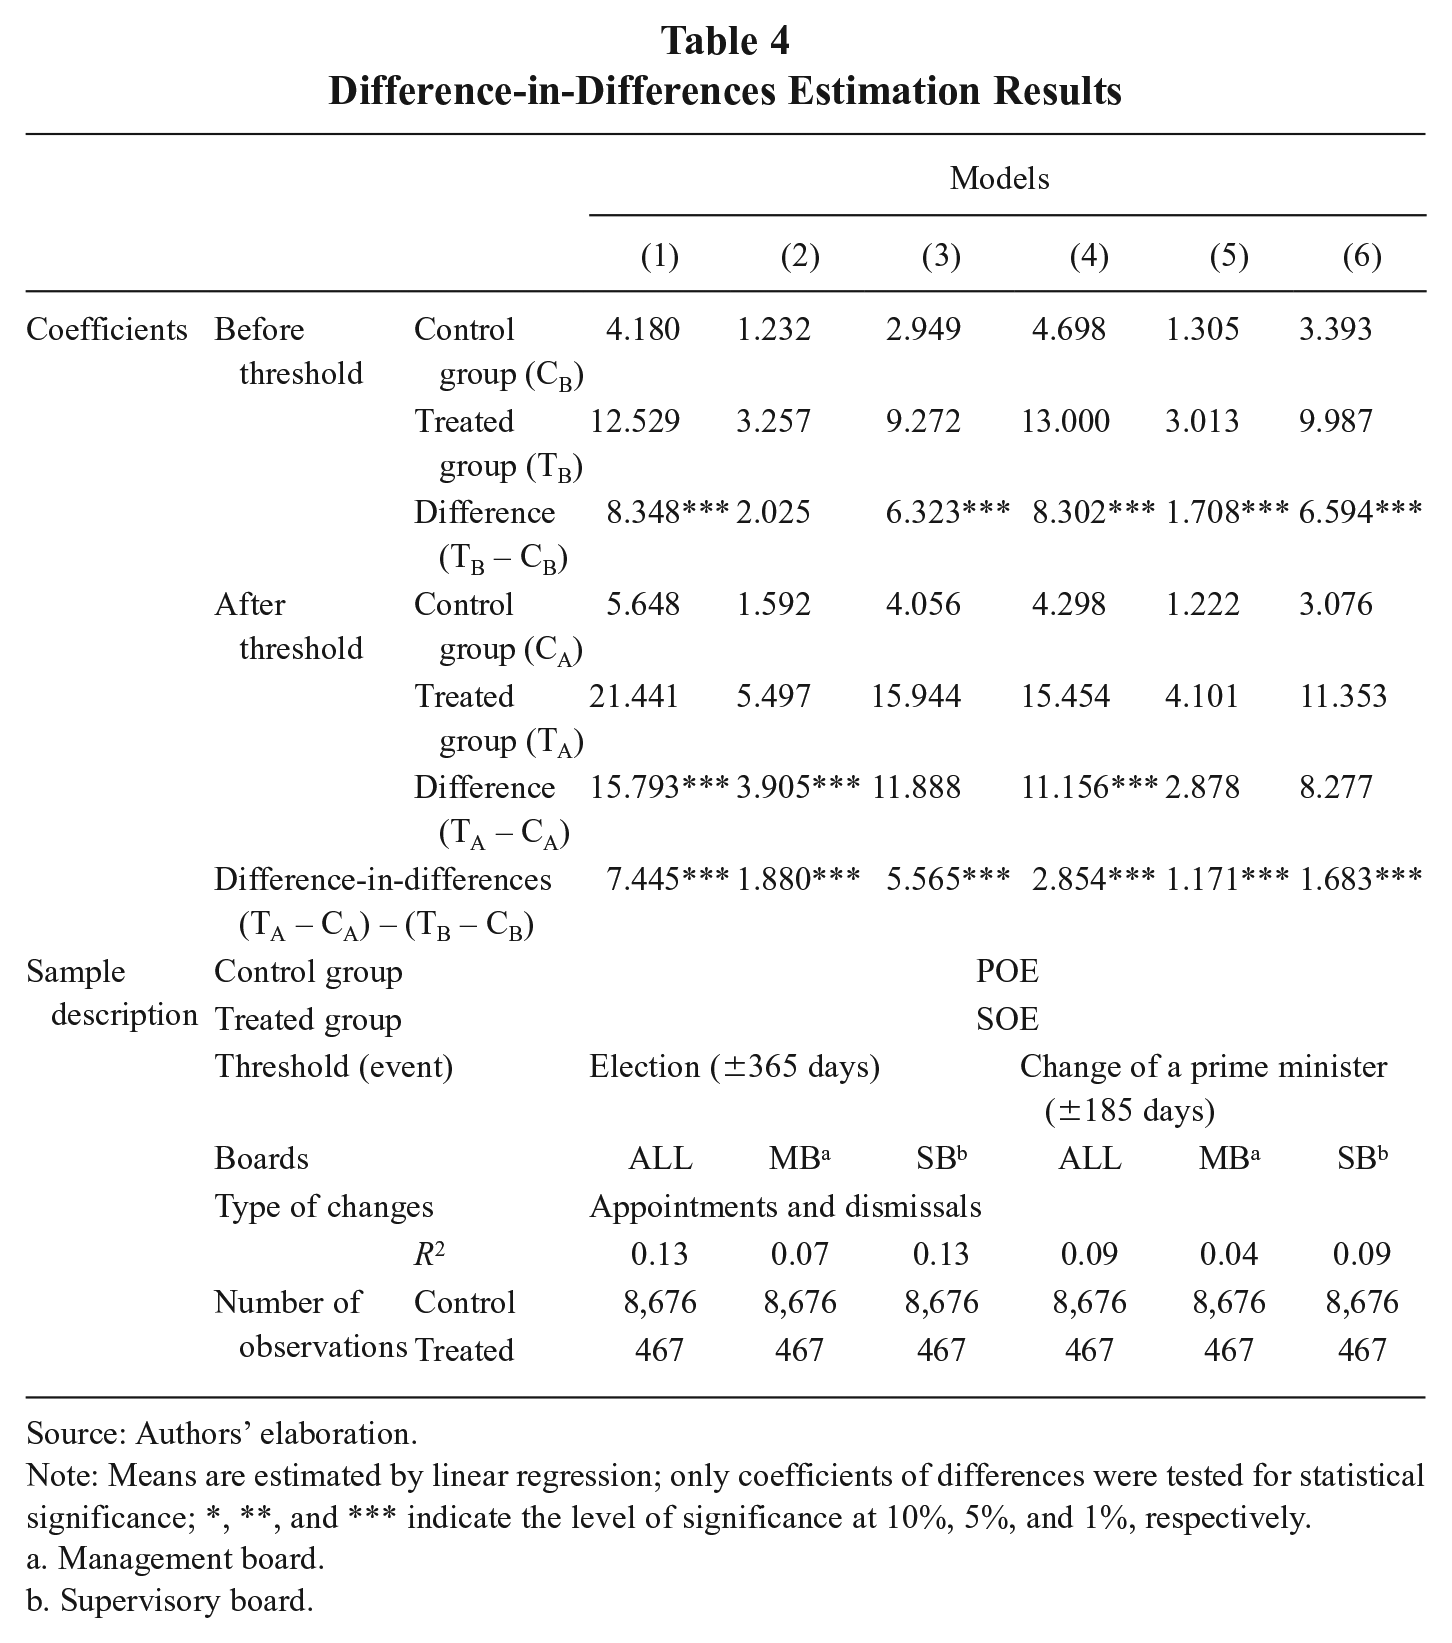
This section presents the results of the baseline estimates of equation (2). We estimate 6 basic models in which we use the number of changes in the composition of boards (the sum of appointment and dismissal cases), and two different thresholds (parliamentary elections and prime minister replacements) to find the difference-in-differences effect. It was estimated by using all changes in the composition of boards as well as limited to management boards or supervisory boards. The results of econometric analysis are presented in Table 4. The main interest is in the “(TA – CA) – (TB – CB)” coefficients that represent a diff-in-diff effect. The positive and significant coefficients mean that the number of changes in the composition of boards in SOEs increases after political events.
Difference-in-Differences Estimation Results
Source: Authors’ elaboration.
Note: Means are estimated by linear regression; only coefficients of differences were tested for statistical significance; *, **, and *** indicate the level of significance at 10%, 5%, and 1%, respectively.
Management board.
Supervisory board.
We tested the following three hypotheses.
Hypothesis 1: The scale of changes in the composition of management and supervisory boards is higher in state-owned enterprises than in private-owned ones.
The higher frequency of changes in SOEs in comparison to POEs exists permanently, 88 both before and after political events, which is represented by positive TB – CB and TA – CA coefficients in DID equations, respectively. The results are stable and statistically significant at the 1 percent level. Moreover, changes in the composition of boards are more intense in the supervisory boards rather than in the management boards. We can guess that after political elections, the winning party decides to replace members of the supervisory boards. Subsequently, these new members dismiss the old top executives and appoint new ones.
We also employed Welch’s t-test to check if (on average) changes in the composition of the boards per one company-month occur significantly more frequently in the SOEs than in the POEs, both in case of supervisory and management boards. 89 The difference in means of the changes per one company in SOEs and POEs is significantly different from zero at the 1 percent level. Based on the results of diff-in-diff estimations and Welsch’s t-test, the scale of changes is higher 90 in the SOEs than the POEs, so hypothesis 1 cannot be rejected.
Hypothesis 2a: The number of changes in the composition of management and supervisory boards of state-owned enterprises increases after parliamentary elections.
We ask the question about the diff-in-diff effect between SOEs and POEs before and after parliamentary elections. All types of changes, for example, the sum of appointments and dismissals, were considered. We use the total number of changes in the boards’ composition (model 1) as well as limited to management boards and supervisory boards separately (model 2 and model 3, respectively). All “(TA – CA) – (TB – CB)” coefficients are positive and significant at the 1 percent level, indicating a higher number of changes in SOEs after the elections. The composition of the diff-in-diff effect shows that the intensity of changes after parliamentary elections is much higher in the supervisory boards (β3 = 5.57) than in the management boards (β3 = 1.88). Therefore, we cannot reject hypothesis 2a.
Based on the distribution of changes in the composition of the boards in SOEs we revealed differences between the intensity of changes before elections and after (Figure 2). The frequency of changes decreases either in the composition of supervisory boards or management boards just after elections (approximately in the first three months) and grows rapidly in the next months. It reaches a maximum in the period between six and twelve months after any given election. The low intensity could be explained by the fact that during the very first months the prime minister and ministers responsible for SOEs are more focused on taking power and changes in the top personnel in ministries rather than on changes in the composition of the boards of SOEs. This is consistent with the results of Błaszczak and Skuhrovec indicating peaks in rotations in the first year after a political election. However, our results are more precise since we show that they happen mostly in the nine to ten months after elections.
High up changes also take place on the supervisory boards of SOEs about three to four months before a new political election. An explanation could be that a ruling party and government afraid of losing elections want to secure high severance payments to as many of their partisans as possible. These payments are offered to old dismissed members and to new ones appointed just before the election who could expect to be dismissed by a new government. Such a pre-election effect is not ascertained in the case of the management boards of SOEs. It could be explained by referring to the required skills and experience of members of both boards. While a member of a supervisory board could be less qualified, a manager’s lack of sufficient competence could be quickly manifested in a worsening economic performance in any given SOE. Therefore, positions on supervisory boards are more susceptible to be rotated by politicians’ decisions and filled by political supporters.
Hypothesis 2b: The number of changes in the composition of management and supervisory boards of state-owned enterprises increases after prime ministers’ replacements.
We repeated the same research methodology (see hypothesis 2a) in diff-in-diff analysis to test hypothesis 2b by using the change of a prime minister as a threshold (models 4–6). Again, all the diff-in-diff coefficients turned out positive and significant, which means that a higher number of changes in the composition of both boards occurred in SOEs than in POEs after prime ministers’ replacements. The higher rotation in supervisory boards (β3 = 1.68) than in management boards (β3 = 1.17) is still observed, but the difference between them is much lower in comparison to parliamentary elections as a threshold. All positive and significant diff-in-diff coefficients do not allow us to reject hypothesis 2b.
An analysis of the distribution of changes in the composition of boards in SOEs before and after prime ministers’ replacements (Figure 3) confirmed that the scale of changes is related to this kind of political event. The frequency of changes is higher after a new prime minister takes office. Changes on boards start to be made after about three months after this. 91 What is important and unsurprising, is that the average scale of changes on boards caused by the replacement of a prime minister is lower than in the case of political elections. This is consistent with the results of DID estimates.
Furthermore, we estimated 16 robustness-check models (see Appendix B) with controlling state ownership structures (all SOEs and majority SOEs), boards of the company (management board and supervisory board, separately), and types of changes (appointments and dismissals, separately). All difference-in-differences coefficients are positive and statistically significant at the 1 percent level. That confirms the stability of our results.
Those results confirm the belief that changes in the boards of Polish SOEs are driven more by political reasons than economic ones. It is evidence of the capture of a state by political elites. They are also consistent with the results of the analysis of the largest SOEs in Poland. 92 There is also a widespread recognition in Polish society that SOEs are treated as a justified political trophy for the newly elected candidates and partisans of any given political party. One argument for this notion could be a statement made by the former President of Poland Aleksander Kwaśniewski (1995–2005). He criticized the present government and politicians from the ruling party Law and Justice and accused them of unacceptable changes in the Constitutional Tribunal, restrictions on the courts’ independence and capturing the public media. At the same time, he claims, “I am not accusing them [politicians from the party Law and Justice—authors’ note] of having offered jobs in state-owned enterprises to their own people. I’m disgusted by it; however, under Polish conditions it has become a tradition. It was also done by PO (Civic Platform) and SLD (Democratic Left Alliance).” 93 Bearing this in mind, it is clear that capturing SOEs by rent-seeking politicians has become a sanctioned tradition of taking the spoils after winning elections. Moreover, changes to the composition of the boards of SOEs became an informal institution that was commonly recognized and accepted.
Conclusion
We investigated the phenomenon of political state capture in the context of state-owned enterprises. We claim that SOEs are a place where party patronage and clientelism meet each other, which is the case for many post-socialist countries. Ruling politicians can capture SOEs in many ways in order to achieve gains for themselves and their parties. One important piece of evidence for this is the changes that occur in the composition of the management and supervisory boards of SOEs. To assess political state capture, we used a full sample of all rotations on the supervisory and management boards of Polish joint-stock companies in 2001–2017. We estimated the scale and provided details of these changes.
Having compared SOEs with private companies, we identified substantial differences in the scale of changes of the members of supervisory and management boards. The frequency of rotation in SOEs is higher than in privately owned companies. Members of SOEs’ supervisory boards are more frequently replaced than members of boards of directors. We showed that the rotation of managers and supervisory board members in SOEs is connected with political elections and changes of prime ministers. After such political events, it is only SOEs that experience a tornado on their boards while private companies “stay calm.” On average, the number of changes starts to grow at three months and reaches its maximum at about the 10th month after political elections. It enables us to claim that rotations in SOEs seem to be an endemic problem in Poland and that SOEs are vulnerable to political capture. Meritocracy has not been accepted in Poland and instead has been treated as a useful ideology, without any real attempt to apply it. An important fact is that this process is not dependent on any ruling political party, even though the high number of rotations after the latest political election exceeded the previous ones.
The results of our study are consistent with previous research; however, we used a larger and more complete database about changes in the composition of boards in all the joint-stock companies in Poland. Moreover, we considered changes in the ownership structure and operating periods of companies. It made it possible to give a full view of the scale of changes and to compare them in time and between companies.
The analysis of rotation in the composition of supervisory and management boards in Polish joint-stock companies provides directions for further research, particularly about the relations between changes on boards and the economic performance of companies and the profiles of board members according to their sex, age, and experience. All these issues can be analyzed with reference to the ownership structure (majority or minority state-owned and private companies).
Footnotes
Appendix A
• Two-sample t-test with unequal variances (board of directors [BD])
• Two-sample t-test with unequal variances (supervisory board [SB])
Appendix B
Robustness Check for Difference-in-Difference Estimations (Part 2)

| Models | ||||||||||
|---|---|---|---|---|---|---|---|---|---|---|
| (15) | (16) | (17) | (18) | (19) | (20) | (21) | (22) | |||
| Coefficients | Before threshold of period | Control group (CB) | 0.573 | 0.659 | 1.428 | 1.521 | 0.602 | 0.703 | 1.645 | 1.748 |
| Treated group (TB) | 1.445 | 1.667 | 4.455 | 4.604 | 1.286 | 1.545 | 4.799 | 4.963 | ||
| Difference (TB – CB) | 0.872*** | 1.008*** | 3.027*** | 3.084*** | 0.684*** | 0.842*** | 3.154*** | 3.215*** | ||
| After threshold of period | Control group (CA) | 0.733 | 0.858 | 1.952 | 2.104 | 0.567 | 0.655 | 1.468 | 1.608 | |
| Treated group (TA) | 2.463 | 2.799 | 7.423 | 7.677 | 1.843 | 2.055 | 5.109 | 5.373 | ||
| Difference (TA – CA) | 1.730*** | 1.940*** | 5.471*** | 5.573*** | 1.276*** | 1.400*** | 3.641*** | 3.765*** | ||
| Difference-in-difference (TA – CA) – (TB – CB) | 0.857*** | 0.932*** | 2.443*** | 2.489*** | 0.592*** | 0.558*** | 0.488*** | 0.551*** | ||
| Sample description | Control group | POE | ||||||||
| Treated group | Majority SOE (SOE50) | |||||||||
| Threshold (event) | Election (±365 days) | Change of a prime minister (±185 days) | ||||||||
| Boards | BoD a | SB b | BoD a | SB b | ||||||
| Type of changes | Appointments | Dismissals | Appointments | Dismissals | Appointments | Dismissals | Appointments | Dismissals | ||
| R 2 | 0.05 | 0.05 | 0.11 | 0.11 | 0.03 | 0.03 | 0.07 | 0.07 | ||
| Number of observations | Control | 8,676 | ||||||||
| Treated | 402 | |||||||||
Source: Authors’ elaboration.
Note: Means are estimated by linear regression; only coefficients of differences were tested for statistical significance; *, **, and *** indicate the level of significance at 10%, 5%, and 1%, respectively.
Board of directors.
Supervisory board.
Acknowledgements
The authors would like to thank all the participants of the 15th Biannual Conference of the European Association for Comparative Economic Studies (Warsaw 2018) and the WEAI 2019 International Conference in Tokyo, in particular Professor Martin Spechler.
Funding
This work was supported by the National Science Centre Poland [grant number 2015/17/B/HS4/00327].