



Abstract
Special education teacher (SET) burnout is a significant concern, especially for SETs serving students with emotional–behavioral disorders (EBD), as they tend to experience higher burnout than other teachers. Working conditions, especially social support, have the potential to ameliorate burnout, but prior research has not articulated the sources and types of social support that are most important. The authors conducted a longitudinal study, surveying 230 SETs serving students with EBD at three time points across one school year. Data revealed administrative support, adequacy of planning time, and autonomy in fall predicted emotional exhaustion and personal accomplishment in winter and spring. Associations between working conditions and burnout components were partially mediated by SETs’ perceptions of workload manageability. SET change in well-being due to COVID-19 during the early months of the pandemic was not associated with burnout. The authors discuss implications, limitations, and directions for future inquiry.
Keywords
Special education teachers (SETs) often experience personal satisfaction, joy, and strong personal connection with students (Bettini et al., 2021). Despite the benefits of being in the field of special education, these educators are at high risk of burnout (Brunsting et al., 2014; Jones & Youngs, 2012). Many teachers intermittently encounter high stress and harbor negative feelings toward their profession, but those who have these emotions acutely or frequently experience burnout (Maslach, 2017). When work stress overcomes teachers’ ability to cope, they feel emotionally exhausted, cynical, or unaccomplished (Maslach, 2017). Burnout is concerning because it predicts negative personal, professional, and student outcomes (Brunsting et al., 2014). Teachers with burnout experience health problems, such as musculoskeletal pain and depression (Armon et al., 2010; Bianchi et al., 2013), and SETs experiencing burnout are more likely to plan to quit or leave the profession, increasing the likelihood students will have an inexperienced teacher (Billingsley et al., 2020; Cumming et al., 2020).
Furthermore, emotional exhaustion and burnout are associated with lower treatment integrity of interventions and lower use of evidence-based instructional practices and classroom management techniques (Cumming et al., 2020; Gilmour et al., 2021; Oakes et al., 2021). For example, Domitrovich et al. (2015) found teachers who were more burned out implemented fewer Good Behavior Games—an evidence-based intervention to support student engagement—and Gilmour et al. (2021) revealed higher SET burnout was associated with lower observed classroom management scores. Thus, teacher burnout has consequences for students. Indeed, students of burned-out teachers are less motivated, meet individualized education program goals less often, and have lower academic achievement (Madigan & Curran, 2020; Shen et al., 2015; Wong et al., 2017). Ameliorating burnout is crucial to improving SET well-being and career longevity as well as students’ engagement, motivation, and learning (Brunsting et al., 2014).
Ameliorating burnout is especially important for SETs of students with emotional–behavioral disorders (EBD), as these students have a high risk of poor outcomes (Kauffman & Landrum, 2018) and need effective support (Campbell et al., 2018). Students with EBD display challenging externalizing behaviors (e.g., defiance), internalizing behaviors (e.g., anxiety), or both (Kauffman & Landrum, 2018). Burnout of SETs of students with EBD appears to be higher than other educators, including other special educators (Brunsting et al., 2021; Nichols & Sosnowsky, 2002). This high level of burnout may arise from challenges supporting student behavioral needs, including frequent disruption (Garwood et al., 2018; Skaalvik & Skaalvik, 2017), suboptimal working conditions (Bettini, Cumming et al., 2020), or a combination thereof (Bettini, Cumming, et al., 2017).
Supportive working conditions have the potential to buffer against and attenuate the high burnout SETs of students with EBD often experience (Bettini, Cumming, et al., 2017; Billingsley & Bettini, 2019). Working conditions encompass both demands on SETs (e.g., addressing challenging behavior) and resources (e.g., social support) to meet those demands (Billingsley et al., 2020). Social support from administrators, colleagues, and paraprofessionals may be a key resource for ameliorating burnout, as social supports increase the ability to cope with stress from challenging behavior (Herman et al., 2020). Indeed, social support is associated with SETs’ outcomes (e.g., Jones et al., 2013), including among SETs serving students with EBD (e.g., Albrecht et al., 2009). Prior research has not examined the influences of varied types and sources of social support on burnout concurrently. Thus, to better understand how working conditions can support SETs’ well-being, we designed the current study to address this gap by longitudinally examining the impact of types and sources of social support, as well as some demands and logistical resources, on burnout among SETs serving students with EBD.
Integration of Conservation of Resources and Self-Determination Theories in Understanding Burnout
We conceptualize the current study by integrating conservation of resources theory (Alarcon, 2011) with self-determination theory (Ryan & Deci, 2000).
Conservation of resources theory
Conservation of resources (COR) theory proposes individuals strategically use resources to meet job demands (Alarcon, 2011). When individuals have the resources necessary to meet job demands, they can manage their workloads and so experience better outcomes (e.g., lower burnout). Conversely, when resources at one’s disposal are inadequate to meet work demands, one may feel overwhelmed by an unmanageable workload and experience worse outcomes. Scholars have researched COR theory extensively in a wide range of professions, and its tenets have been well-supported by meta-analyses (Alarcon, 2011; Halbesleben, 2006).
In special education, Bettini and colleagues have used conservation of resources theory in a series of studies of SETs, obtaining results consistent with the theory (e.g., Bettini, Gilmour et al., 2020). For example, Bettini, Cumming et al. (2020) surveyed a national sample of SETs serving students with EBD in self-contained settings and found, consistent with COR theory, SETs who experienced higher demands reported workloads were less manageable and experienced greater emotional exhaustion. Conversely, those who experienced stronger social resources (e.g., administrative support) and logistical resources (e.g., adequate planning time) rated workloads more manageable and experienced less emotional exhaustion. Based on research on the supports facilitating SETs’ efforts to meet their job demands, these scholars organize resources in three categories: social (e.g., administrative support), logistical (e.g., planning time), and informational (e.g., formal mentoring; Bettini, Cumming et al., 2020) resources. We use conservation of resources theory to conceptualize the range of factors contributing to burnout.
Self-determination theory
We drew on self-determination theory to conceptualize which types of social support may attenuate SETs’ burnout. Self-determination theory posits individuals have innate needs for autonomy, competence, and relatedness (Ryan & Deci, 2000). People feel more agentic, are motivated, and experience better psychological well-being when they can act with volition (i.e., autonomy), when they feel effective at managing their environment (i.e., competence), and when they feel connected to other people (i.e., relatedness; Ryan & Deci, 2000). Self-determination is assessed by measuring perception of needs directly (e.g., autonomy) or by measuring support of needs (e.g., autonomy support).
Autonomy support is comprised of helping teachers retain decision-making power and increasing their ability to operate independently (e.g., taking the perspective of the teacher and helping think through challenges; Reeve, 2009). Autonomy support is associated with decreased teacher emotional exhaustion and increased work engagement (Collie et al., 2018); yet, the effects of autonomy support on SETs’ burnout are unexamined (Brunsting et al., 2014). Competence support includes appraisal support (i.e., providing feedback) and instrumental support (i.e., facilitating efforts to meet demands; Malecki & Demaray, 2003). Although no studies have examined the effects of these forms of support on SETs’ burnout (Brunsting et al., 2014), Cancio et al. (2013) found SETs’ ratings of administrator guidance and feedback were associated with their job satisfaction. Emotional support enhances relatedness through empathy and shared caring for an individuals’ well-being (Ryan & Deci, 2000). SETs who report receiving emotional support from administrators, colleagues, and paraprofessionals plan to teach longer (e.g., Lόpez-Estrada & Koyama, 2010), although studies have not examined the association between SETs’ emotional support and their burnout directly (Brunsting et al., 2014).
Special Educators’ Burnout
In a systematic review, Brunsting et al. (2014) identified 23 studies of SET burnout from 1979 to 2013, seven of which tested relationships between working conditions and burnout. These studies consistently found SETs who experienced stronger support, whether from supervisors, administrators, or colleagues, were less likely to experience burnout. Extending this review, Park and Shin (2020) meta-analyzed 41 studies of SET burnout across multiple countries. They collapsed sources of support (e.g., administrators and colleagues) and found SETs reporting stronger social support had better outcomes across all three dimensions of burnout (Park and Shin, 2020). Cross-sectional studies confirm these findings among a national sample of SETs serving students with EBD; SETs who reported higher administrative support had lower emotional exhaustion (Bettini, Cumming et al., 2020; Cumming et al., 2020).
These reviews also identified important gaps in extant research. No studies articulated specific dimensions of social support (e.g., emotional support and appraisal support) related to SETs’ development of burnout. Rather, most studies included only broad support constructs (e.g., administrative support; Zabel & Zabel, 2002), often using a single item to address one of several different aspects of support. This is a key limitation, as knowing the type of support that contributes to burnout is essential for providing guidance on how to target supports to prevent SET burnout (Park & Shin, 2020). Second, all extant studies were cross-sectional; there appear to be no longitudinal studies of factors ameliorating SETs’ burnout. In a recent study with the same sample and data as the current study, we examined (a) the interrelation of SETs’ dimensions of burnout across three time points in the school year as well as (b) differences between burnout levels of SETs serving students with EBD and a national sample of educators (Brunsting et al., 2021). The current study extends this inquiry, providing the field with an initial examination of the impact of perceptions of working conditions on SETs’ burnout longitudinally.
Purpose and Hypotheses
We designed this study to examine which working conditions may buffer or exacerbate burnout among SETs serving students with EBD across time, to provide leaders and policy makers with clear guidance for supporting these SETs. The present study addresses gaps in research on how working conditions relate to burnout, by (a) using a longitudinal design to test temporal precedence between working conditions and burnout and to examine associations while controlling for prior burnout and (b) examining both sources and types of social supports. Based on conservation of resources theory (Alarcon, 2011) and self-determination theory (Ryan & Deci, 2000), as well as prior research on how working conditions relate to SETs’ outcomes (e.g., Billingsley & Bettini, 2019; Brunsting et al., 2014), we propose the following hypotheses:
Method
Participants and Setting
Study participants were 230 SETs teaching students with EBD in schools within 114 schools in 15 public school districts in the United States (see Table 1 for participant information). Our sample was similar to another recent national sample of SETs serving students with EBD with respect to race/ethnicity, gender, and experience (O’Brien et al., 2019).
Participant Demographic Information.
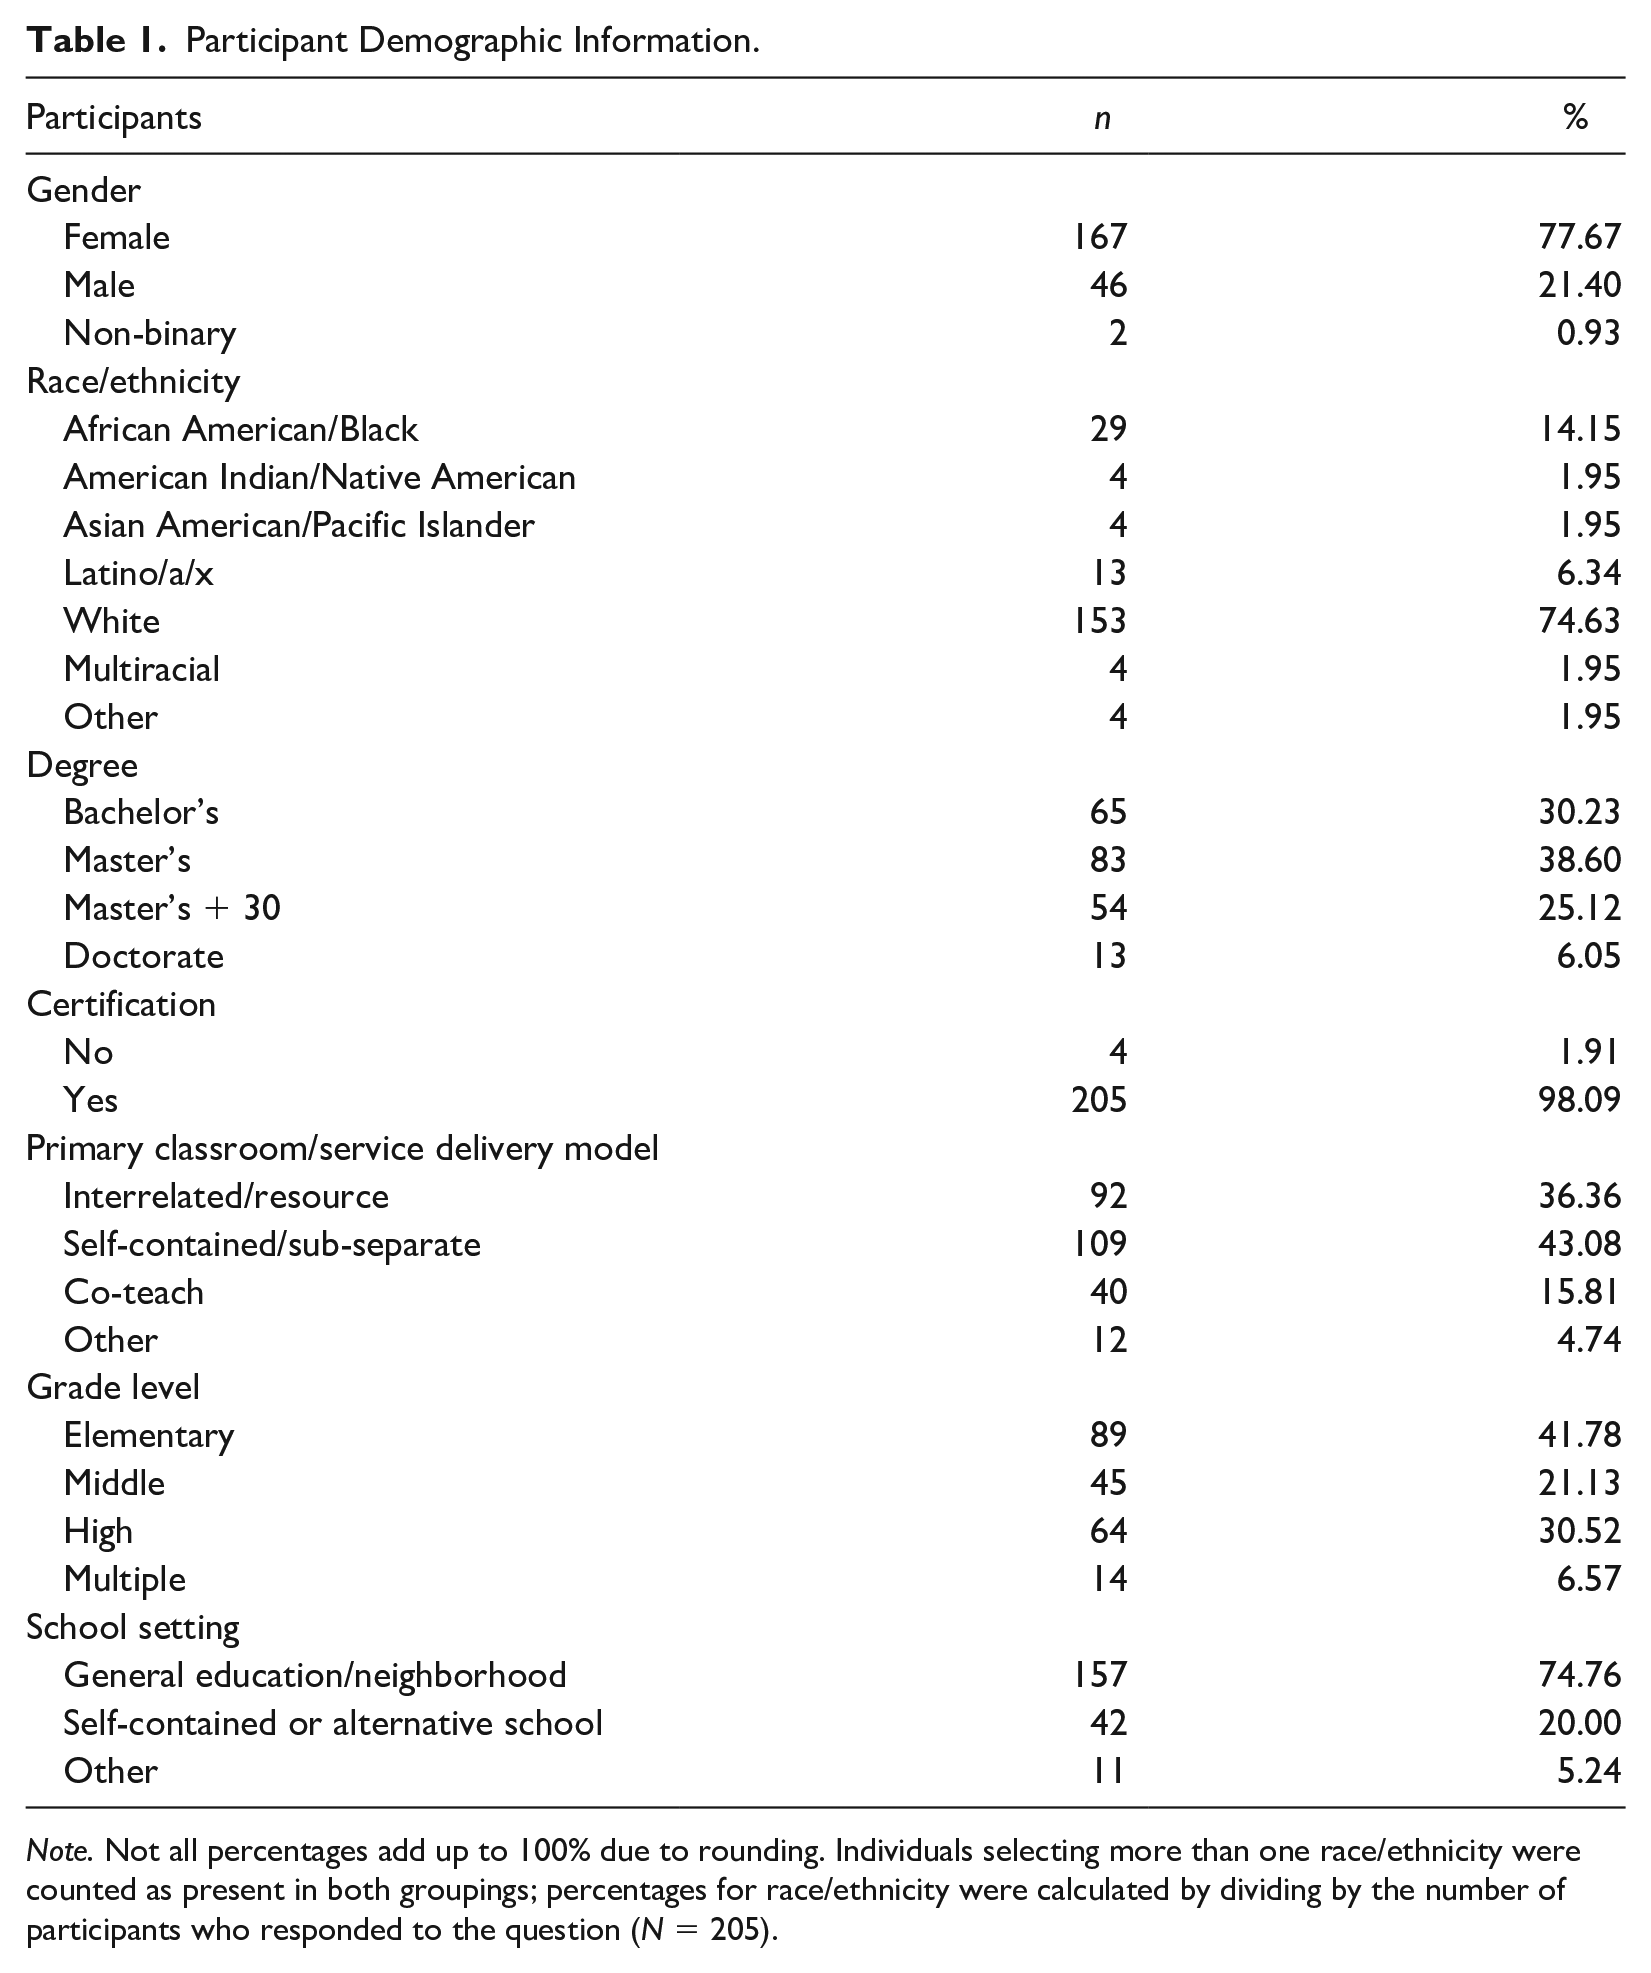
Note. Not all percentages add up to 100% due to rounding. Individuals selecting more than one race/ethnicity were counted as present in both groupings; percentages for race/ethnicity were calculated by dividing by the number of participants who responded to the question (N = 205).
Sampling and District Recruitment
To obtain a nationwide randomized sample at the school district level, we generated a sampling frame of public school district information from the Common Core Dataset and created four strata by region of the country: Midwest, Northeast, South, and West. We also stratified by student enrollment: very large (33,553+), large (10,474–33,552), medium (3,523–10,473), and small (25–3,522; O’Brien et al., 2019), generating 16 sub-strata. After assigning districts a random number, we sampled 100 (6–7 per stratum) with the highest numbers in their sub-stratum. Research team members invited district special education leaders to the study via email and calls. For each district in which leaders declined participation, we contacted the district in their sub-stratum with the next highest random number. To increase the likelihood of participation, we offered to provide participating districts with 10+ participants (to ensure confidentiality) a report including their district average score and the national sample total score on constructs. In all, 15 districts participated, 3 agreed but did not participate, and 101 declined or did not respond. To examine differences between participating and non-participating districts, we calculated Welch’s t-tests for district demographic characteristics; it is important to note the participating districts were more racially diverse (e.g., African American 15.10% vs. 10.56%; Latino/a/x 27.78% vs. 17.96%), although we detected no significant differences (see Appendix). Within participating districts, student race/ethnicity averaged 15.10% Black, 0.52% American Indian, 6.25% Asian American, 27.78% Latino/a/x, 47.64% White, and 2.45% two or more races; 34.46% received free or reduced lunch; 11.00% received English language services; and 12.88% received special education services. Participating districts were in varied locations: 13.33% Midwest, 13.33% Northeast, 40.00% South, and 33.33% West, paralleling U.S. district statistics of roughly 20%, 20%, 40%, and 20%, respectively (O’Brien et al., 2019). Participating districts also varied by size: 26.67% small, 26.67% medium, 33.33% large, and 13.33% very large.
Teacher Participant Recruitment
District administrators provided our team a list with names, district email addresses, and schools of all SETs serving at least one student with EBD. Districts had between 1 and 190 potential participants. District contacts shared an email with potential participants in their district explaining the purpose of the study and expressing district support. Potential participants received an email from Qualtrics with study information and a link to the consent letter and survey. To increase participation, we offered invitations to webinars on study results and a US$10 gift card for completing the survey at all time points. SETs were asked whether they (a) were SETs serving one or more students with EBD and (b) consented to participate. Those responding no to either question were thanked and exited from the survey. Those responding yes to both questions progressed to the survey. We sent another email to non-responders a week later. For non-responders to emails, we mailed a consent letter, survey, self-addressed stamped envelope, and a US$2 bill as an incentive to complete and return the consenting letter (and survey if consented). The teacher response rate was 54.65% (282/516) and the consent rate was 44.57% (230/516). In all, 72.17% of participants consented via the online survey, with 27.83% consenting via mail.
Timeline and Procedure
We received approval from the first author’s institutional review board and subsequently received interagency agreements and approvals from the institutions of other study personnel prior to beginning the study. We registered study hypotheses with Open Science Framework prior to data analysis with T1 data; we registered the longitudinal study method prior to data analysis with T2 or T3 data. The study design was a cohort-sequential longitudinal study, and the data for the current article are drawn from the first cohort. Survey administrations for the first cohort occurred in October 2019 (T1), January 2020 (T2), and April 2020 (T3). We contacted T1 participants at T2 and T3 following the same procedure as at T1. The participation rate was 66.52% (153/230) at T2 and 62.87% (127/202) at T3, noting research moratoriums in two districts as a response to COVID-19 precluded 28 SETs from participating at T3. School responses to COVID-19 started March 12, 2020, after collection of T2 data and prior to T3. We added a measure of perceived changes in well-being during COVID-19 (Skinner & Lansford, 2020) at T3. We assessed demographics, demands, and resources at T1 and on burnout at all timepoints. The survey contained 110 items and participants averaged about 15 minutes to complete at T1; T2 and T3 surveys contained 34 and 58 items, respectively, and completion time averaged 5 and 8 minutes. We do not include data from the second cohort, as the increased challenges of COVID-19 in the 2020–2021 academic year impacted district participation and did not allow for an accurate assessment of “usual” working conditions for teachers.
Measures
We measured participants’ demographic information, demands, resources, and affective outcomes, each of which we describe in more detail subsequently. For latent constructs (e.g., curricular resources, administrator support), we evaluated model fit using confirmatory factor analysis. All models met minimum fit thresholds (i.e., nonsignificant chi-square or root mean square error of approximation [RMSEA] <.10 and comparative fit index and Tucker–Lewis index >.90; Kline, 2015). We do not provide these statistics due to space limitations, but they are available upon request; we do report reliability (Cronbach’s α) of all latent constructs.
Demographic information
We asked SETs about their race/ethnicity, gender, age, level of school taught (e.g., elementary), teacher certification, and highest degree earned.
Demands
We provided multiple questions to understand teacher demands, including the number of paraprofessionals supervised and the number of students with EBD in teachers’ classes. Participants responded by entering a whole number for each of these categories in a similar manner to another recent national survey (O’Brien et al., 2019).
Social resources
To capture social resources, the current study included scales measuring four different types of social support from up to three sources: administrators, colleagues, and paraprofessionals. We defined administrators as the SETs’ “administrators as a whole, which includes your principal, assistant principals, and district-level individuals with whom you interact (e.g., district special education director, district BCBA).” Colleagues were defined as “other teachers at your school,” and paraprofessionals were defined as “the paraprofessionals (paras) you work with in your classroom.” All response options were provided as 5-point Likert-type scales ranging from 1 = strongly disagree to 5 = strongly agree.
Autonomy support
Autonomy support was designed to capture the degree to which teachers perceive understanding, assistance, and acknowledgment from superiors to engender choice and ownership over the classroom, students’ development, and/or program for students with EBD (Reeve, 2009). We adapted 6 items from the Perceived Autonomy Support Work Climate Questionnaire (PAS-WCQ; Baard et al., 2004), such as, “My administrators try to understand how I see things before suggesting a new way to do things.” We only assessed autonomy support from administrators at T1; the scale demonstrated high (α = .93) reliability.
Emotional support
Emotional support measured the degree to which teachers perceive others care about and value them and their work. We adapted 4 items from Bettini et al.’s (2020) administrative support measure and the Administrative Support Scale (Balfour, 2001) to capture the construct, using items such as, “My administrators think that my work is important.” The scale demonstrated high reliability at T1 for administrators (α = .83), colleagues (α = .77), and paraprofessionals (α = .80) at T1.
Appraisal support
We conceptualized appraisal support as guidance, advice, or feedback designed to enhance teachers’ skills and efficacy (Malecki & Demaray, 2003). We adapted a 5-item appraisal support scale from the Guidance and Feedback subscale of an administrative support measure (Cancio et al., 2013). An example item was “My administrators offer constructive feedback after observing my teaching.” We assessed appraisal support from administrators, as administrators are responsible for formally and informally evaluating SETs’ work. We also assessed appraisal support from paraprofessionals, although paraprofessionals are not responsible for evaluating SETs or providing them with feedback because SETs who serve students with EBD report being very isolated from all other educators, except for paraprofessionals (e.g., Bettini, Wang et al., 2019; O’Brien et al., 2019). Because these SETs often work closely with paraprofessionals but not with other educators, they could consider feedback from their paraprofessionals who know their students well as more relevant than appraisal support from other sources, and thus this was important to measure. The scale had high reliability at T1 for administrators (α = .91) and paraprofessionals (α = .89).
Instrumental support
Instrumental support encompasses assistance on work tasks that require teamwork, collaboration, or follow-up (Malecki & Demaray, 2003). We adapted a 10-item measure of instrumental support from an 8-item administrative support measure (Bettini, Cumming et al., 2020; O’Brien et al., 2019) and from the Guidance and Feedback subscale of the administrator support scale (Cancio et al., 2013). An example item was “My administrators include me in disciplinary decisions for my students.” We assessed instrumental support from all three sources (i.e., administrators, colleagues, and paraprofessionals). We removed items from colleague and paraprofessional scales not applicable for the source (e.g., “My administrators provide standards for my performance” was not assessed from colleagues or paraprofessionals). The instrumental support from colleagues scale consisted of 5 items; the instrumental support from paraprofessionals scale had 8 items. The scale demonstrated high reliability at T1 for administrators (α = .92), colleagues (α = .86), and paraprofessionals (α = .93).
Logistical resource: Planning time
We used a 3-item scale of planning time adequacy (O’Brien et al., 2019). Response options were provided on a 5-point Likert-type scale (0 = never to 4 = always; e.g., I have adequate time scheduled for planning and preparation). Scale reliability at T1 was high (α = .72).
Autonomy
Autonomy is the extent to which teachers have autonomy over their own classroom (Reeve, 2009) and is distinct from autonomy support, in that it represents autonomy itself, rather than support for autonomy. To capture autonomy, we adapted a 6-item autonomy scale from O’Brien et al. (2019). The stem read “How much control do you have in your classroom over the following areas of your planning and teaching?” with items representing different aspects of SETs’ work, such as “disciplining students.” Response options ranged from 0 = no control to 4 = complete control. We omitted the item “choosing student incentives/ reinforcers” due to possible conflation with school resources available for materials. Reliability was high (α = .82) at T1.
Affective outcomes
Workload manageability
We measured workload manageability using a 5-item workload manageability scale from Bettini, Cumming et al. (2020) to capture the degree to which SETs viewed completing their work responsibilities with the available time and resources as feasible. An example item was “I have time to teach without administrative duties/paperwork interfering.” Response options ranged from 1 = strongly disagree to 5 = strongly agree. Scale reliability was high (α = .84) at T1.
Burnout
We measured burnout using the 22-item Maslach Burnout Inventory—Educator Scale (Maslach et al., 1996), which contains three subscales with a range of internal consistency across three time points: emotional exhaustion (α = .91, .93, .95), depersonalization (α = .65, .62, .66), and personal accomplishment (α = .76, .77, .77). Example item: “I feel emotionally drained from work.” Response options are on a 7-point Likert-type scale, from 0 = never to 6 = every day.
Changes in well-being during COVID-19
Participants at T3 completed the Changes in Well-Being during COVID-19 subscale of the COVID-19 Experiences measure (Skinner & Lansford, 2020). Example items, both reverse-scored: “I get in more arguments now than I did before the outbreak” and “I am more anxious now than before the outbreak.” SETs responded on a 4-point scale from 1 = strongly disagree to 4 = strongly agree. High scores represent better wellbeing. Scale reliability was high (α = .74).
Data Analysis
We prepared data for latent growth curve modeling (LGCM), growth mixture modeling, and structural equation modeling (SEM) by examining for departures from univariate and multivariate normality. A few items exceeded recommendations for skewness and kurtosis (+/− 2 and +/− 5; Bowen & Guo, 2012). We considered log and Box-Cox transformations for skewness; however, given construct averages were not skewed nor were the parcels created for LGCM and SEM skewed, we left them untransformed. We identified no multivariate outliers (e.g., Mahalanobis values < .001). We retained the full depersonalization subscale of burnout to align with prior published research and because the scale has been maintained on the well-researched MBI with documented reliability in the .60 to .70 range.
We examined missing data structure using Little’s MCAR test on data from participants who completed surveys at all time points; the test was non-significant (p = .095). Thus, we concluded data were missing at random and imputed data using full information maximum likelihood (FIML; Little, 2013). As covariance coverage values all were > .40, well above the recommended minimum of .10 (Muthén & Muthén, 2020), we chose to impute missing data to decrease the likelihood of errors in generalization (Little, 2013). To account for teachers nested in districts, we calculated intraclass correlation coefficients (ICCs) to examine outcome variance due to districts. ICCs ranged from 0% to 7.68%, with only two > 2%; thus, we omitted clustering at the district level. Because the majority of participants were the only or one of only two participants within 114 schools, clustering at the school level was not possible. We created parcels for each construct with 5 or more items by selecting items at random to parcel together (Little, 2013); this permitted us to maintain a case-to-item ratio > 5:1 and estimate latent constructs for all variables of interest. We ran three analyses, one for each burnout dimension. We used Mplus (Muthén & Muthén, 2020) for analyses.
Results
To examine how SETs’ working conditions, including different types and sources of support, predict their burnout, we conducted a longitudinal survey. LGCM models did not meet minimum thresholds for model fit (e.g., entropy above .70); thus, we deemed the data did not support LGCM or growth mixture modeling and conducted longitudinal panel SEMs to examine the potential influence of working conditions on SETs’ burnout across the school year. Thus, we tested hypotheses H1b, H2b, and H3b. We first generated measurement models for the predictor variables at T1 to ensure strong item loadings. Next, we tested measurement invariance of burnout constructs across time in separate analyses to ensure they passed configural and weak invariance, which they did (i.e., RMSEA within 90% confidence interval [CI] and comparative fit index [CFI] within .01; Little, 2013); we did not expect models to pass strong invariance as we anticipated differences in means over time (see Table 2). We then generated a full SEM for each dimension of burnout with all parameters between constructs and restricted non-significant parameters until we obtained the best model fit using Hu and Bentler’s (1999) recommendation: RMSEA < .06, CFI/Tucker–Lewis index (TLI) > .95, standardized root mean square residual (SRMR) < .08.
Model Fit Progression Examining Influence of Working Conditions on Dimensions of Burnout Across Time.

Note. Dim. = dimension; RMSEA = root mean square error of approximation. CFI = comparative fit index; DP = depersonalization; EE = emotional exhaustion; PA = personal accomplishment.
Generating the Measurement Model for Working Conditions at T1
To ensure reliability of our adapted measures of social support as well as extant measures of other working conditions, we created a measurement model with all predictors at T1. All item loadings for each construct were high (> .35). In building the measurement model, we noted the four constructs of administrative support (autonomy support, emotional support, appraisal support, instrumental support) shared standardized covariances (range: .738–.913) and appeared to load onto a single factor. We thus created single-item scores for each administrative support variable and loaded them onto a single administrative support factor; the model had good fit. We repeated this process for the three types of paraprofessional support (emotional, appraisal, and instrumental); final predictor measurement model fit was good:, χ2(209) = 373.46, p < .0001, RMSEA = .061, 90% CI: .051, .071; CFI = .936; TLI = .923; SRMR = .061. See Figure 1 for the resulting model used for the three longitudinal SEMs, one for each burnout dimension.

Full panel structural equation model for each construct of burnout (emotional exhaustion provided as an example).
Longitudinal SEM: Working Conditions and Emotional Exhaustion
Invariance testing revealed emotional exhaustion passed invariance testing across the three time points. It was not anticipated emotional exhaustion would pass strong invariance, as we expected the mean scores to change across time. Standardized loadings for emotional exhaustion ranged from .793 to .939. After viewing the measurement model to ensure all factors had strong loadings (> .40), we generated the full model with all parameters set and removed non-significant paths one-by-one while examining model fit until we obtained the best-fitting model (see Table 2). The final structural model had good fit, χ2(249) = 393.16, p < .0001, RMSEA = .050; 90% CI: .041, .059; CFI = .957, TLI = .949, SRMR = .065 (see Figure 2). Due to lack of significant associations, teacher emotional support, teacher instrumental support, paraprofessional support, and changes in well-being during COVID-19 were removed from the model as we sought parsimony. Workload manageability fully mediated the relationships between autonomy, planning time, and administrative support at T1 and emotional exhaustion at T2 such that higher administrative support and autonomy, and more adequate planning time, were linked with higher workload manageability at T1 and lower emotional exhaustion at T2 (see Table 3).
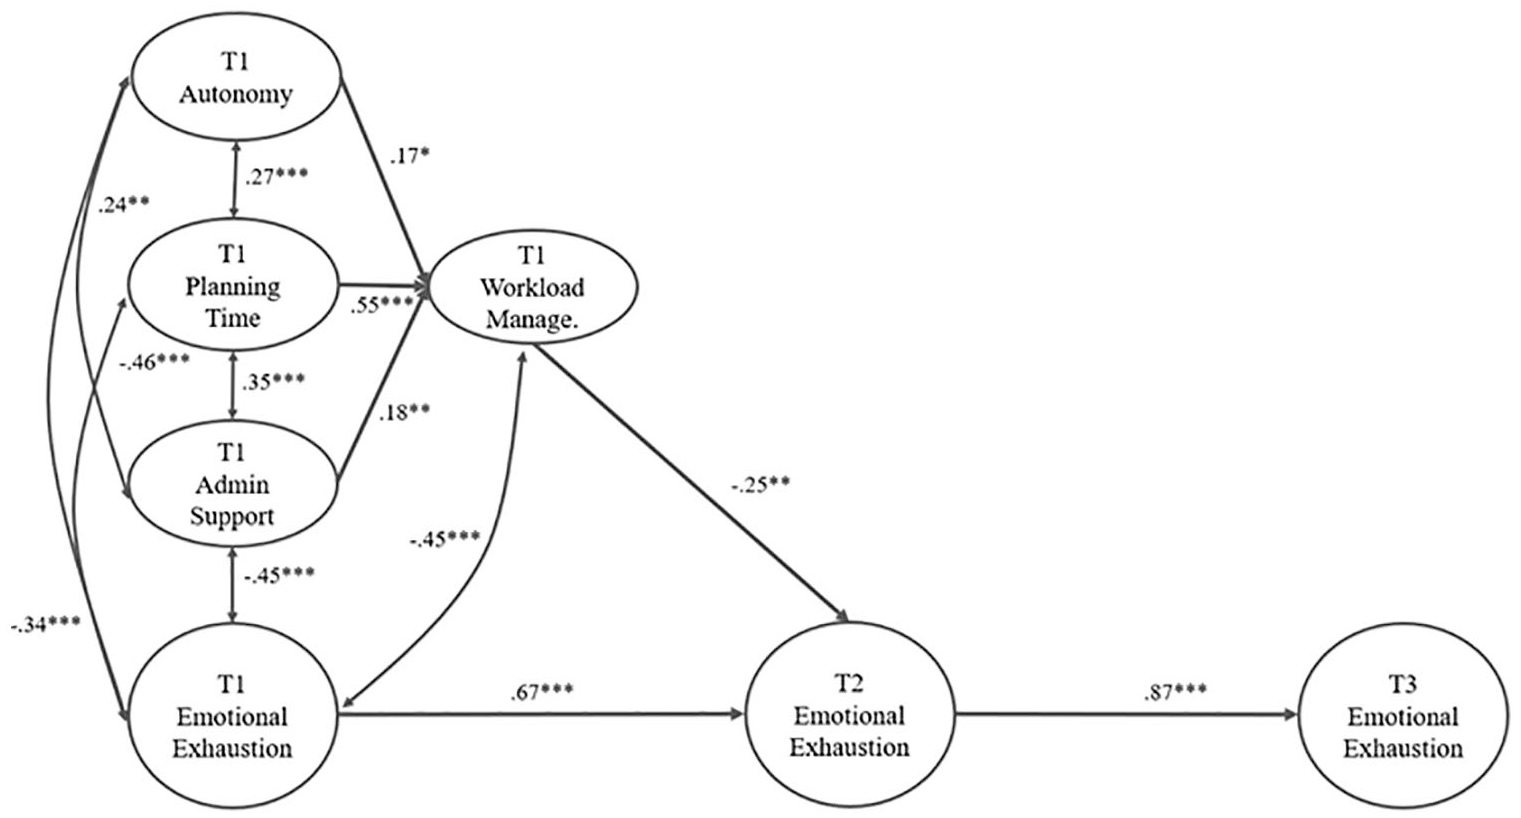
Working conditions, workload manageability, and emotional exhaustion.
Final model for effects of working conditions and workload manageability on burnout.
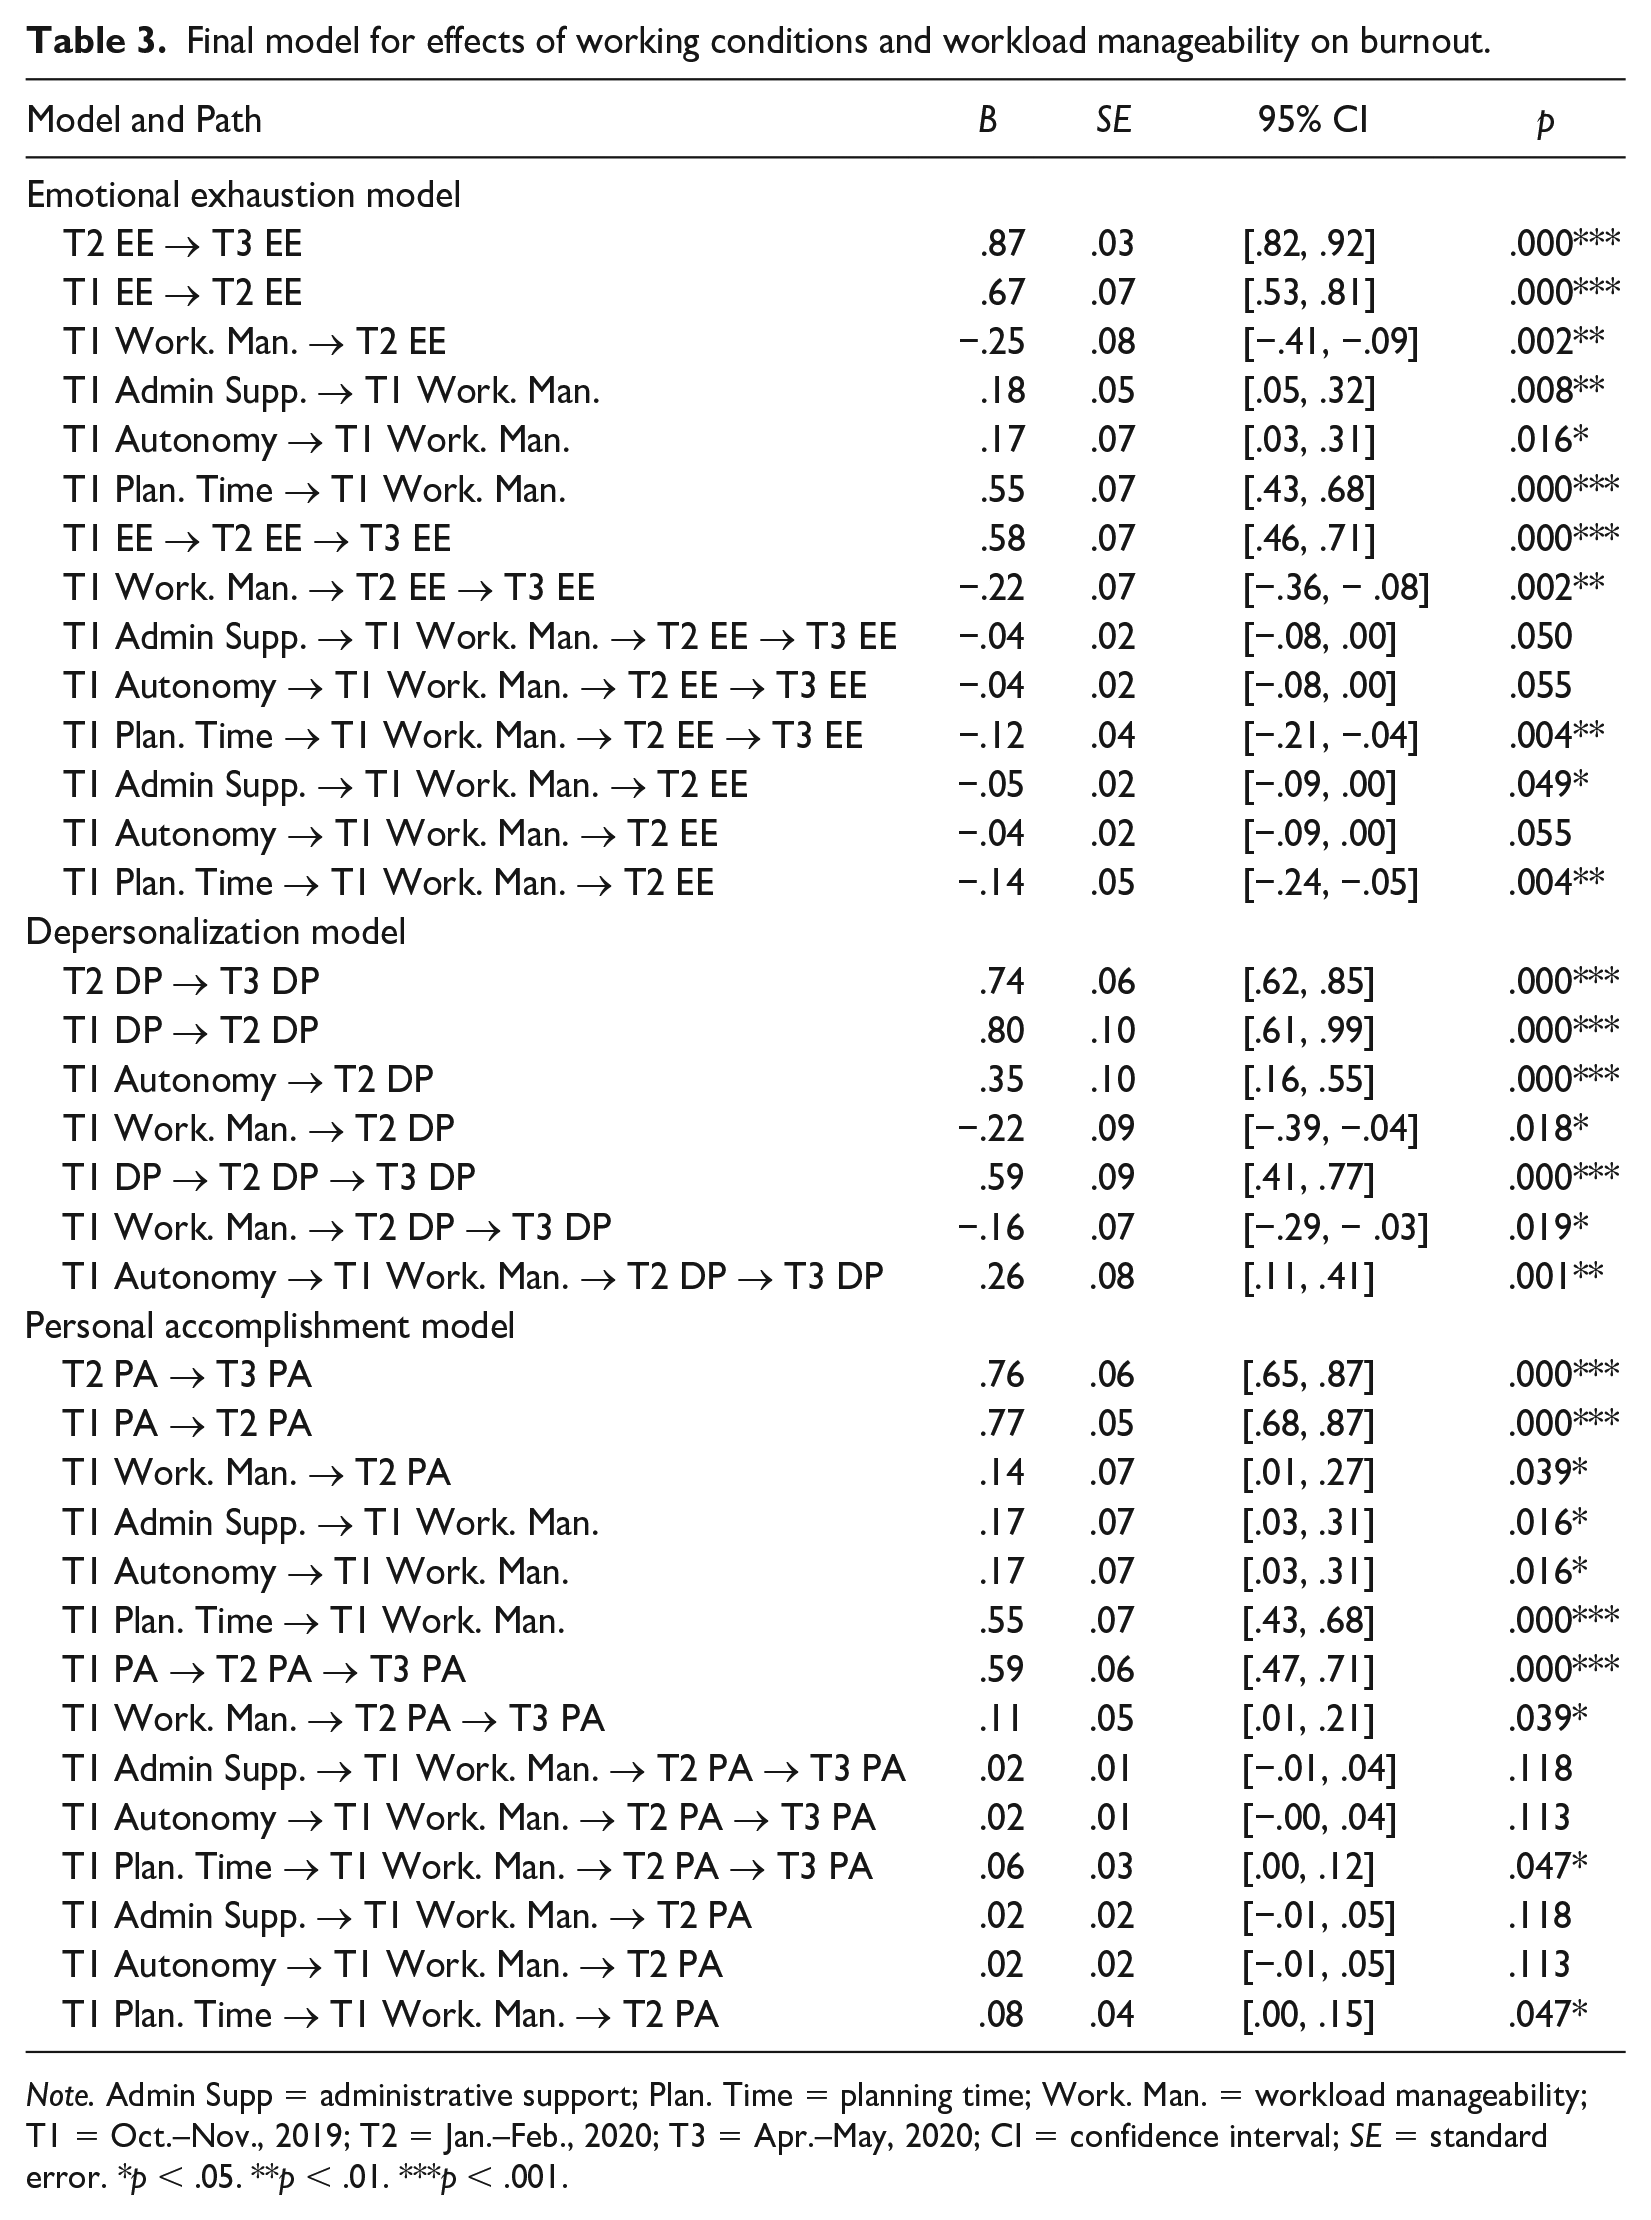
Note. Admin Supp = administrative support; Plan. Time = planning time; Work. Man. = workload manageability; T1 = Oct.–Nov., 2019; T2 = Jan.–Feb., 2020; T3 = Apr.–May, 2020; CI = confidence interval; SE = standard error.
p < .05. **p < .01. ***p < .001.
Longitudinal SEM: Working Conditions and Depersonalization
Following the same process for emotional exhaustion, we confirmed configural and weak invariance for depersonalization. We used the same process for testing the structural model: removing non-significant paths and examining model fit (see Table 2). Female, administrative support, planning time, teacher emotional support, teacher instrumental support, paraprofessional support, and changes in well-being during COVID-19 were removed from the model. The final model had good fit: χ2(74) = 102.88, p = .015, RMSEA = .041; 90% CI: [.019, .059]; CFI = .973, TLI = .962, SRMR = .054 (see Figure 3). T1 autonomy and T1 workload manageability both significantly predicted T2 depersonalization: Higher workload manageability in the fall predicted lower depersonalization (b* = −.22, p = .018) in winter, while higher autonomy in the fall predicted higher depersonalization (b* = .35, p < .001) in the winter. T1 autonomy and T1 workload manageability had significant indirect effects on T3 depersonalization via T2 depersonalization, in the same directions as their effects on T2 depersonalization (see Table 3).
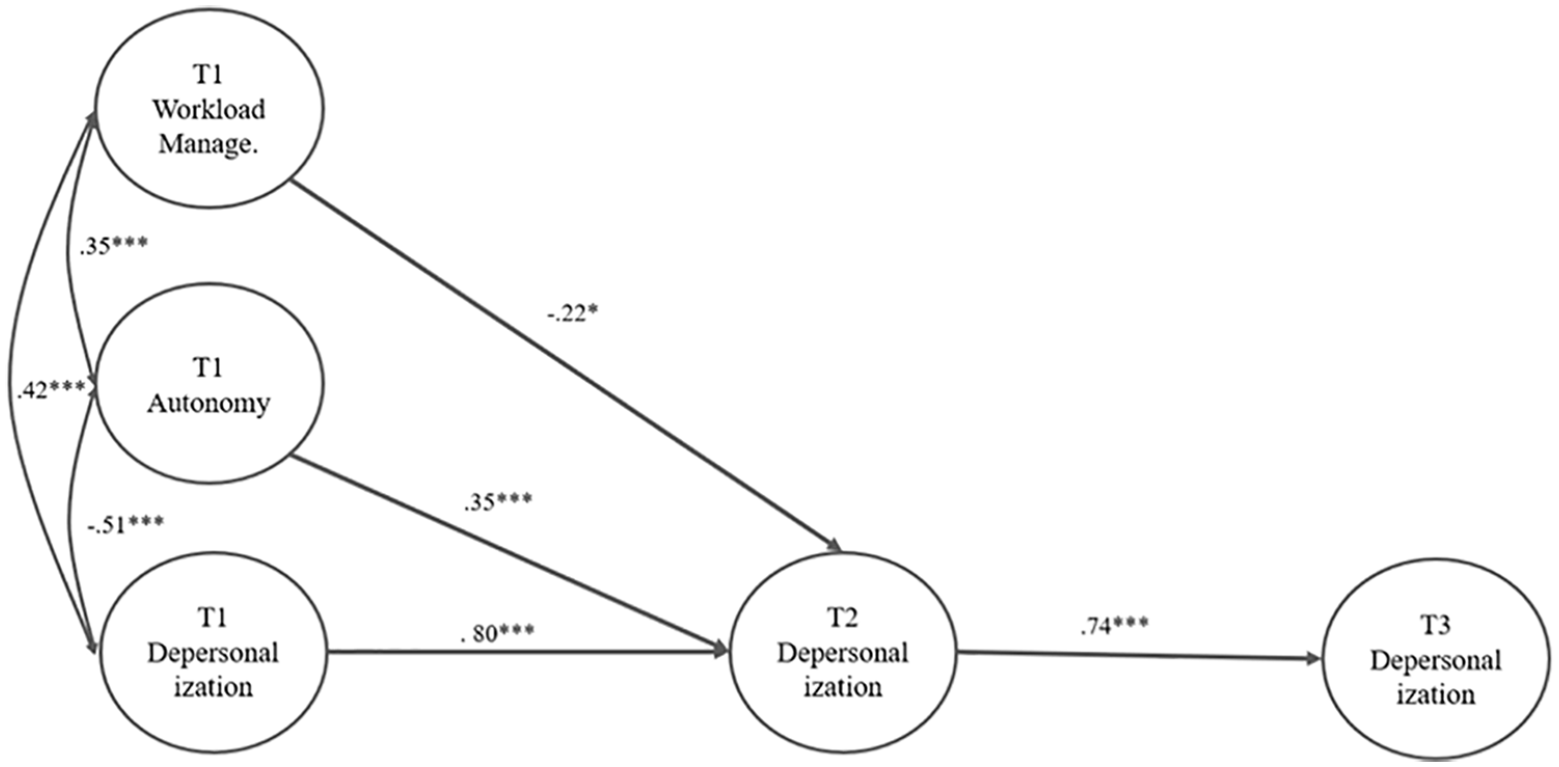
Working conditions, workload manageability, and depersonalization.
Longitudinal SEM: Working Conditions and Personal Accomplishment
We replicated prior processes to determine model parsimony by removing non-significant paths while examining model fit to obtain the best fitting model. Teacher emotional and instrumental support, paraprofessional support, and changes in well-being during COVID-19 all were removed from the model for parsimony and best fit. The final structural model had good fit: χ2(188) = 295.14, p < .0001, RMSEA = .050; 90% CI: [.039, .060]; CFI = .953, TLI = .942, SRMR = .069 (see Figure 4). T1 workload manageability predicted T2 personal accomplishment controlling for T1 personal accomplishment such that higher workload manageability in the fall was linked with higher personal accomplishment (b* = .14, p = .039) in winter. Higher T1 administrative support, autonomy, and planning time predicted higher workload manageability at T1. Workload manageability had an indirect effect on T3 personal accomplishment via T2 personal accomplishment, and planning time had an indirect effect on T3 personal accomplishment via workload manageability and T2 personal accomplishment (see Table 3).

Working conditions, workload manageability, and personal accomplishment.
Discussion
Students with EBD depend on SETs to provide effective instruction to address complex academic and behavioral needs (Campbell et al., 2018). Burned-out SETs are less likely to fulfill this charge effectively (e.g., Gilmour et al., 2021), yet SETs of students with EBD are at higher risk of burnout than other SETs (Nichols & Sosnowsky, 2002). Ameliorating burnout is key to improving the educational experiences and outcomes of students with EBD, and working conditions present a potential lever for preventing or buffering SETs’ burnout (Billingsley et al., 2020). Thus, we examined how working conditions in fall were associated with SET burnout in winter and spring. This represents the first longitudinal study of SET working conditions and burnout. We review hypotheses, discuss limitations and future directions, and offer implications.
Consistent with our hypotheses and with prior research (e.g., Ruble & McGrew, 2013), SETs who experienced stronger administrative support at T1 were less likely to experience emotional exhaustion at T2, and these effects were mediated by perceptions of workload manageability. Results indicate administrator support was the most important source of social support for preventing burnout, as paraprofessional and collegial support were unrelated to any of the three components of burnout when controlling for administrator support. In this respect, results differ from prior studies, which found significant associations between collegial support and burnout (e.g., Zabel & Zabel, 2002). This indicates a need for replication before drawing definitive conclusions. As we interpret these novel findings, one possible explanation is prior studies examined effects of other forms of social support without controlling for administrator support; prior studies’ significant effects for collegial support could have been spurious, as administrator support is associated with both burnout (e.g., Ruble & McGrew, 2013) and other forms of social support (Bettini, Cumming et al., 2020). It is also possible our measures did not capture all aspects of social support. For example, Bettini et al. (2021) found SETs of students with EBD depended on partner teachers with a background in behavior or mental health. It is possible our definition of colleagues (i.e., as teachers in their school) was not precise enough to capture this key source of social support.
Contrary to hypotheses, the type of social support administrators provided was not differentially associated with burnout. In fact, our administrator support subscales (e.g., appraisal support) covaried highly with one another, and the model fit best when we aggregated each scale and loaded each onto a single indicator for administrative support. The same occurred for colleague and paraprofessional support. Further research is needed to replicate these findings. We offer several possible explanations. One is these types of support are manifestations of an underlying construct, such as principals’ engagement with SETs or SETs’ relationship with principals. For example, if SETs have a strong relationship with administrators, they may feel they can access any form of support, resulting in high ratings for all types of support. In this sense, self-determination theory may provide an approach to ensuring measurement of social support is encompassing. Another possibility is types of support are interconnected such that principals who provide one form of support are more likely to provide others. For example, the provision of appraisal support could lead principals to recognize a need for more emotional support or vice versa. Research is needed to explore differential support and teacher well-being.
Results for planning time confirmed hypotheses, SETs who reported their planning time was more adequate at T1 were significantly more likely to feel a sense of personal accomplishment, and significantly less likely to experience emotional exhaustion at T2. Furthermore, the effects of planning time were mediated by workload manageability, partially confirming hypotheses. Of note, planning time had the strongest effects, indicating it may be a key resource for SETs. This extends Bettini, Cumming et al.’s (2020) results, which also indicated the centrality of planning time for SETs’ capacity to manage their workloads.
Results for autonomy were mixed. Consistent with hypotheses and with prior scholarship (e.g., Collie et al., 2018), higher autonomy at T1 was associated with lower emotional exhaustion and stronger sense of personal accomplishment at T2. Contrary to hypotheses, it was also associated with greater depersonalization. The reason for this finding is unclear. One possibility is SETs with more autonomy may have fewer opportunities to discuss students’ challenges with colleagues; without others’ perspectives to help contextualize and make sense of student behaviors, they may have developed more cynical and depersonalized explanations for student behavior problems. This unexpected finding should be interpreted with caution as it diverges with results from prior research (Collie et al., 2018). We urge researchers to explore these complex relations between autonomy support, autonomy, and well-being outcomes.
Interestingly, changes in well-being during COVID-19 were not significantly related to burnout constructs. This may be because the survey administration in Spring 2020 occurred in April and May, before the stress from continued change during COVID-19 had a chance to influence burnout and anxiety as it did in the 2020–2021 school year (Pressley, 2021).
Limitations and Future Directions
This is the first longitudinal study examining the relationship between SETs’ working conditions and burnout; however, it has several limitations. First, we measured teacher’ perceptions of their experiences, which introduces potential for self-report bias; however, prior research revealed linkages between teacher self-reported burnout and biological factors (e.g., cortisol dysregulation; Bellingrath et al., 2008). Second, school responses due to COVID-19 occurred between survey administrations at T2 (Winter) and T3 (Spring); although we included a measure of changes in well-being due to COVID-19 to examine linkages of COVID-19 on burnout, the measure may not have fully captured the school shutdown. Third, we were unable to test hypotheses regarding trajectories of burnout, as burnout scores over time did not cluster into parsimonious patterns. Longitudinal structural equation modeling allowed us to examine temporal precedence with respect to special educators’ working conditions and burnout. Fourth, we did not include measures of all possible working conditions (e.g., mentor access and curricular resources). As other working conditions are likely to covary with those we examined, including them could reduce the magnitude of the estimates for those we did include, and future research should examine additional working conditions longitudinally. Furthermore, while we examined demands via number of students with EBD, we did not model the total number of students with disabilities. We also encourage future researchers to examine sources of administrator support (e.g., principals, district special education director) separately to illuminate key sources of support. Finally, prior studies indicate administrator support is associated with other working conditions (e.g., Cumming et al., 2020), a relationship we did not model.
Results imply administrator support and planning time could mitigate or prevent burnout among SETs of students with EBD. Our analyses do not permit causal inferences nor do they indicate how leaders might improve conditions. Future scholarship is needed to examine (a) what interventions can improve working conditions and (b) whether such interventions reduce SETs’ burnout (Billingsley et al., 2020). Research is also needed to replicate our findings and extend analyses to other SETs at high risk of burnout (e.g., SETs co-teaching secondary classes; Embich, 2001) to better understand the degree to which specific working conditions support the well-being of special educators serving students with different disabilities. We encourage researchers to further examine planning time, which our study and recent research indicate may be a key resource (Cumming et al., 2020).
Implications for Teacher Educators
This study increases evidence linking planning time and high administrator support with lower burnout (Langher et al., 2017). We encourage teacher educators to include information on well-being and burnout prevention (e.g., Ansley et al., 2016) in both pre-service and in-service teacher education programs. Specifically, we encourage teacher educators to discuss the potential impact of working conditions on well-being and attrition and how teachers can navigate working conditions both in the hiring process (e.g., asking questions about how administrators and teachers support novice teachers) and via self-advocacy for structural supports (e.g., adequate planning time) for current teachers. Expert special educators note advocacy is a critical skill for supporting students (Ruppar et al., 2017), and recent research has illuminated how SETs’ can collect and use data (e.g., on caseload increases, percentage of planning times disrupted) to advocate for supports needed to serve students with EBD (Bettini et al., 2021; Cornelius & Gustafson, 2021). Given our findings, faculty leading administrator preparation programs might increase information regarding administrators’ attention to how SETs’ range of responsibilities often differ from—perhaps exceed—those of general educators and ensure structural supports (e.g., trained paraprofessionals, personnel to manage student disruptions during teacher planning time or time dedicated to individualized education plan compliance) are available to the degree possible (Brunsting et al., 2021; Bettini et al., 2021; Bettini, Jones, et al., 2017). In this vein, we encourage policymakers and teacher educators to ensure administrators’ preparation provides them with strong professional learning opportunities for leading special education, so administrators are well-equipped to effectively support SETs.
Summary
We examined the effects of perceptions of working conditions in fall on burnout in winter and spring among SETs of students with EBD. Results of this longitudinal study extended prior findings (e.g., Bettini, Cumming et al., 2020). Higher administrator support, planning time, and autonomy in fall predicted lower emotional exhaustion and higher personal accomplishment in winter and spring via higher workload manageability. Higher workload manageability in the fall predicted less depersonalization at winter. Results indicate prioritizing administrator support and ensuring adequate planning time may prevent burnout among SETs of students with EBD. Taken together, these findings offer important workforce information not only to teacher educators but also to researchers and policy makers.
Footnotes
Appendix
District Student Characteristics by Participation in Study.
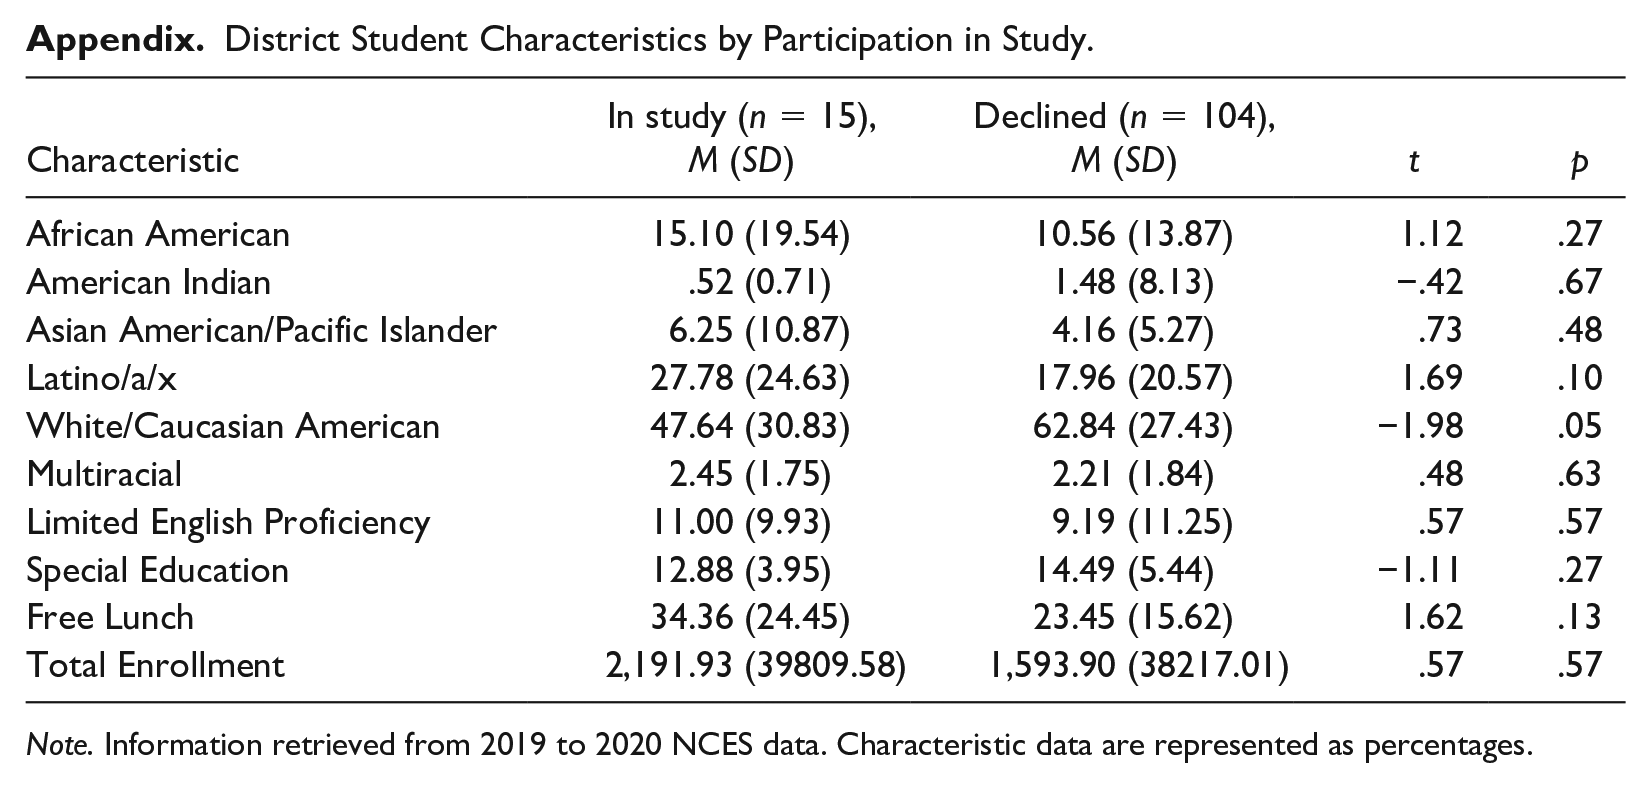
| Characteristic | In study (n = 15), M (SD) | Declined (n = 104), M (SD) | t | p |
|---|---|---|---|---|
| African American | 15.10 (19.54) | 10.56 (13.87) | 1.12 | .27 |
| American Indian | .52 (0.71) | 1.48 (8.13) | −.42 | .67 |
| Asian American/Pacific Islander | 6.25 (10.87) | 4.16 (5.27) | .73 | .48 |
| Latino/a/x | 27.78 (24.63) | 17.96 (20.57) | 1.69 | .10 |
| White/Caucasian American | 47.64 (30.83) | 62.84 (27.43) | −1.98 | .05 |
| Multiracial | 2.45 (1.75) | 2.21 (1.84) | .48 | .63 |
| Limited English Proficiency | 11.00 (9.93) | 9.19 (11.25) | .57 | .57 |
| Special Education | 12.88 (3.95) | 14.49 (5.44) | −1.11 | .27 |
| Free Lunch | 34.36 (24.45) | 23.45 (15.62) | 1.62 | .13 |
| Total Enrollment | 2,191.93 (39809.58) | 1,593.90 (38217.01) | .57 | .57 |
Note. Information retrieved from 2019 to 2020 NCES data.
Authors’ Note
The views expressed are those of the authors and do not necessarily reflect the views of the Spencer Foundation.
Declaration of Conflicting Interests
The author(s) declared no potential conflicts of interest with respect to the research, authorship, and/or publication of this article.
Funding
The author(s) disclosed receipt of the following financial support for the research, authorship, and/or publication of this article: This research reported in this article was made possible (in part) by a grant from the Spencer Foundation (No. 201900101).
