
Abstract
Purpose:
An empirical examination of the long-term association, disaggregated by gender, between religiosity and self-rated health with reference to demographic shifts in labor force participation, education, and income.
Design:
General Social Survey data.
Setting:
United States, 1974 to 2012.
Participants:
A total of 23 353 respondents.
Measures:
Self-assessed health; 2 key religiosity variables: attendance and intensity of belief; income, labor market variables, education, standard demographic variables, household size, region, and time dummies.
Analysis:
Probit estimation conducted for the aggregate sample by gender as well as by decades to examine possible gender differential changes over time.
Results:
Attendance has declined overall with a much greater decline for women. The overall positive association between religiosity and health masks considerable heterogeneity across gender and time; higher and stable for males, there is no longer a significant association for females. Increased education, income, and labor force participation can explain only part of this association. Education is the strongest mediator.
Conclusion:
The way women and men benefit from religious attendance has changed, suggesting that some pathways may be working differently for women now, especially those with less education. Moving away from church networks could be due to a perceived lack of support or substitution by other social networks. Ceteris paribus, since religious participation has been shown to weaken preference for risky consumption, declining participation, especially for women, may show up as an increase in risky behavior.
Purpose
Over the last 40 years, 2 parallel shifts took place in the United States. There were sharp changes in demographic trends between men and women in terms of labor force participation, education, and income. Simultaneously, attendance in places of worship was falling, this aggregate masking a gender divide. From 1974 to 2012, while the overall attendance fell by 6.5%, the fall was much larger for women at 13.2% compared to 2.1% for men. Since attendance in places of worship is part of a broader allocation of time among different activities, both material and spiritual, 1 changing opportunity cost of time affected by demographic shifts has the potential to have downstream effects on health predicated on the possible association between attendance and health.
There is an extensive literature studying the link between religiosity and health. 2,3 The findings have usually been for specific groups, and the association has not always been positive. For instance, some religious groups have lower cancer rates. 4 Higher levels of religiosity were linked by Levin and Vanderpool 5 with lower levels of blood pressure and mortality, but Levin and Markides 6 looked at 3 generations of Mexican American Catholics and found no association between subjective health and attendance. On the other hand, Rew and Wong, 7 after a review of 43 studies (done between 1998 and 2003) on adolescent health attitude and health behavior, concluded that religiosity and spirituality may be important and positive correlates. It must also be mentioned that though the literature has been concerned whether religion has a positive effect or no effect, one cannot rule out that in certain cases religion can lead to a negative health outcome. 8 This can happen if there are religious bans against certain medical treatment or guilt in trying to adhere to strict religious proscriptions. 6
Why would we expect religiosity to affect health? One of the pathways by which religiosity, both intrinsic and extrinsic, can be linked with health is through the reduction in risky consumption. Lillard and Price, 9 using econometric methods to establish causality on National Longitudinal Survey of Youth 79 (NLSY79) and other data sets, showed that more frequent attendance reduces current substance (smoking, alcohol, and drugs) use. Gruber 10 demonstrated that religious participation also weakens preference for risky consumption. Mellor and Freeborn 11 studied adolescents and showed that illicit drug use was significantly inhibited by religious participation. Fletcher and Kumar 12 found the importance of intrinsic religiosity during adolescence on the use and abuse of addictive substances.
There are also other pathways linking religiosity and health. 3 Those who attend places of worship regularly are expected to benefit from the larger network available in terms of prayer, formation of friendships, and a sense of community and/or extended family. In addition, there are concomitant benefits such as exchange of information, material exchanges, and obtaining support, both actual and perceived. 13 Promotion of healthy lifestyle behaviors, beliefs, and attitudes such as caring for others or being forgiving, boosting self-esteem, social support, access to resources that could help cope with negative life events, or stress are examples of how religious institutions could offer a framework for such social interaction. 14,15 Churches may go further and offer information and aid when a member has problems, 16 which also helps in dealing with the stress of adverse events. 17 Church resources can also be sources of counseling, thus lowering stress. 18 –21
Another way of adding to health is by investment in deepening “religious human capital” (“religious knowledge, familiarity with church ritual and doctrine, and friendships with fellow worshipers”), a concept that Iannaccone 22,23 introduced. This is time spent whether in attending a place of worship or in private prayer and meditation or in study of works sacred to the individual to deepen her or his faith.
This article fills a gap in the literature by studying the health-religiosity gradient at the national level in the United States over a long period of time, 1974 to 2012. Since this is also a period of time of falling attendance concurrent with major demographic shifts, we also explore possible gender-disparate crowding out of religiosity and implied time constraints flowing out of such labor market and youth activity changes.
Methods
Design
Using data from the General Social Survey (GSS, 1972-2012) conducted for the National Data Program for the Social Sciences by the National Opinion Research Center (NORC), University of Chicago, a cross-sectional study was performed. The GSS is based on personal interviews to track changes in social characteristics and attitudes. It is particularly suitable for our purpose since it has information not only on attendance (extrinsic aspect of religiosity) but also on the intensity of feelings (intrinsic aspect) individuals have about their religion. Another advantage is that with the unchanged wording of questions, problems of comparability of responses over time are minimized. Thus it provides, for 40 years, unique snapshots at the national level of a cross-section of individuals. This makes it suitable also for looking at trends in religiosity, socioeconomic factors, education, and labor force participation.
Sample
The interviews are administered to national samples using a standard questionnaire and are available for a number of years from 1972 to 2012. The primary sampling units are standard metropolitan statistical areas or nonmetropolitan counties that are used in NORC’s master sample. No interviews were conducted in 1979, 1981, 1992, 1995, 1997, 1999, 2001, 2003, 2005, 2007, 2009, and 2011. Over the years, 57 061 respondents were interviewed. However, since all questions were not asked of all respondents in all years, the total number of observations that could be used in the models was 23 353 and the analysis is based on 24 years of data, from 1974 to 2012.
Measures
The measure of the overall health is the respondent’s self-assessed health. This subjective measure of health is widely used and standard in the literature. A strong predictor of mortality, 24,25 its predictive power is unaffected by socioeconomic status. 26 Following standard procedure, the 4 reported categories of self-assessed health (excellent, good, fair, and poor) are collapsed into a binary variable called health. Its value is 1 in the case of excellent or good health and 0 for fair and poor health.
Spirituality, religion, and religiousness/religiosity, though recognized as separate, perhaps overlapping concepts, are not distinguished in practice even in the psychology literature. 27 Being inherently unobservable constructs, church attendance is one observable measure by which religiosity has been measured extensively in the literature. One rationale is that it is considered to be correlated with time spent in religious activity. 28 To a degree, this may also proxy for unobserved variables such as the time an individual devotes to private practices such as study of scripture, meditation, and prayer. The GSS has a question, “How often do you attend religious services?” The options to answer are “never,” “less than once a year,” “about once or twice a year,” “several times a year,” “about once a month,” “2 to 3 times a month,” “nearly every week,” “every week,” and “several times a week.” Since the literature has not furnished a consistent guideline, we follow Gruber and Hungerman 29 whose attendance index with an average value of 4 corresponded to monthly attendance. Our dichotomous index of attendance has a cutoff point being a month. This is our first key religiosity variable.
The second religiosity variable that is included is intensity of belief intended to capture the subjective feeling whether respondents are following their religion strongly. The question asked is: “Would you call yourself a strong (name of preferred religion) or not very strong (name of preferred religion)? The relevant answers of “strong” and “somewhat strong” were coded as 1 for the first 2 answers and 0 for those who did not feel they were strong or did not believe. This intensity variable was deemed useful for several reasons. Part of it will probably reflect Iannaccone’s religious human capital, but part of it may also reflect other, perhaps overlapping, confounding unobservables such as attitude toward risk, preferences, peer group, religious upbringing, and so on. Measurement of both religiosity variables is consistent with the literature. 30
Religious preference variables were obtained from answers to the question “What is your religious preference? Is it Protestant, Catholic, Jewish, some other religion, or no religion?” Dummies for all religious groups were created including a separate dummy for those who professed no religion and who constitute the reference group. The religious groups were, as per the GSS categories, Protestant, Catholic, Other nonspecified, Jewish, Islam, Hindu, Buddhist, other eastern religions, Orthodox-Christian, Christian, Native American, and internondenominational.
The income variable for the respondent is inflation adjusted. 31 The natural logarithm transformation takes into account the concavity of relationship between health and income. In our case, income can also be considered to be a proxy for the opportunity cost of time, as well as socioeconomic status and access to resources, such as the ability to buy necessities to take care of health as, for instance, gym membership, home exercise equipment, and higher quality food.
Demographic characteristics have been controlled with the following standard variables. Age, following accepted econometric procedure is included as a quadratic function. Both age and age squared are included to capture the possibility that health may rise in later years, as usually those who live longer are healthier. The 2 indicator variables, white and other race (in the GSS, the “other” category includes Hispanics with many other groups) capture race, with the omitted category being white. The relationship between marital status and health has been well discussed in the literature. 32 The vector of marital status variables consists of married, widowed, or divorced/separated, with never married being the reference category. Household captures household size by showing the number of individuals (including children) in the household. It has been noted that the presence of children can have a differential effect on attendance depending on gender. 28 It also proxies for social support, positive or negative, within the family that could affect health.
Work status is indicated by full time, part time, not in the labor force, and unemployed (omitted). We also include self-employed. Arano and Blair 33 show that the frequency of attendance is a normal good and hypothesize that there may be networking effects involved through church attendance, which could be controlled with a self-employed variable.
The education variable shows the highest year of schooling completed by the respondent from 0 (no education), 1 (first grade), till 20 (8 years of college). The link between education and health is well established (eg, Cutler and Lleras-Muney 34 and Brunello et al 35 ). Education can also be a proxy for attitude to risk in terms of how forward looking an individual is. Income, labor force participation, and education directly affect the opportunity cost of time and also have established health effects.
That women are more religious than men has been discussed in the literature (eg, Miller and Hoffman 36 among others). Miller and Hoffman lay out the 2 existing explanations in the sociological literature to explain this gender difference. One is differential socialization where women are taught to be more submissive, obedient, meek, and so on. These have been shown to be linked to greater religiosity. In fact, this is predictive even of differences within each sex. 37 The second line of reasoning is called “structural location” and encompasses labor force participation and childbearing roles. It may be mentioned that a recent study suggests some nuances. Schnabel reports that women belonging to non-Christian groups may not display greater religiosity than their male counterparts, relative to women in Christian denominations. 38 To these 2 explanations, Miller and Hoffman added a third by showing that risk preferences reduced gender difference in religiosity. We include the usual gender variable and then also explore any differences that may arise by disaggregating by gender.
Finally, to control for unobservable factors that can change between regions and over time, both region and time dummies are incorporated. The region dummies act as proxies for different costs of health care and for attendance that vary across regions. The time dummies capture unobserved national trends such as changing economic or social conditions and attitudes over time.
Statistical Analysis
The statistical analysis is conducted in 2 parts. First, the descriptive statistics with tests of significance of differences in means are presented and discussed, followed by a probit analysis.
Descriptive statistics
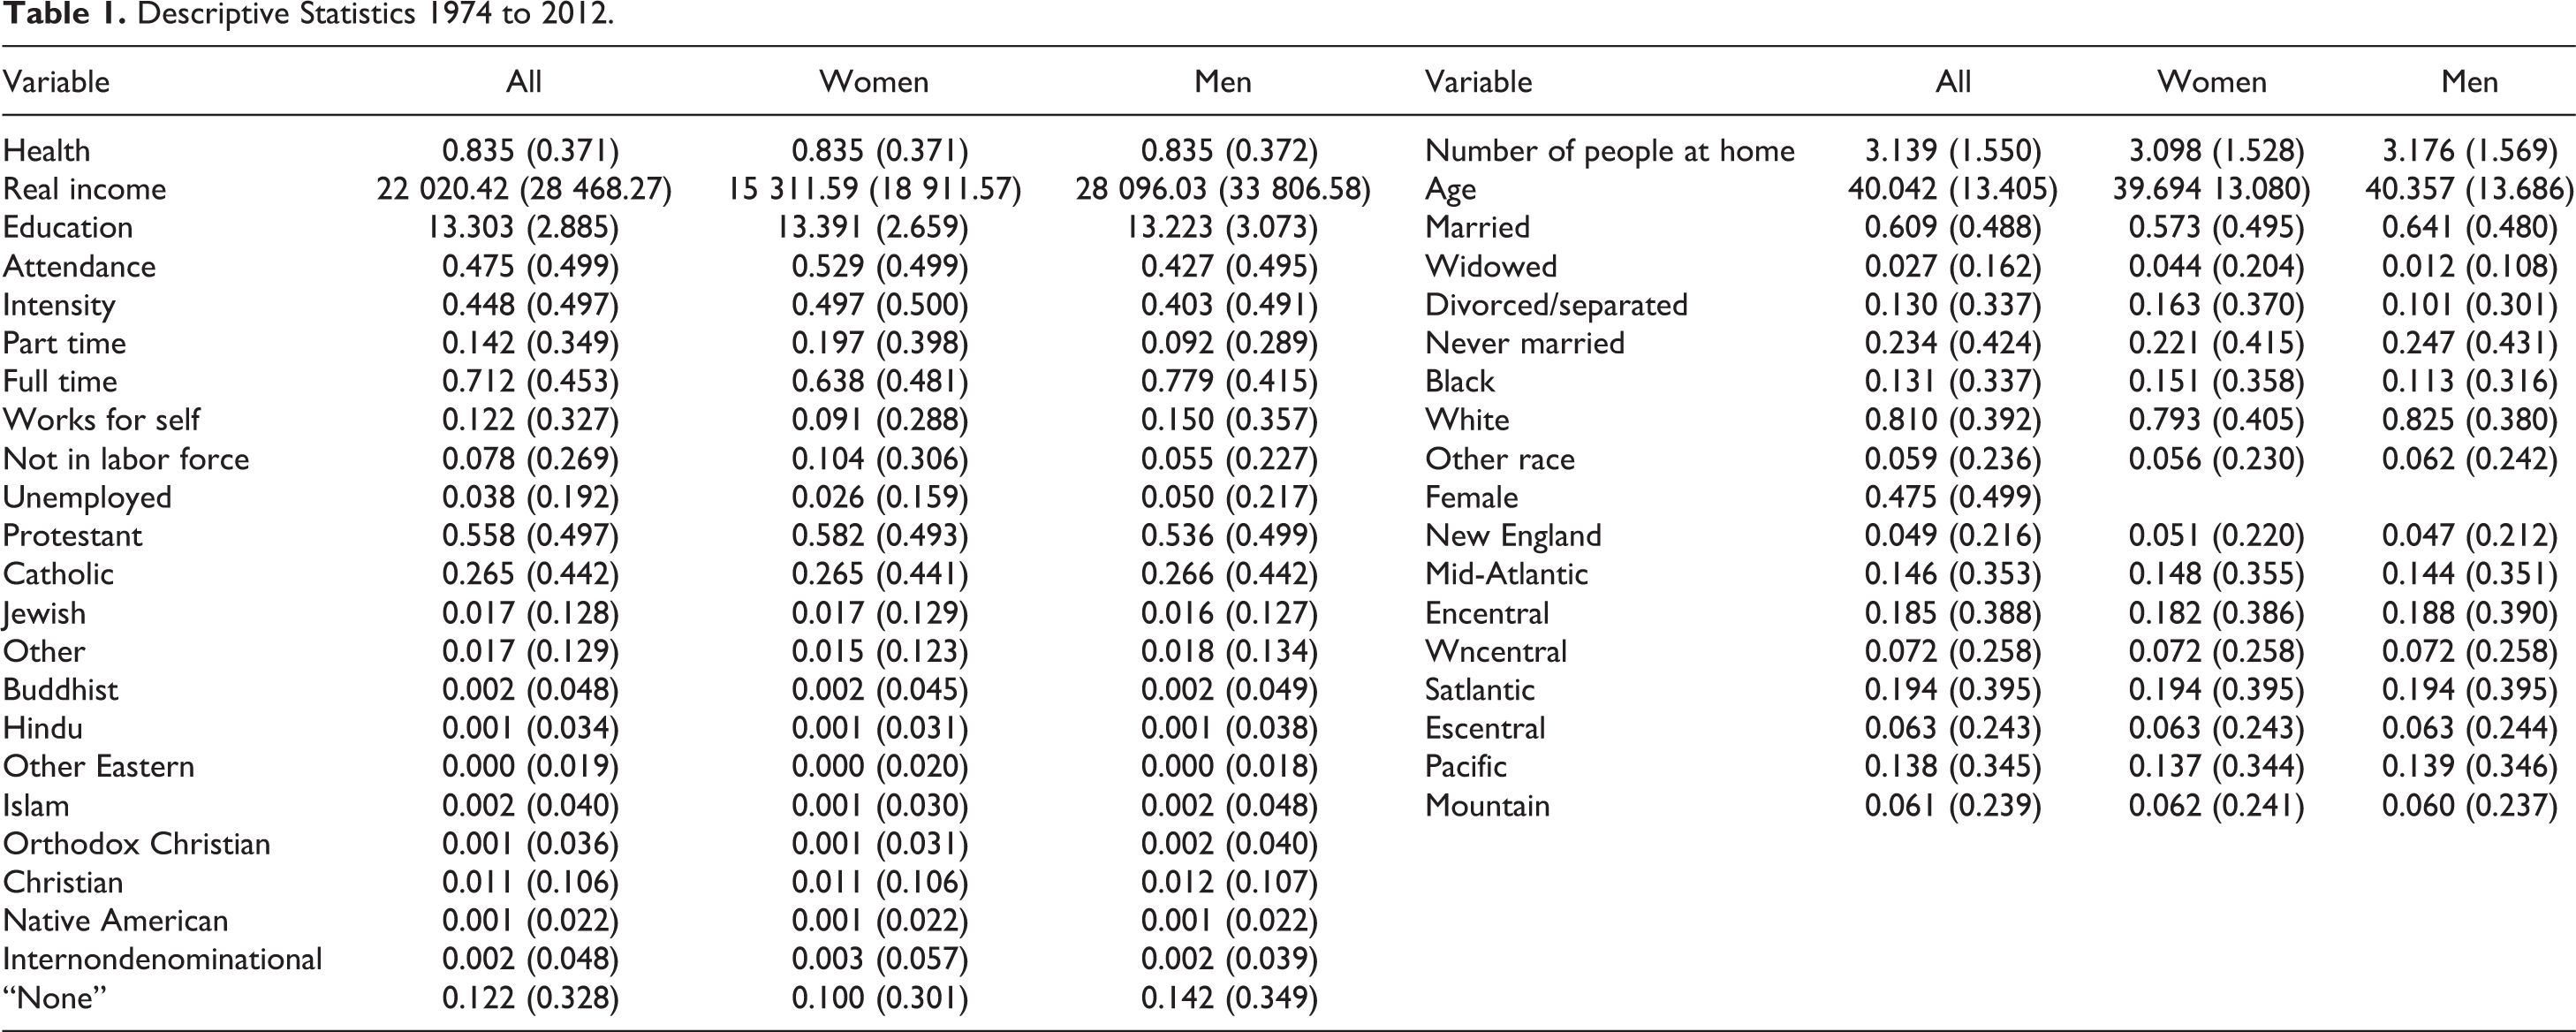
Table 1 shows sample averages over the entire period. Table 2 shows averages for a few key variables, over each of the 4 decades, 1974 to 1983, 1984 to 1992, 1993 to 2002, and 2003 to 2012.
Descriptive Statistics 1974 to 2012.
Descriptive Statistics for Selected Variables by Decades.
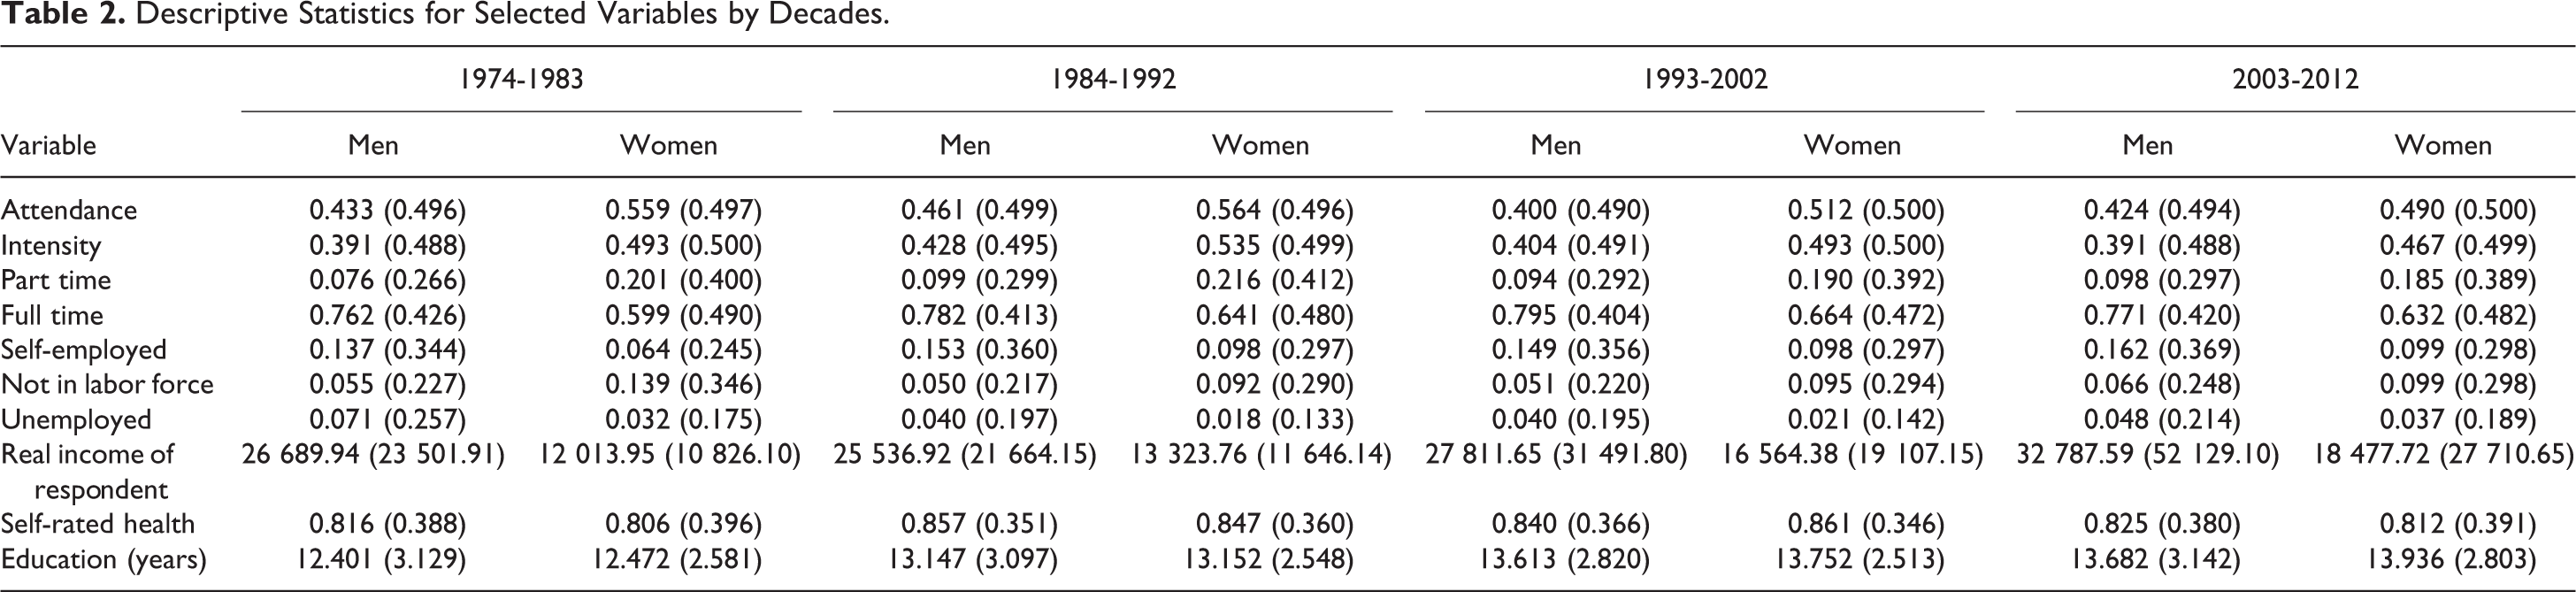
Over the entire period, the average attendance for the whole sample is 47.5%, with 52.9% for women and 42.7% for men. This is consistent with the literature finding that women’s religiosity is greater than men’s. However, breaking down the numbers by decades (Table 2) shows nuances otherwise hidden in the aggregates. In the initial decade, 1974 to 1983, 55.9% of women were attending services at least once a month compared with 43.3% of men. Attendance rose for both in the next period, declined for both in the third period, and then, between 2003 and 2012, both rose to be 42.4% for men and 49% for women. Although a greater percentage of women than men are still attending services, there has been a much greater decline for women (13.3%) than for men (2.1%).
In terms of intensity of feeling, over the whole period, 49.7% of women and 40.3% of men reported strong to very strong feelings about their religion, again confirming established findings that women display more religiosity than men. Although there was a surge for both men and women in the second decade, by 2002 to 2012, there was a decline of 5.5% for women, with men virtually showing no change compared to almost 40 years ago. Therefore, despite the greater religiosity of women consistent as per expectation in the literature, there has been a downward trend for women.
Self-rated health status for both men and women has improved, though the rise is more prominent in the middle 2 decades. Real incomes increased over all 4 decades by 20.58% for men and 43.05% for women. The labor market statistics are consistent with the increased labor force participation of women. From the first decade to the fourth, part-time employment has increased 25.42% for men but declined 7.8% for women. However, women have increased full-time employment much more than men (5.5% vs 1.3%). The fraction of women who are self-employed has also risen over this period. Women not in the labor force has declined from 13.9% to 9.9%, and increased from 5.5% to 6.6% for men.
Probit models
The estimation method adopted, with the binary outcome of health status, is the standard one of probit analysis. Our analysis is conducted in 2 stages. Stage 1 analyzes the entire sample and then does gender estimations. Not only has the literature pointed to the greater religiosity of women, there is gender variation in labor force participation trends as well as in observed trends in religiosity. Time constraints can vary by gender, and finally, the pathways that link attendance and health can also work differently for men and women. Stage 2 stratifies the final comprehensive model by decades to investigate possible time patterns.
In each stage, to help in sorting out the relative strength of individual demographic effects, a series of gender-based estimations was carried out. Beginning with a baseline model (model 1), we perturbed this to incorporate education, income, and labor force participation separately in models 2, 3, and 4. The complete specification controlling for all 3 measures simultaneously is in the final model 5, which shows the combined influence of demographic shifts in the association of religiosity and health and possible gender heterogeneity.
All the reported estimates show the marginal effect or the probability of reporting good to excellent health of a unit change in the independent variable at the average value of the other regressors. The analyses were performed using STATA version 13.0 (StataCorp, Texas, USA).
Results
Stage 1: Probit Analysis Over the Sample Period—Entire Sample and by Gender
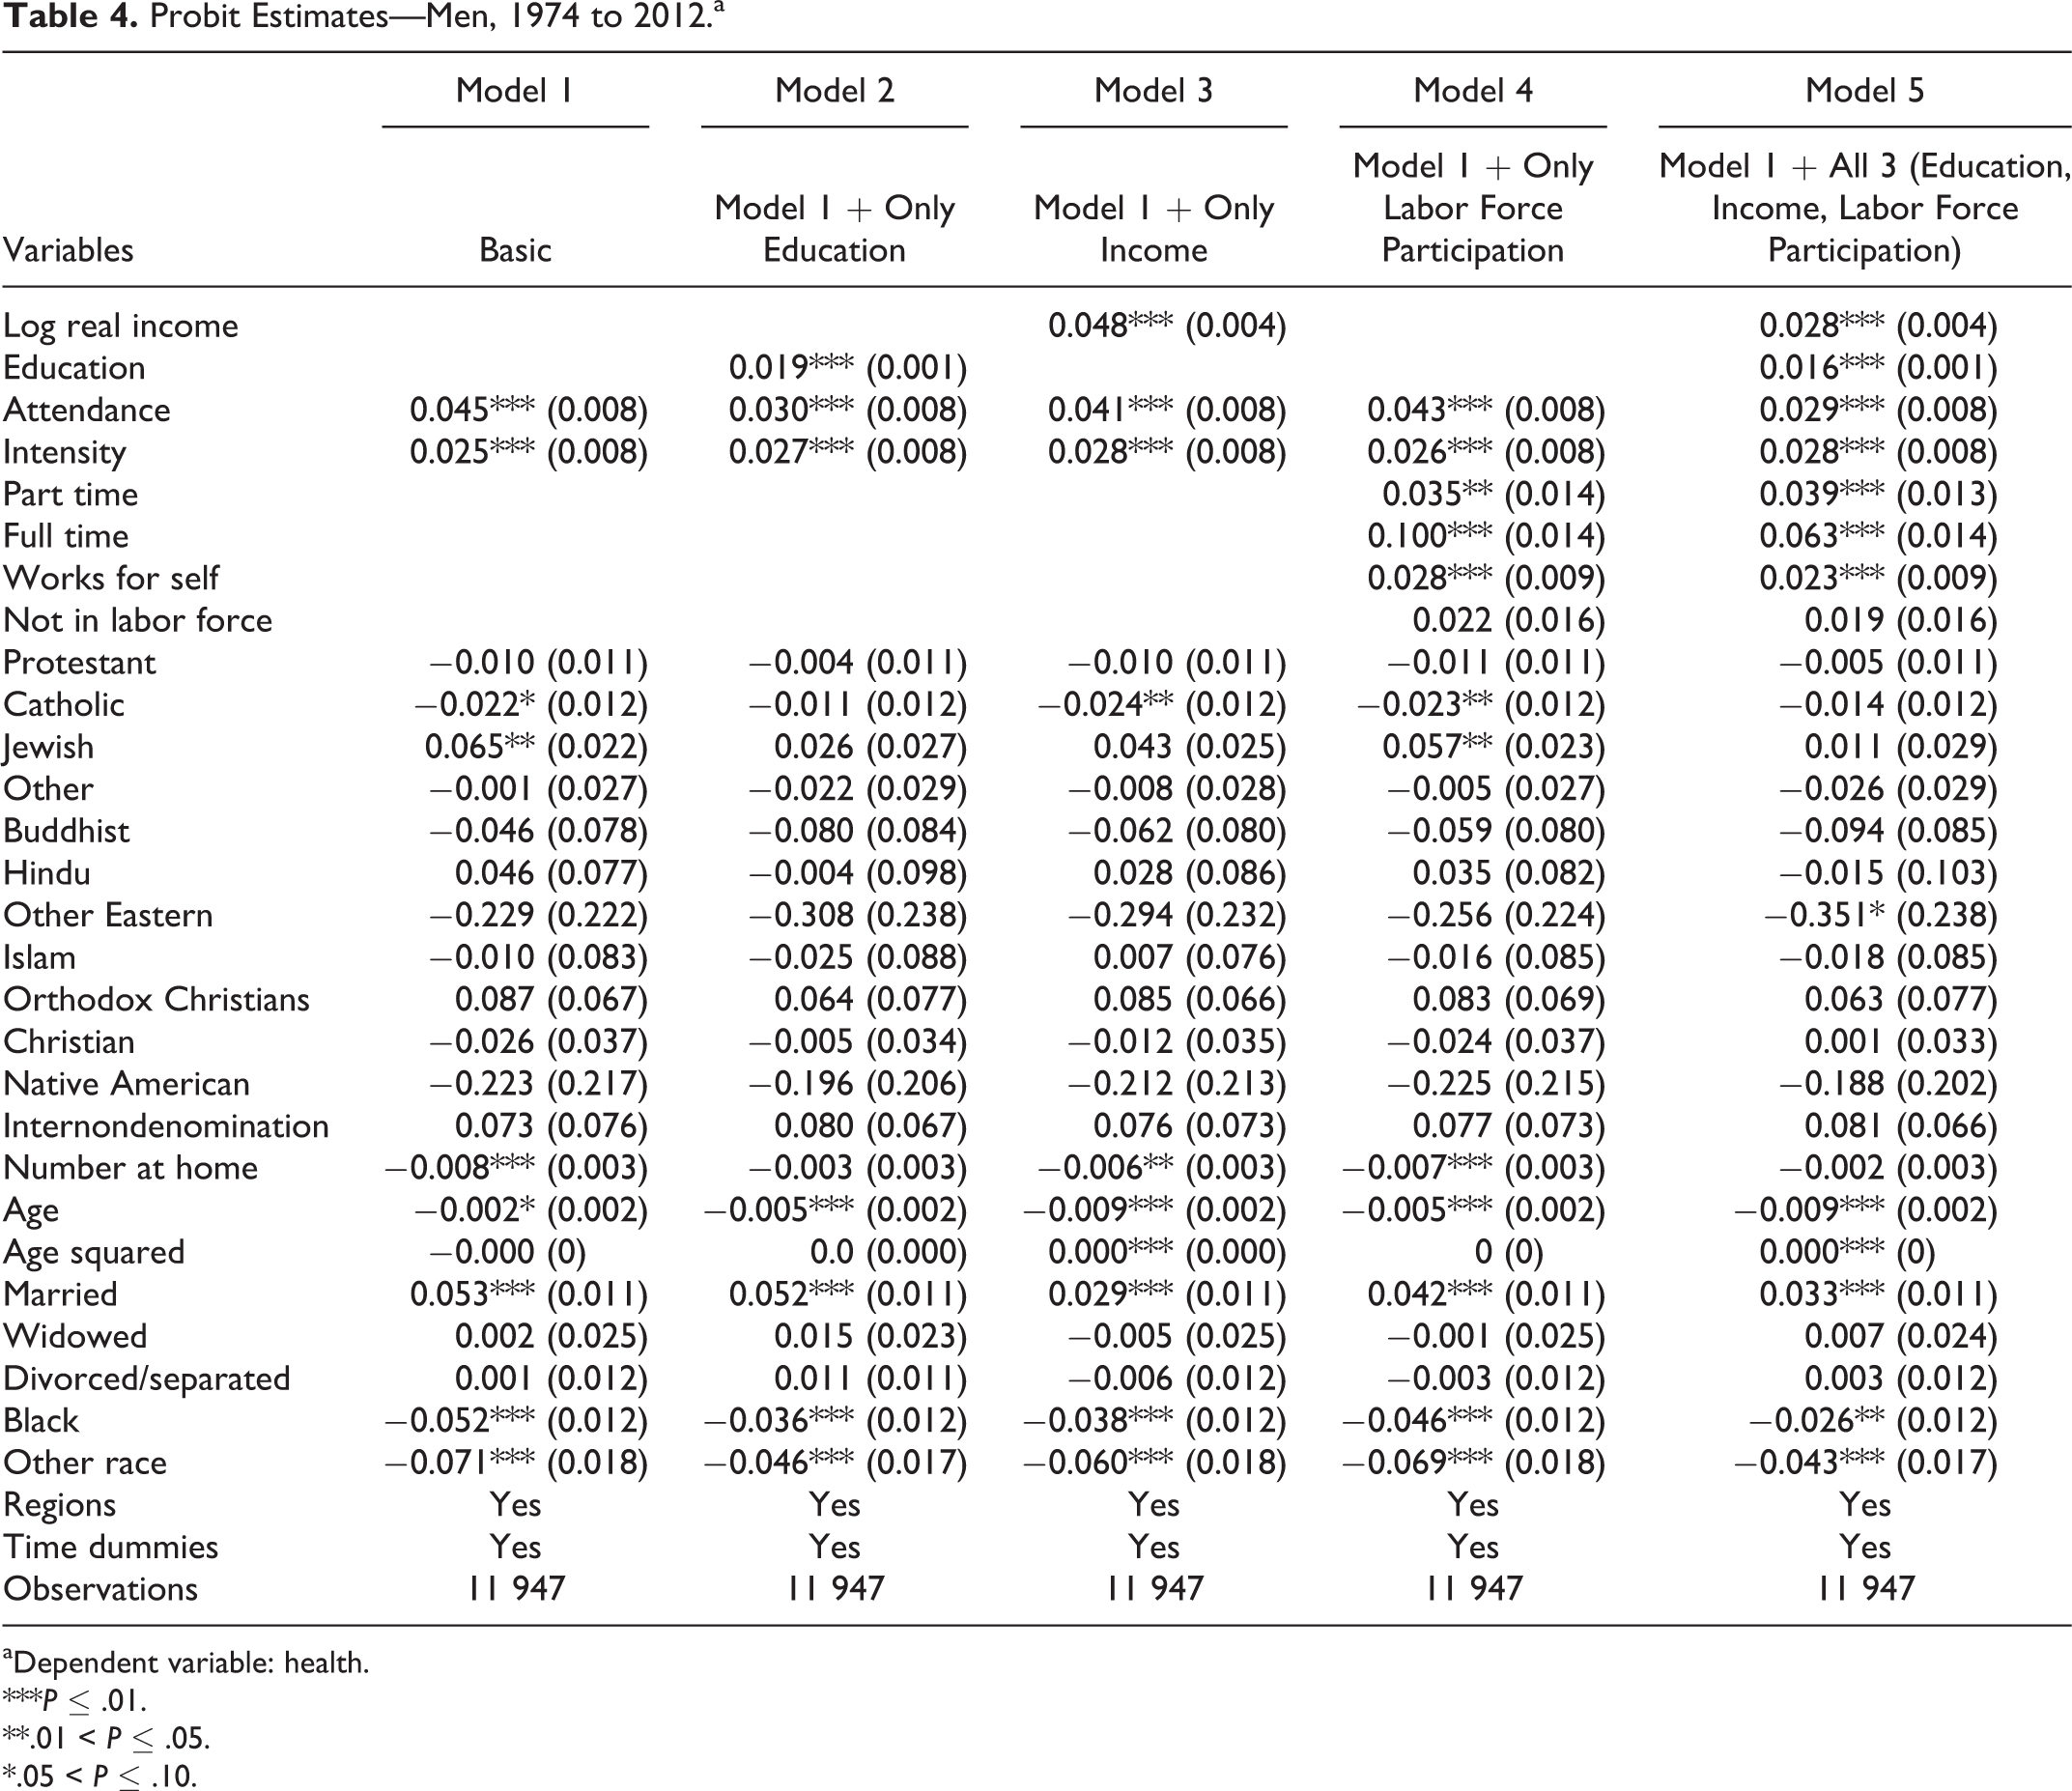
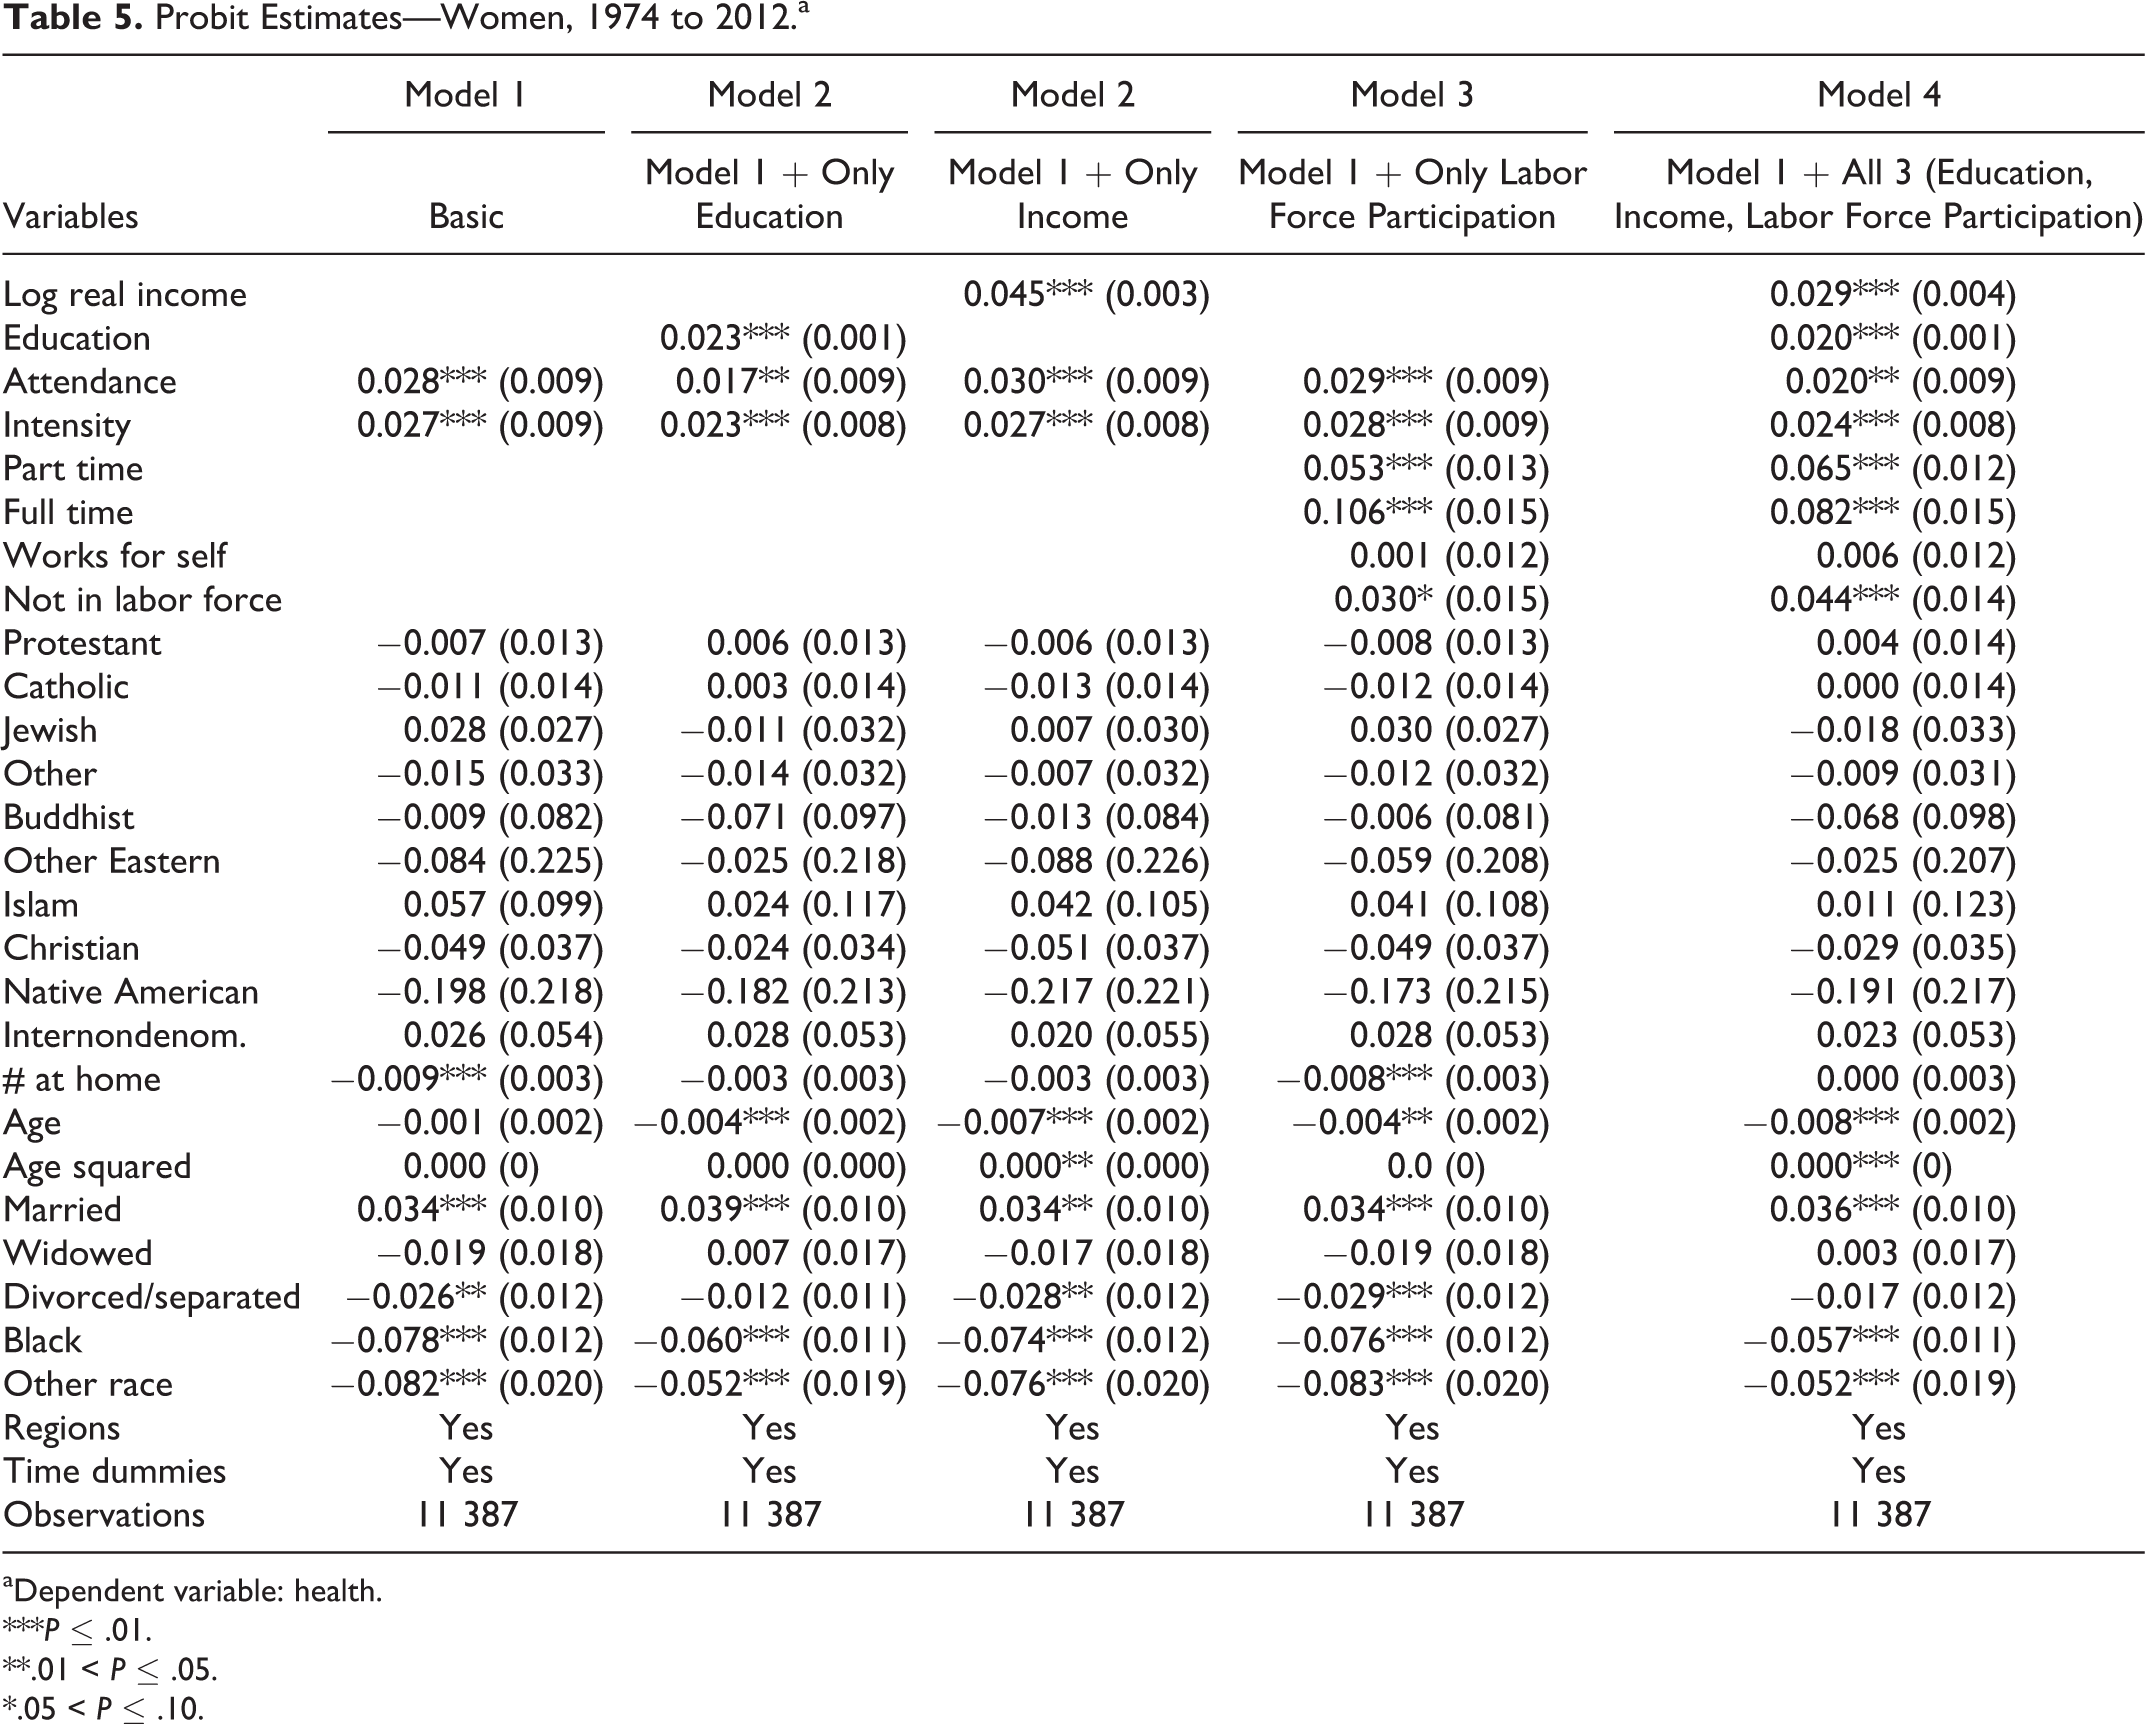
Table 3 shows the results of the probit analysis for the entire sample for the period 1974 to 2012. Tables 4 and 5 show the corresponding results for men and women.
Probit Estimates—Entire Sample 1974 to 2012.a

aDependent variable: health.
***P ≤ .01.
**.01 < P ≤ .05.
*.05 < P ≤ .10.
Probit Estimates—Men, 1974 to 2012.a
aDependent variable: health.
***P ≤ .01.
**.01 < P ≤ .05.
*.05 < P ≤ .10.
Probit Estimates—Women, 1974 to 2012.a
aDependent variable: health.
***P ≤ .01.
**.01 < P ≤ .05.
*.05 < P ≤ .10.
In the simplest model (model 1), attending at least once a month significantly increases the probability of reporting very good to excellent health (henceforth referred to as “health”) by 3.7 percentage points in the entire sample. For men, the probability is significantly higher (4.5) than that for women (2.8). The coefficients of religious intensity, which also control for unobserved heterogeneity, do not change significantly between specifications in all the 3 sets of estimations and are not significantly different in the 2 gender estimations.
The results for the other explanatory variables are standard and as expected. The probability of reporting very good to excellent health declines with age. Being married does significantly increase health by 4.3 percentage points for the overall sample. This is in line with the literature, whether we talk of the “marriage protection” effect or the “marriage selection” effect. 39 However, in line with the findings of Umberson, 40 men (Table 4) seem to benefit more from marriage than women (Table 5). In both the overall sample and in the gender equations, being black or belonging to another race has a significantly lower probability of good health relative to whites.
Of the 3 sets of demographic variables, education seems to affect the relationship between attendance and health the most. By adding education, the coefficient on attendance (Table 3) is reduced from 3.7 (in model 1) to 2.4 (in model 2). After adding all the demographic changes in model 5, there is still a significant 2.48 percentage points increased probability of reporting health.
However, these overall estimates hide gender differences. In model 1 (Table 4), men have a significant 4.5 percentage point increase in reporting health, whereas for women, the corresponding probability is lower at 2.8. In the final model 5, the attendance coefficient does decrease for both genders, although the decline is significant in the case of men and marginally reduced in the case of women. Of the intermediate models, only education seems to have significantly reduced the coefficients and so for both men and women; education appears to be the strongest mediator underlying the association of religiosity and health.
Stage 2: Time Patterns in Health–Religiosity Gradient
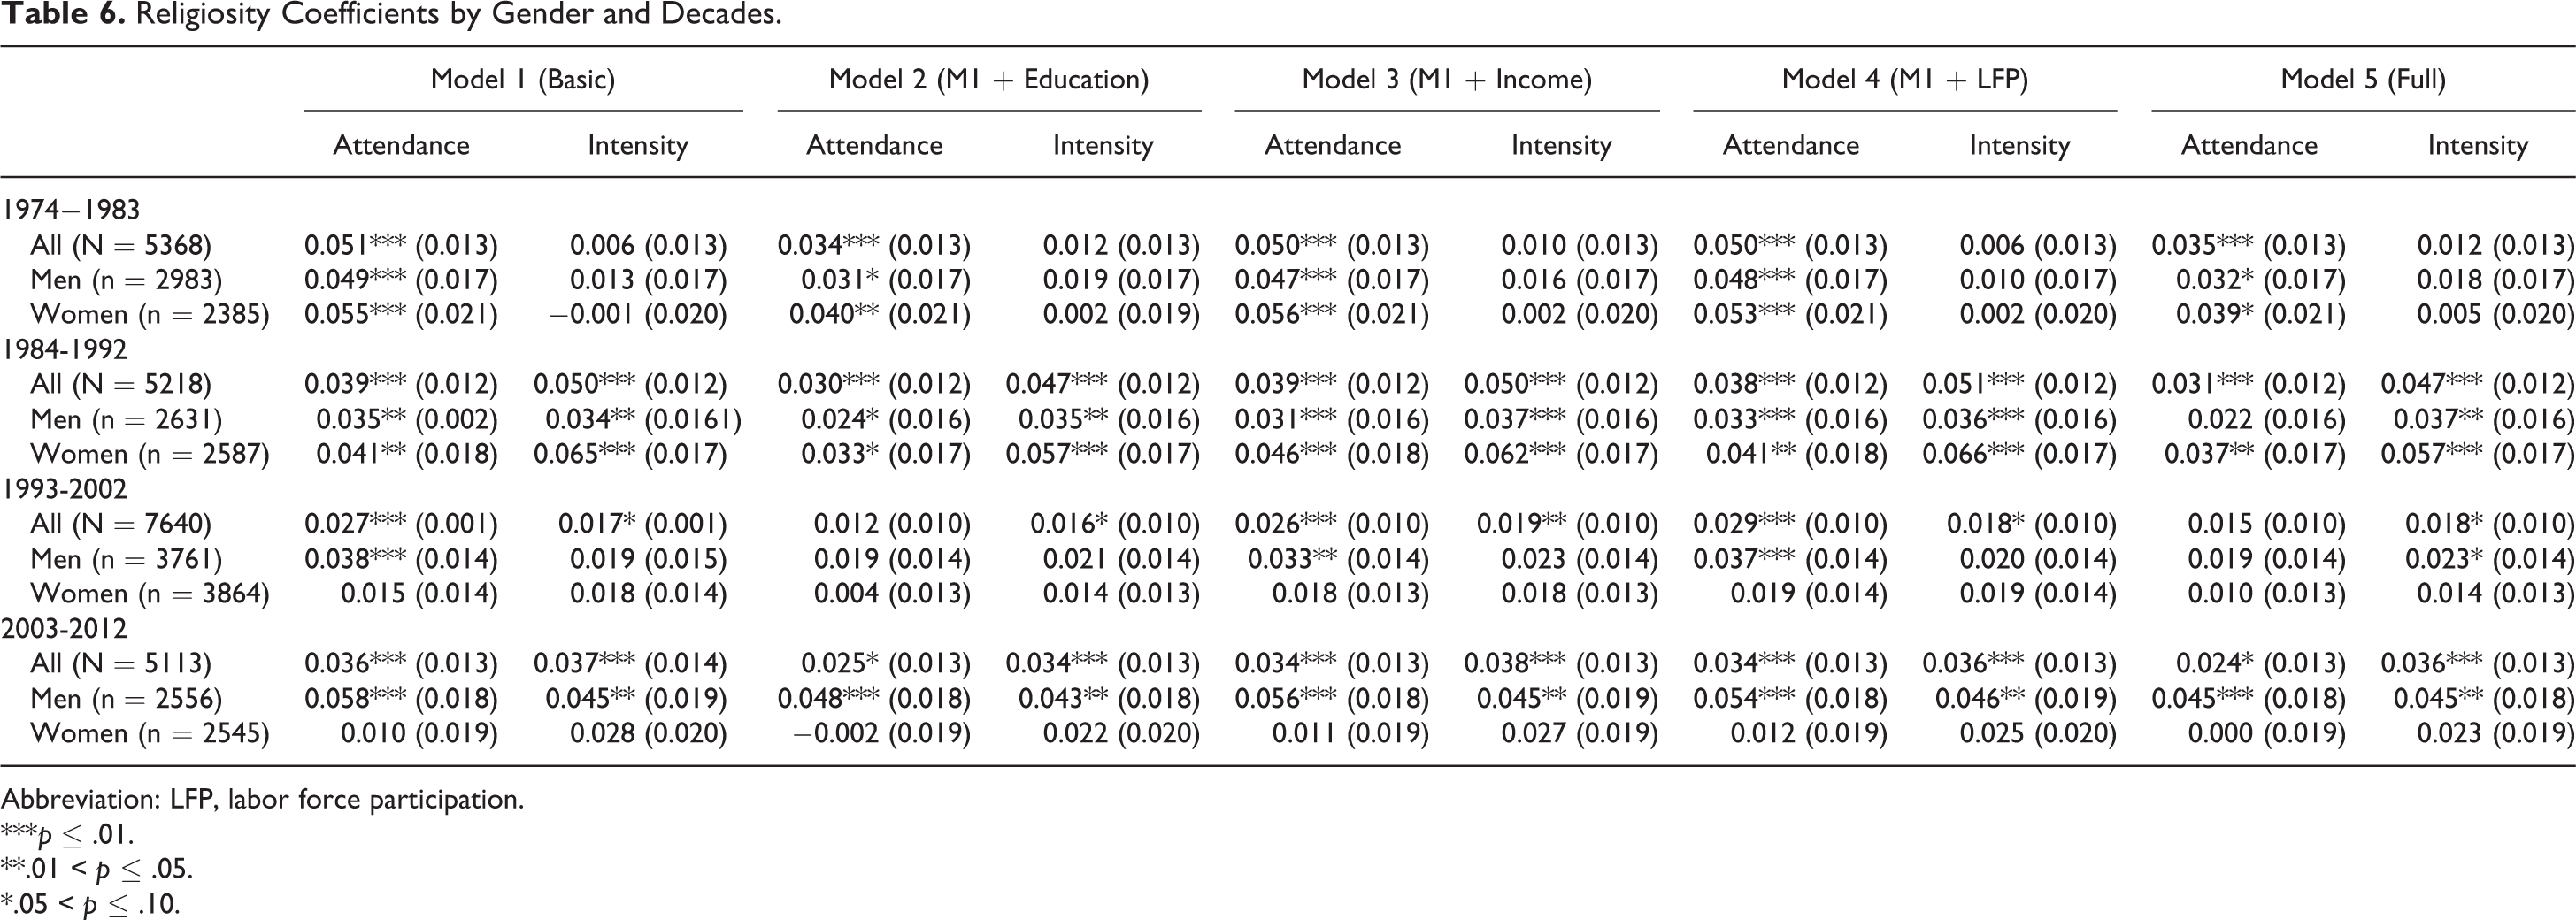
With results for women weaker than that for men, a natural extension is to investigate whether the gender differences in the health–religiosity gradient display any time patterns. We divided the sample period into 4 periods of roughly 10 years each. The results pertaining to the religiosity variables are in Table 6 (full results are available on request). For each decade, the 5 models were estimated for the entire sample and separately for men and women.
Religiosity Coefficients by Gender and Decades.
Abbreviation: LFP, labor force participation.
***p ≤ .01.
**.01 < p ≤ .05.
*.05 < p ≤ .10.
In the first 2 decades, 1974 to 1983 and 1984 to 1992, in the complete model 5, the coefficient on attendance is slightly higher for women. But by the last decade, 2003 to 2012, even in the simplest model 1 without any of the demographic shifts, the coefficient on attendance is much lower than that of men and is insignificant. With all controls added, men show a 4.5 percentage points increase in the probability of reporting very good to excellent health with an increase in attendance, whereas for women, it is 0. In fact for women, this is the lowest point in a continual decline from the first decade (3.91 to 3.7 to 1.0 and now to 0 percentage points). The intermediate models in all the decades show that education has the strongest mediating influence.
Discussion
The period studied has seen 2 parallel shifts occurring together. One is a declining attendance in places of worship and the other consists of demographic changes in terms of labor force participation, education, and income. In each case, the changes for women are larger than the changes for men.
Our results have given us 2 insights. One is the relative importance of the 3 key demographic transitions. The other relates to the gender trends. We find that it is only education that has a significant influence in mediating the association of attendance with health. The relationship of education to health (the “education gradient”) has been explored, among others, by Cutler and Lleras-Muney. 41 For both genders, probit estimates (available on request) in our sample show that education is positively correlated with both health and attendance. As education goes up, so does attendance, and this is a strong enough effect to cause a dip in the coefficient of attendance of 1.4 percentage points in men and 1.1 percentage points in women when education is introduced. Our results are consistent with the findings in the economic literature. For instance, Glaeser and Sacerdote 42 have found that in the United States, education and religious attendance are positively related at the individual level. They explain this in terms of social interaction which, in whatever way it is measured, is positively related to education; religious attendance can be seen as a particular instance of social interaction. Some studies in the sociological literature, however, have found a negative relationship. 43,44 Ganzach and Gotlibovski 45 show that including individual differences is important and could explain differences in findings.
Even though income and labor force participation do not change the coefficient on attendance significantly, some insight may be gained by seeing the direction of the change. In the case of both income and labor force participation, the coefficients go down in the case of men and move upward for women. In our sample, although income and health are positively correlated for both genders, income and attendance are positively correlated for men and negatively for women. This explains why the coefficient on attendance moves differently for men and women when income only is added (model 3 in Tables 3 and 4). Lipford and Tollison 46 simultaneously estimated income and religious participation and found that as income increased, it encouraged a shift away from religious participation toward market activities. Though the effect is small in our sample, it seems that women tend to shift away from religious participation with increased income and that this is not the case with men.
In our sample, labor force participation is positively associated with health and this is consistent with the findings of Ross and Mirowsky 47 who, using longitudinal data, investigated both the social causation (employment improves health) and selection (the healthy get jobs and keep them as well) hypotheses. However, probit estimates (available on request) indicate that there is a suggestion that women decrease attendance with increased labor force participation, unlike in the case of men. This explains why the coefficient on attendance dips when labor force variables are added in the case of men but increases in the case of women. Again, despite the small effect, our results show, in contrast to men, a shift away from attendance as women have increased their labor force participation.
When considering the entire period, attendance does seem to have a positive, significant association with health in both full and disaggregate samples. The difference between men and women has narrowed by the addition of the demographic variables. In the full model for men (Table 4), there is a significant 2.93 percentage points probability increase in reporting good to excellent health, whereas for women (Table 5), increasing attendance to more than once a month will yield a smaller, though significant, corresponding probability of 1.99 percentage points.
Analysis by decades confirms the relative strength of education as a mediating factor but also reveals the steady attenuation of the association of health and attendance for women till it became 0 in the last decade 2003 to 2012. Since education is so important in mediating the effects, we ran similar models for women with less education (till high school) and those with more education. We found that it was the less educated group that drove the earlier positive correlation between religious attendance and self-rated health but that this correlation has diminished to nil over time.
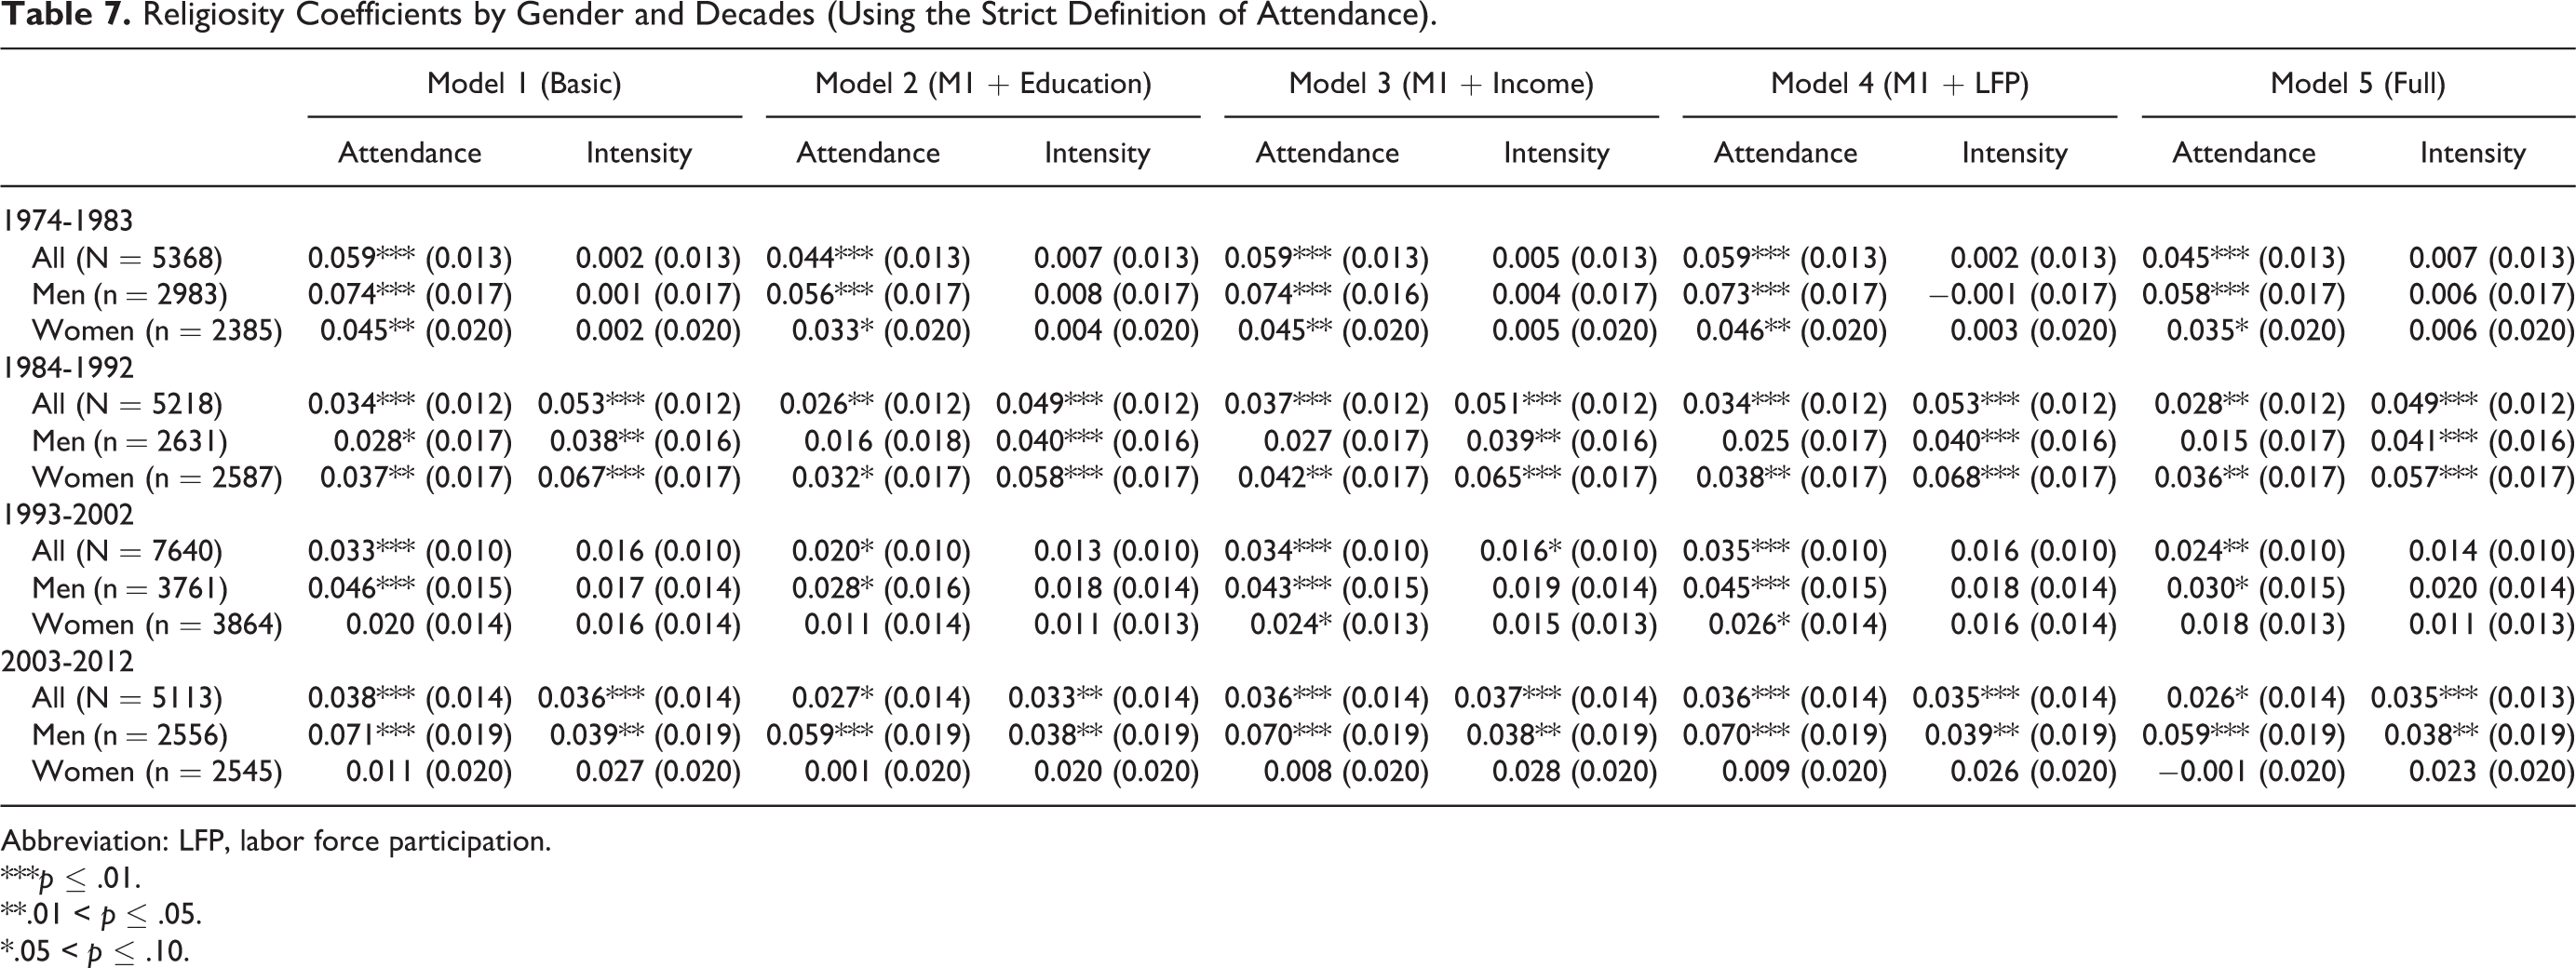
Since it is reasonable to argue that these results may only be a product of the way attendance has been defined wherein those who came once a month or more were counted as 1, we did a couple of robustness tests.
Robustness Checks
We created another, stricter, attendance variable, where only those who came at least once a week made the cutoff point. With all other explanatory variables retained as originally defined in the model, Table 7 contains the decade-by-decade estimations with the new “stricter” attendance variable. All other variables remain unchanged. Except in the second decade, the attendance coefficient for men in the full model is bigger in this stricter specification. In the last decade, men have a 5.9 percentage point increase in probability of reporting very good to excellent health, and for women, the corresponding probability of 0.1 is insignificant. Thus, even with the stricter attendance, the same differential pattern is noticed between men and women.
Religiosity Coefficients by Gender and Decades (Using the Strict Definition of Attendance).
Abbreviation: LFP, labor force participation.
***p ≤ .01.
**.01 < p ≤ .05.
*.05 < p ≤ .10.
We also explored the importance of the intensity variable by eliminating it. Recall that this variable is intended to capture a bundle of unobserved heterogeneity, including religious human capital, attitude toward risk, religious upbringing, preferences, and so on. When the models were run without it, the initial coefficients on attendance were in general larger, indicating that though unspecified, some endogenous factors have been captured by including this variable.
Conclusion
This article examines for the first time, as far as we are aware, the trends and association between religiosity and health at the national level for nearly 4 decades. The study pays special attention to key demographic shifts occurring during this period of almost 40 years. The latter, by changing the opportunity cost of time, has the potential to change time allocation decisions between the material and spiritual.
Over the time period 1974 to 2012, overall, we find a positive association between attendance and health. This average “population” effect masks considerable heterogeneity both across gender and over time. Probit estimates with 2 different cutoffs for attendance indicate that the association of religiosity with health is generally higher for males than for females, and while this has generally remained stable for males over time, it has declined considerably for females (especially those with lower education) over the recent decades to a point where by the most recent decade 2003 to 2012, health benefits associated with increased religiosity is confined only to men.
Our results also suggest that although demographic changes over this time period (namely, increased education, income, and labor force participation) can explain a part of the association between religiosity and health, education is the strongest mediator. There is suggestive evidence that for women, higher incomes and increased labor force participation have reduced attendance to some extent, mitigating the positive effect of education on attendance in our sample.
Attendance is a choice, as Iannaccone’s household model had implied, with an opportunity cost. Although the opportunity cost for both men and women is likely to have increased due to demographic shifts, the latter are likely to have increased the opportunity cost for women more. Women’s average years of education has increased slightly more than men’s (1.46 years as against 1.28 years for men). Real incomes increased by 20.58% for men and 43.05% for women over this time period. Full-time employment for women has outpaced that for men, and the fraction of women who are self-employed has also gone up.
Changing opportunity cost is likely to affect time allocation decisions, in particular between spiritual and market options and health. 10,29,48,49 However, demographic changes and changing opportunity cost capture only part of the story. Tables 6 and 7 both indicate that in the last 2 decades, even before demographic changes were added, women were not benefiting from attendance. This appears to point to some changes that have taken place over the last 40 years in the way women, in particular, benefit from religious attendance. Investigation of these changes needs to be done in future research. The possibility that some of the pathways described earlier may now be working differently for women cannot be ruled out. There may be a perceived lack of support, or other social networks may be substituting for church networks. Depending on what women are substituting for their religiosity, the net effect may still be health promoting. 50 Other reasons could also include conflicting activities of children and perceived or actual, historical or current dysfunctional churches. In addition, broader social and attitudinal factors could also be playing a contributory role.
A reallocation of time, away from religiosity, could also have implications for health by changing health behavior. Research 9,10,12,29 has shown that religious participation weakens preference for risky consumption. In addition, a recent study shows that, relative to women who did not attend, there was an 84% lowered likelihood of committing suicide among women who attended religious services weekly or more frequently. 51 Our results show that men who attend are at lower risk than those who do not. However, for women, the health association of attendance present even 25 years ago has been attenuated to a point where it has disappeared. This opens up questions for future research on why women are not benefiting, whereas men are, and whether something can, or even should, be done about it.
This study has several limitations. Causality could not be established due to the cross-sectional nature of the data and the lack of adequate and powerful instruments. Although data limitations precluded us from testing causality, the GSS data set, by enabling us to use a rich set of controls, along with its consistent measurement of religiosity over a long time span, does afford a more comprehensive analysis of secular trends in religiosity and its link to health than previously undertaken. There is, however, a built in bias toward finding a stronger association between attendance and health since one must be relatively healthy to attend at all or as many times as desired. Evidence has also been found of a self-presentation bias that results in an overestimation of the number of times respondents have actually attended. 52,53 Finally, if there are those who attend religious services because of the social aspects or for familial reasons, then any health effects seen may not be due to religion but other factors. These biases come under the category of “unobservable heterogeneity,” and one way of mitigating their effects is to include an extensive set of controls as we have done. One of these is religious intensity that can proxy for many factors that may be correlated with both religion and health and can cause bias. By including a rich set of controls, we hope to have captured some of this unobserved heterogeneity across individuals.
SO WHAT?
What is already known on this topic?
The link between health and religiosity has been widely studied. The associations found in specific groups studied have largely, but not universally, been positive.
What does this article add?
This is the first national study of health and religiosity spanning a long period of time. It also recognizes the role of changing opportunity cost due to key sociodemographic changes occurring over this time period. Women are not benefiting now from attendance, whereas men are. Women appear to have chosen to substitute time away from religiosity toward other uses or may have other reasons for not attending.
What are the implications for health promotion practice or research?
By linking with existing research that religious participation weakens preference for risky consumption, our results show that men who attend are at lower risk than those who do not. Research is needed to determine whether women are benefiting from alternate uses of time, for example, avoidance of perceived or actual risks to social determinants of health. A broader implication of this study is showing the importance of the allocation of time in the production of health. Health production is usually thought of as a function of diet, exercise, avoidance of addictions, and so on. We illustrate that allocation of time to pursuits not directly connected to health is significant as this can have important spillover effects.
A broader implication of this study is that it underscores the importance of the allocation of time in the production of health. Health production is usually thought of as a function of diet, exercise, avoidance of addictions, and so on. We illustrate that allocation of time to pursuits not directly connected to health is significant as this can have important spillover effects. Our results also open up promising avenues for future research, which should focus on the overall and gender-specific mechanisms underlying the link between religiosity and health in conjunction with alternate data sources.
Footnotes
Acknowledgments
The authors gratefully acknowledge the insightful comments and encouragement given by Dhaval Dave of the Department of Economics, Bentley University and the National Bureau of Economic Research (NBER).
Declaration of Conflicting Interests
The author(s) declared no potential conflicts of interest with respect to the research, authorship, and/or publication of this article.
Funding
The author(s) received no financial support for the research, authorship, and/or publication of this article.