



Abstract
Objectives:
This study investigated the resilience of single-family housing values in walkable versus unwalkable neighborhoods during the economic downturn from 2008 to 2012 in Dallas, Texas.
Methods:
Using propensity score matching and difference in differences methods, this study established a natural experimental design to compare before-and-after value changes of single-family (SF) homes in walkable neighborhoods with unwalkable neighborhoods during the Great Recession. Two thousand seven hundred ninety-nine SF homes within 18 Tax Increment Financing (TIF) districts were categorized into walkable (Walk Score ≥50) and unwalkable (<50) groups. Six hundred twenty-four dwellings in walkable neighborhoods were matched with the most identical ones in the unwalkable neighborhoods by controlling for the selected structural and residential location variables. Relative average treatment effects were examined for SF values in walkable and unwalkable neighborhoods.
Results:
On average, the SF homes in walkable neighborhoods held $4566 (2.08%) more value than their how walkable counterparts.
Conclusions:
This study aims to help planners and decision-makers by documenting the unmet demand for walkable communities and their sustained economic benefit. Increased awareness of the sustained value of walkable communities can be used by lenders who finance and by policy makers who regulate placemaking. Results from this study can be integrated with research that demonstrates health-care cost savings of walkable environments to create an even more comprehensive set of evidence-based interventions to increase their supply.
Keywords
Introduction
Being physically active is recognized as one of the most important approaches to prevent obesity and chronic diseases. 1 Walking is the most basic form of adult daily physical activity. The 2008 Physical Activity Guidelines for Americans recommend that adults engage in at least 150 minutes of moderate-intensity, aerobic, physical activity (eg, brisk walking) each week to gain significant health benefits. However, only approximately half of the US adults meet the recommended guidelines, 2,3 and 1 of every 2 adults is living with at least one chronic disease, such as heart disease, cancer, or diabetes. 4
Low-density, auto-centric suburban developments have been shown to be linked with the prevalence of automobile dependency, sedentary lifestyle, and obesity. 5,6 Federal intervention and local policy since the 1930s for urban renewal and the deployment of interstate highway systems have resulted in the destruction of many dense traditional neighborhoods in central areas to build highways to serve workers residing in sprawling suburbs. In recent years, there has been an increasing understanding of the need for walkable neighborhoods as a means to promote active living and healthier lifestyles. 7 Studies have shown an increasing unmet demand for more walkable neighborhoods. 8 -10 Several programs and policies have promoted walkable neighborhood designs to support walking and other outdoor activities, such as the National Physical Activity Plan, Designed to Move, Partnership for Active Transportation, and America Walks. Moreover, the United States Surgeon General has launched a national Call To Action to Promote Walking and Walkable Communities as a national priority. 7
The built environment has been identified as one of the most influential factors at the population level impacting walking, physical activity, and public health. 5,11 -13 A growing body of literature showed that walkable neighborhoods promote physical activity because they provide an array of destinations within walking distance and direct access to parks through a connected street network. 12,14,15 Walkable neighborhoods tend to come with other supportive elements or characteristics such as sidewalks, crosswalks, cleanliness, trails, landscaping, and high visual quality. 16,17 Other studies have identified environmental cobenefits of walkable neighborhoods, such as the reduction in carbon emission and air pollution. 18,19 However, until recently, the bankability or demand for walkable neighborhoods was argued to be limited. 20,21 Demand for different types of real estate products or neighborhood types is the fundamental for developers. The perception of reliable market performance is a key factor in influencing the type of development (eg, automobile-oriented, walkable designs) that gets built. Economic recessions cause higher unemployment rates and lower income and less economic activity. These factors have been related with poor nutrition, less physical activity, more obesity, and increased health-care expenditures. 22,23 The aforementioned emerging literature documenting a growing unmet demand for more walkable environments 8,9 shows a positive association between land values and walkability 20,21,24 ; yet few studies have assessed the effect of housing values over time in walkable versus unwalkable neighborhoods, especially during a recession.
Existing studies on the economic impacts of walkable neighborhoods have primarily focused on retail activities, services delivery cost, and neighborhood revitalization. 25 -27 A few other studies quantified health-related economic benefits of walkable neighborhoods, such as the saving of health-care expenditures associated with physical inactivity. 28 -30 A limited number of studies have directly examined the influence of walkable neighborhoods on housing values. 31 -34 A recent study in Washington DC found that walkable neighborhoods were associated with higher residential and commercial land values. 31 A study in Austin, Texas, found that walkable environmental features were related to higher housing sale prices in walkable neighborhoods than in automobile-oriented neighborhoods. 33 Only one study in Portland, Oregon, explored the relationship between walkable neighborhoods and housing prices during an economic recession and found that single-family (SF) homes located closer to the central city held their values better. 34 However, these relevant studies have their limitations. First, most of them used a cross-sectional study design, limiting the ability to document a causal effect; second, they did not effectively control for selection bias; and third, the confounding factors were not well controlled or equally distributed, which may incur estimation errors.
To address the above research gaps, this study established a natural experimental design to compare before-and-after value changes in SF homes in walkable versus unwalkable neighborhoods by using propensity score matching (PSM) and difference in differences (DID) approaches. This study is one of the first attempts to examine the economic resilience of walkable neighborhoods on SF housing values within a price stimulus (the Great Recession) and built environmental interventions. The study design strengthens evidence of causality, and the results provide economic insights to stimulate local community development and redevelopment projects to promote walking which can further contribute to promoting active living and public health.
Method
Study Setting
The study was performed in Dallas, Texas, the eighth largest city in the United States, with a population of 1 197 816 (US Census Bureau, 2010). Dallas experienced a housing market downturn, dropping almost 15% of median real estate prices during the Great Recession between 2008 and 2012 (Figure 1). Dallas has 18 Tax Increment Financing (TIF) Districts during 2008 to 2012, which were being retrofitted through the TIF incentive programs, a government-driven tool to finance infrastructure-based redevelopment and stimulate economic development. The TIF leverages the anticipated longer term gain in land value primarily from public infrastructure (often transit) into near-term capital that is invested within the area benefiting from this investment. Planning initiatives and policies in Dallas have attempted to integrate neighborhood redevelopment strategies (eg, smart growth, new urbanism) into TIF programs to retrofit automobile-oriented into walkable, transit-oriented neighborhoods. This also includes creation of and mixed-use development through major infrastructure and amenity improvements (eg, sidewalk connectivity/completeness, park and green space improvements).
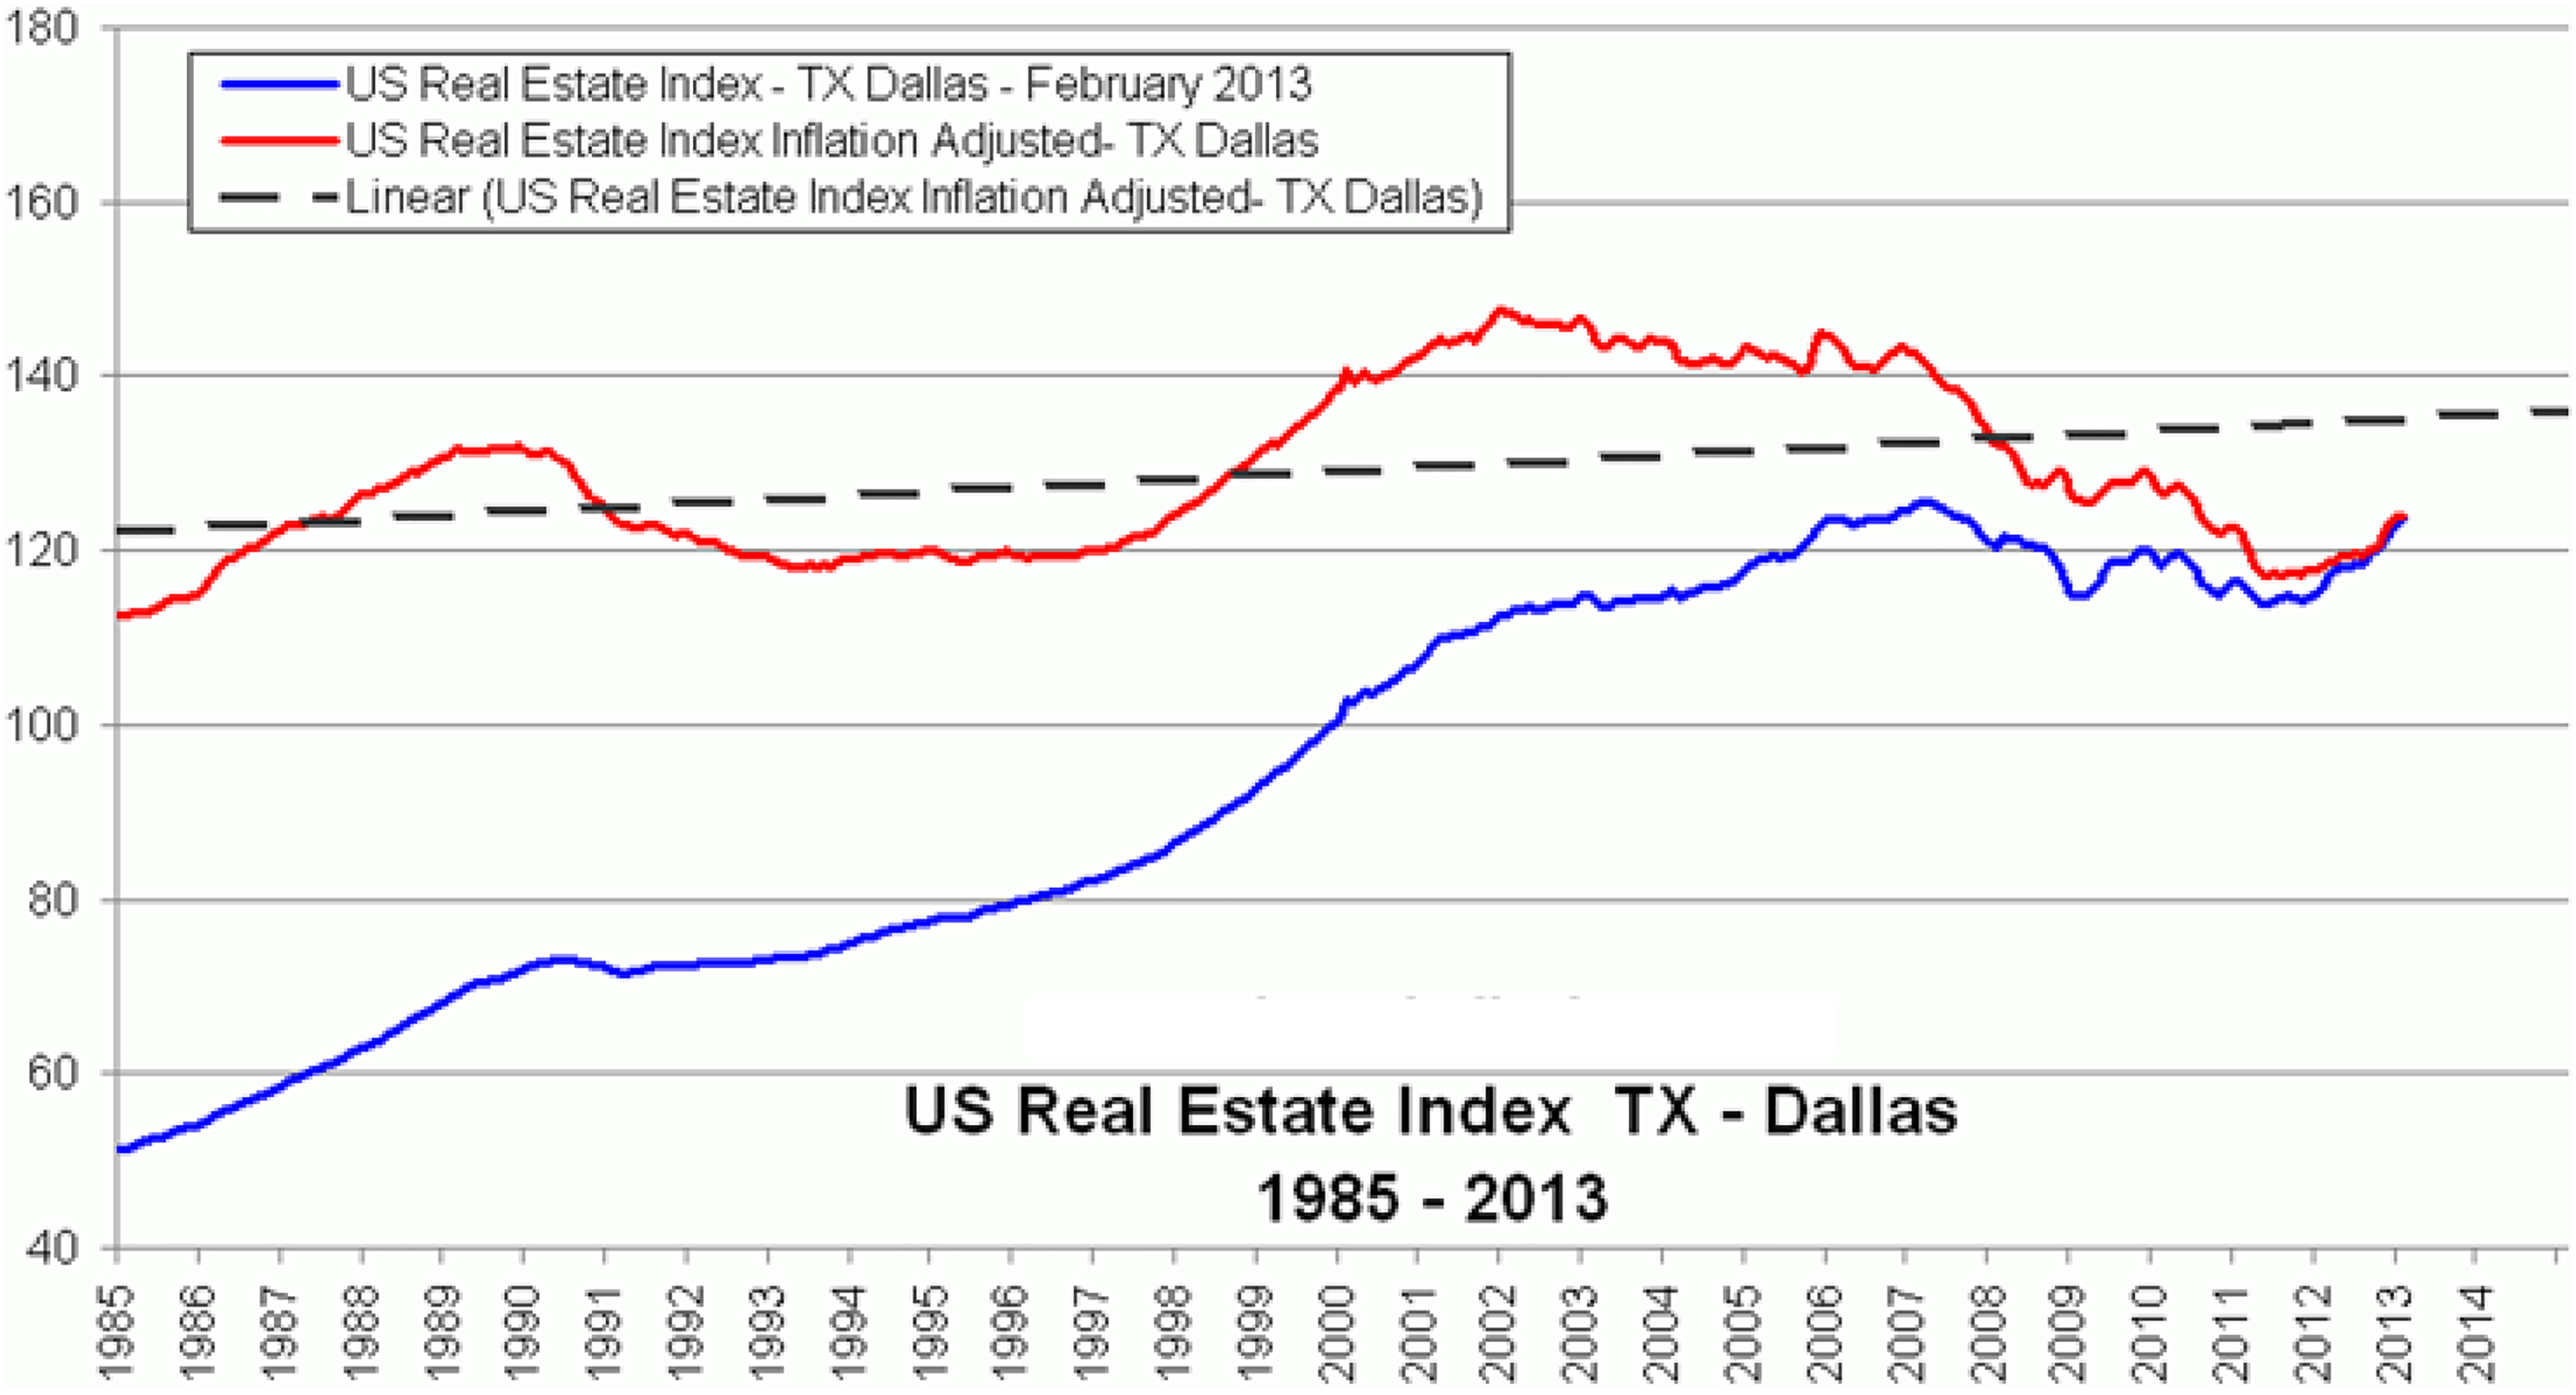
Real estate index historical trend chart for Dallas, Texas (Source: www.aboutinflation.com).
The TIF is one of the most prevalent tools for generating public and/or private financing for urban redevelopment. The TIF only targets dedicated tax revenues that are generated by new real estate developments rather than simply increasing property tax rates, thus it is widely accepted by local governments. There are thousands of active TIF districts in the United States, from small- and mid-sized cities to large metropolitan cities, and TIF has been recognized as an innovative approach to stimulate improvements in distressed, underdeveloped, or underutilized districts where development might never happen without governmental interventions. 35,36
Although many features of TIF development help to improve neighborhood walkability, a significant variation exists in the level of walkability among TIF neighborhoods due to uneven funding investment and development performance and status. Given the specific time frame within the context of a recession and TIF interventions, Dallas’ TIF Districts offer a unique opportunity to study the economic resilience of housing values in neighborhoods with varying levels of walkability during the housing market downturn.
Study Design and Analysis
Based on the Walk Score methodology, scores equal and above 50 were considered walkable and those under 50 were car-dependent. Therefore, 2799 SF homes within 18 TIF districts were categorized into walkable group (treatment, N = 1083) and unwalkable group (control, N = 1716) based on their Walk Score. The difference of each SF home values between prerecession (2008) and postrecession (2012) served as the values for treatment and control comparison. Our hypothesis was that SF homes in walkable neighborhoods (treatment) held their value more (loss less) than their counterparts in unwalkable neighborhoods (control) during the Great Recession. The one-to-one matching of the treatment-control SF pairing was implemented using PSM.
The PSM is a statistical matching technique widely used in social epidemiology studies to estimate the effect of a treatment by accounting for the covariates that predict receiving the treatment effect. 37 It can be used to address the selection bias within a natural experimental design and distribute observed confounding equally between the intervention and control groups. 34 The PSM examines the conditional probability of a unit to be assigned to a particular treatment, given a set of observed covariates, and reduces the selection bias by equating groups based on these covariates. 38,39
The Walk Score data are collected in 2014 from Walk Score (http://www.walkscore.com). Walk Score generates the normalized scores based on the network distance from each location to its nearby walk-friendly destinations or amenities using a spatial decay function, as well as other predictors such as intersection density, block length, and pedestrian friendliness. 40 It is the most widely available and validated walkability index. 41 -43 The Walk Score only provides dynamic scores and past years’ data are unavailable to retrieve. However, in reality, those variables used in calculating Walk Score (eg, destinations/land uses, street networks) do not change significantly over a short period of time; and therefore, the scores between 2012 and 2014 are likely to be very similar making little influence on the results. Hence, the 2014 Walk Score is one of the best available proxies to represent the walkability for the study neighborhoods. The housing data and variables were collected from the Dallas Planning Office, OnTheMap (https://onthemap.ces.census.gov), and Dallas Central Appraisal District.
In additional to performing the PSM for the treatment and control groups matching, DID method was also applied to compare pre- and postrecession changes in SF home prices between walkable and unwalkable neighborhoods. The DID is widely used in econometrics to mimic an experimental design using observational study data by examining the differential effect between treatment and control groups in a natural experimental design. 44,45 In this study, DID calculated the effect of neighborhood walkability on SF home values, by comparing the average value changes over 2008 to 2012 between the treatment group and the control group.
As shown in Table 1, each SF housing units in walkable neighborhoods was matched with a SF unit in unwalkable neighborhoods, based on the confounding variables (building attributes and residential location factors). These variables are the most important predictors of SF housing values/value changes according to the Hedonic Pricing theory and housing and real estate literature 33,34,46,47 and therefore help reduce the selection bias.
Variables Used for Parcel-Level Matching.
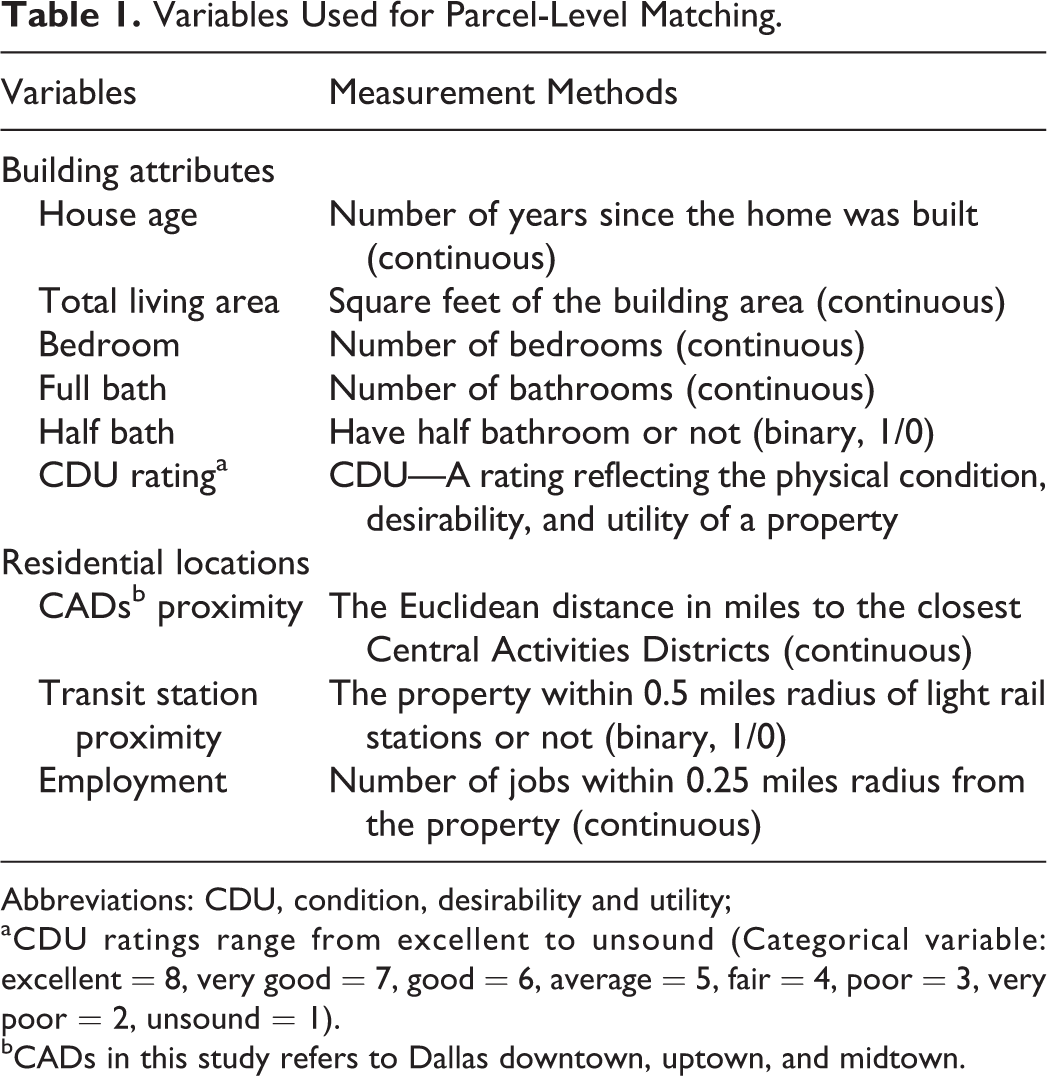
Abbreviations: CDU, condition, desirability and utility;
aCDU ratings range from excellent to unsound (Categorical variable: excellent = 8, very good = 7, good = 6, average = 5, fair = 4, poor = 3, very poor = 2, unsound = 1).
bCADs in this study refers to Dallas downtown, uptown, and midtown.
Followed by a PSM approach, 32,48,49 binary logit models and t tests were used to calculate propensity scores and validate the matching. Average treatment effects (ATEs) were examined to measure the economic resilience of walkable neighborhoods on housing value changes. A binary logit model was used to estimate propensity scores for each SF housing unit by including covariates of building attributes and residential location factors. Of 1083 SF housing units in the treatment group, 624 matched successfully with the most identical one in the control group. Table 2 shows the comparison of covariates used for the matching in walkable and unwalkable neighborhoods. Before matching, except for condition, desirability, and utility (CDU) rating, all covariates were significantly different between the 2 groups, as indicated by the t test. After matching, the standardized mean differences for all covariates were less than 0.1; and there was no significant difference (P > .05) based on the t test. Moreover, the overall χ2 balance test was not significant, suggesting that overall matching was satisfactory. Therefore, all observed covariates were well balanced after matching.
Descriptive Statistics and Mean Comparison Test for the Covariates of Parcel-Level Matching (SF Housing Units, Before Matching Vs After Matching).
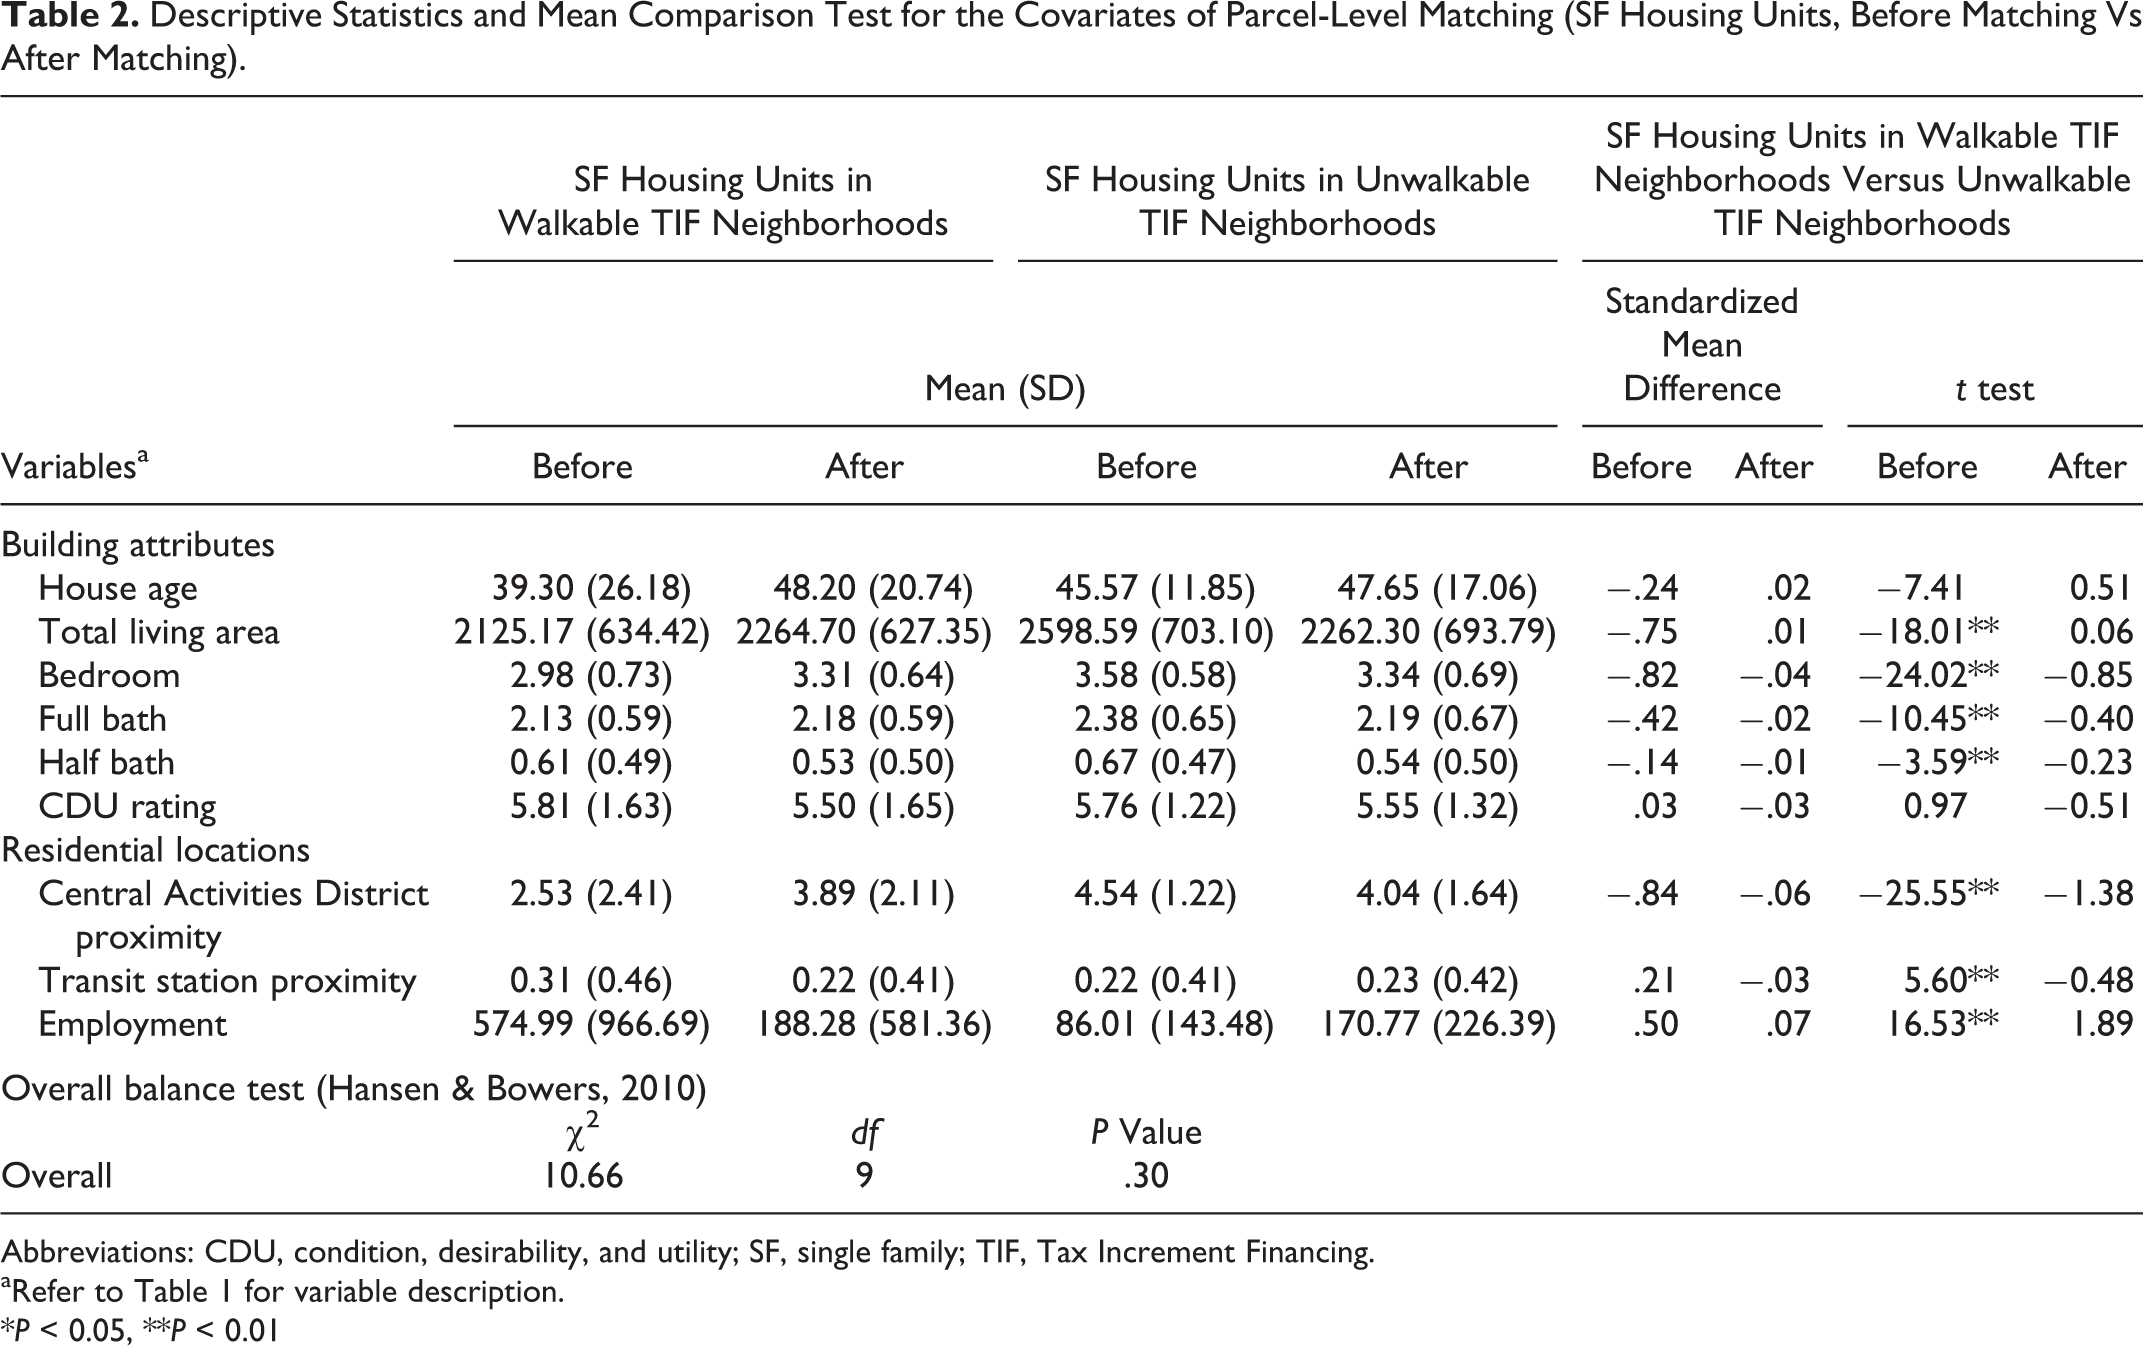
Abbreviations: CDU, condition, desirability, and utility; SF, single family; TIF, Tax Increment Financing.
aRefer to Table 1 for variable description.
*P < 0.05, **P < 0.01
Results
As shown in Table 3, before matching, the average Walk Score for SF homes in walkable neighborhoods was 69.21 compared to 37.64 for those in unwalkable neighborhoods. The average changes in SF housing values between 2008 and 2012 were negative for both walkable and unwalkable neighborhoods, illustrating that SF homes experienced value losses in both types of the neighborhoods. However, SF housing prices in walkable neighborhoods appeared to decrease more than those in unwalkable neighborhoods, before conducting PSM and DID methods to control for selection bias.
Descriptive Statistic for Walk Score and Housing Value Changes for SF Housing in Walkable TIF Neighborhoods Versus Unwalkable TIF Neighborhoods (Before Parcel-Level Matching).
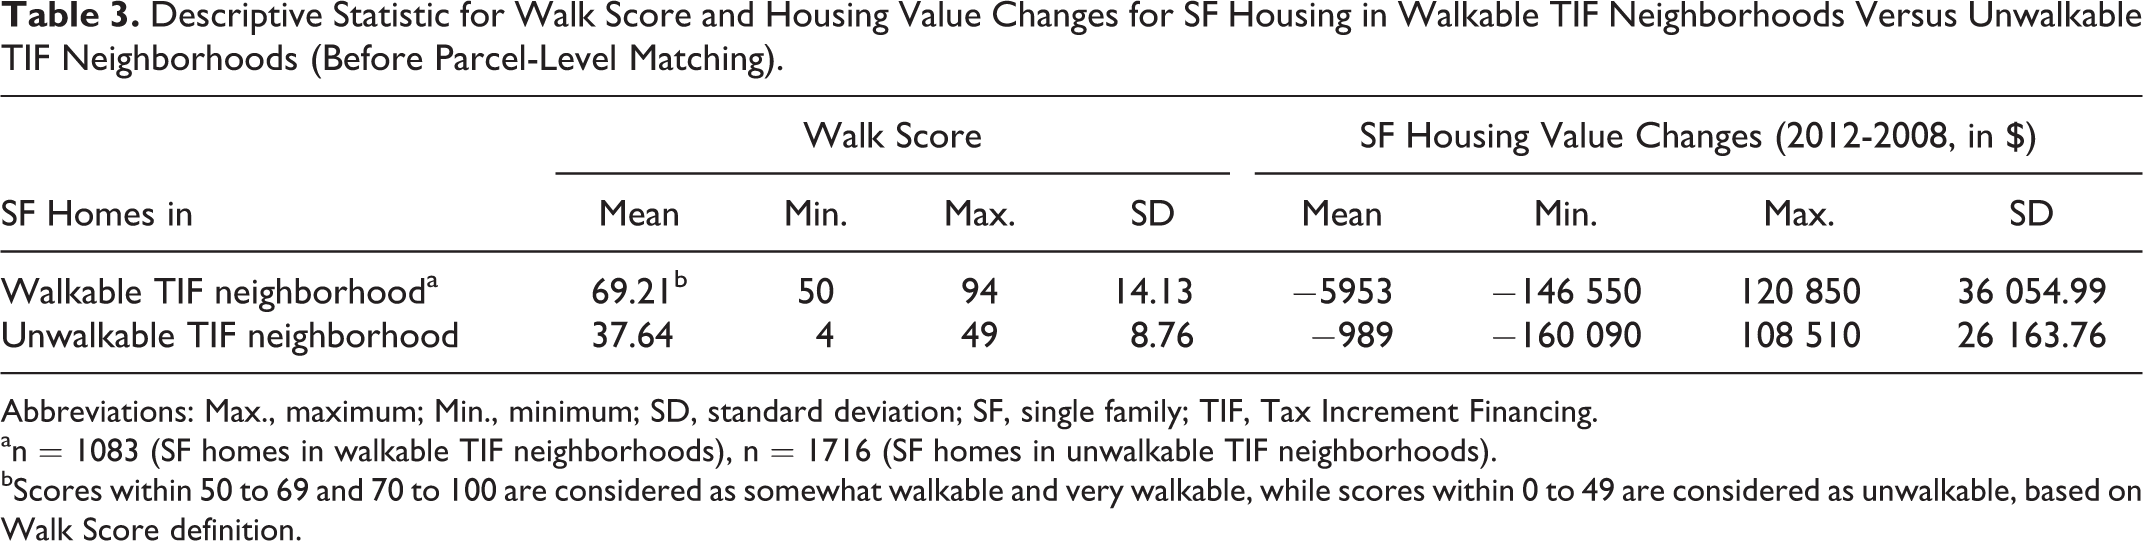
Abbreviations: Max., maximum; Min., minimum; SD, standard deviation; SF, single family; TIF, Tax Increment Financing.
an = 1083 (SF homes in walkable TIF neighborhoods), n = 1716 (SF homes in unwalkable TIF neighborhoods).
bScores within 50 to 69 and 70 to 100 are considered as somewhat walkable and very walkable, while scores within 0 to 49 are considered as unwalkable, based on Walk Score definition.
To assess the actual impact of neighborhood walkability on SF housing value resilience during the Great Recession, the ATEs were assessed after matching was conducted using PSM and DID methods. As shown in Figure 2, after controlling the building attributes and residential location factor (covariates), the ATE for housing value resilience was assessed as the difference in average SF housing value changes between the treatment group and the control group after matching. In addition, the observed effect is also shown as the mean difference of housing value resilience between the treatment group and the control group before matching.
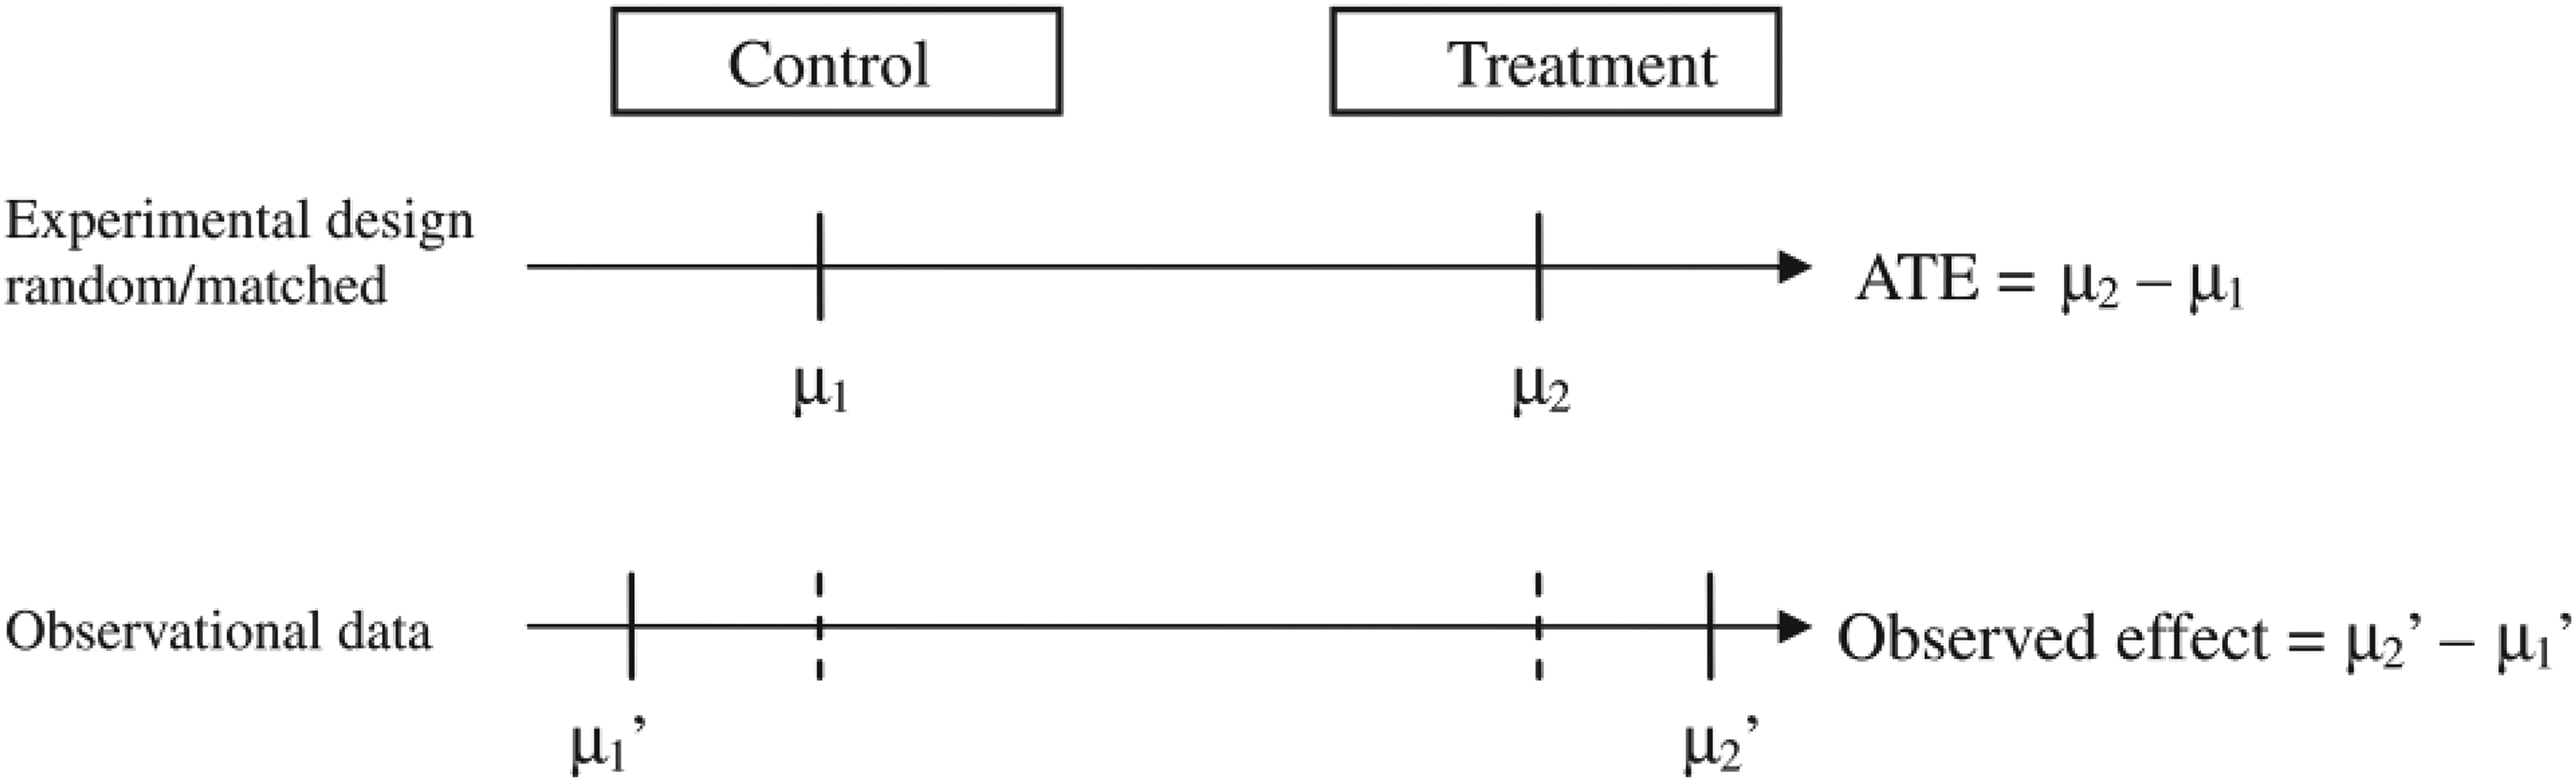
Relationship between observed effect and average treatment effect. 48 μ1 and μ2 are means of property values of control and treatment after matching, and μ1′ and μ2′ means of property values of control and treatment after matching, respectively.
Table 4 shows the ATE for housing value resilience in walkable neighborhoods was $4566 ($3930 + $636). That is, after controlling for the covariates, SF homes in walkable TIF neighborhoods held $4566 (2.08%) more on housing value on average than their counterparts in unwalkable TIF neighborhoods during 2008 to 2012. In other words, from 2008 to 2012, a typical SF home in an unwalkable TIF neighborhood would be expected to lose $4566 more in its value than an equivalent one located in a walkable neighborhood.
Descriptive Statistic and the Effect of SF Housing Value Resilience in Walkable TIF Neighborhoods (Treatment) Versus Matched Unwalkable TIF Neighborhoods (Control) Before and After Propensity Score Matching.a

Abbreviations: ATE, average treatment effect; PSM, propensity score matching; SF, single family; TIF, Tax Increment Financing.
aObs. Effect is housing value resilience before matching; ATE, the housing value resilience after matching; Before, before PSM; After, matched after PSM.
Proportional changes in housing values were also calculated. After controlling for the covariates, on average, SF homes experienced a 1.79% value gain in walkable TIF neighborhoods in postrecession (2012) compared to prerecession (2008), whereas their counterparts in unwalkable TIF neighborhoods experienced a 0.29% value loss during the same period. That is a relative 2.08% higher home value resilience for SF homes in the walkable TIF neighborhoods than those in control neighborhoods. Compare to an average 15% SF home value loss citywide during the Great Recession, the amount of loss in unwalkable TIF neighborhoods is significantly lower, suggesting that TIF contributed to the resilience of SF home values during the Recession in Dallas, Texas.
Discussion
This study documents that walkable TIF neighborhoods perform better than unwalkable TIF neighborhoods in Dallas during an economic downturn. On average, walkable neighborhoods preserved $4566 (2.08%) more on SF housing values than their counterparts, a considerable economic benefit for homeowners. Therefore, walkable neighborhoods with completed sidewalks, accessible daily destinations, and neighborhood amenities (eg, parks, restaurants) appear to protect housing prices from decreasing as much as unwalkable neighborhoods during a housing market downturn. It is also consistent with recent housing and real estate literature that having walkable environments and more outdoor amenities within neighborhoods promotes home prices. 33,50 -52 Moreover, this study echoes the claim that walkable urban design is a premise to effectively increase physical activity, while protecting wealth for homeowners in their home equities. Results from this study provide equity insights given that lower income households can be faced with mortgage default when housing values drop significantly, and walkable neighborhood can help hold a stable and healthy housing market during a housing market downturn. However, walkable neighborhoods are becoming less and less affordable for lower income home buyers due to the same underlying unmet demand that created the resilience in value found in this study.
Existing evidence has identified why promoting walking and walkable neighborhood environments is a vitally important public strategy in the United States. However, additional investments in research, surveillance, and evaluation are needed to promote walkable community design and address disparities in walking and in the supply of walkable neighborhoods. Lack of economic analyses is a gap in both research and evaluation. By addressing the selection bias through PSM and DID approaches, this study extends the existing studies on economic impacts of walkable neighborhoods using a natural experimental design to strengthen evidence of causality. The study design also provides the ability to test an ordered stimulus—response relationship between an economic downturn (stimulus) and comparative value retention (response) for walkable versus unwalkable environments. Moreover, this study primarily examined walkable neighborhoods who were retrofitted by TIF during the Great Recession, which is a policy evaluation of walkable community designs. The fact that even those in unwalkable TIF neighborhoods held the SF housing values significantly more than the citywide average (0.29% loss compared to 15% loss citywide) indicates the public infrastructure investment projects implemented through TIF programs can contribute to the housing value resilience during economic downturns.
The housing market has become more diversified, and neighborhood preference has been changing in recent years. Although the preference of certain home buyers toward automobile neighborhoods remains strong, there is a shifting trend in demand toward walkability and some market responses with modest increases in the supply of walkable places. 10,53 A recent 2014 Political Polarization and Typology Survey randomly surveyed 10 013 Republicans and Democrats and found that 48% of them preferred to live in walkable neighborhoods than automobile-oriented neighborhoods. 54 The supply of walkable neighborhoods falls far short of the demand, with the vast majority of new homes still being built in auto-oriented environments. 10 Support from the policy makers and public sectors on promoting walkable neighborhoods has been stronger in recent years; thus, zoning regulations and design guidelines along with more supportive lending policies may become more widely available to increase the supply of homes in walkable environments.
The public and media are becoming more favorable toward walkable neighborhoods. It is also notable that some segments of the population are starting to pay more attention to physical activity and fitness and are even willing to pay a premium for walkable neighborhoods. 55 Practitioners and scholars should work together to more effectively translate new evidence into actionable strategies to promote walking and walkable neighborhoods. Examining the economic vitality of walkable neighborhoods provides a new direction and identity of active living research to revitalize a more robust and meaningful urban lifestyle.
This study has several limitations. First, it considered ATEs among the walkable neighborhoods in 18 TIF districts in Dallas, and therefore its findings may not be generalizable to other communities. Second, the limitation related to data availability should be noted. Variables had slight variations in their data collection times, especially the Walk Score data which were captured 2 years after the postrecession data. However, given the slow pace of the change in the built environment and neighborhood walkability features, the likely minimal uncaptured variance is not expected to make a significant impact on the results. Third, the selection of study covariates for matching SF homes relied on the findings from previous studies and data availability. It is possible that there are additional unobserved confounding influences, which might have caused an overestimation of the treatment effect. In addition, to achieve an adequate level of PSM model performance, the baseline housing values were not included as a covariate. Although both absolute and percent values of the treatment effects have been reported, the potential confounding effect from baseline housing values may still exist, and further studies are needed to better understand such effect. Fourth, this study did not address the housing value resilience for non-SF homes (eg, apartment, mobile home). Last, due to the limitation of matching methods and data availability, except the walkability measured by Walk Score, this study was unable to consider other variations of TIF neighborhood-level indicators (eg, health disparity, socioeconomic factors, uneven TIF performance and development) and clustering effects. Future study may also consider potential covariates at the neighborhood level and conduct 2-level matching in both neighborhood-level and parcel-level.
So What?
Implications for Health Promotion Practitioners and Researchers
What is already known on this topic?
Great enthusiasm has been motivated by recent literature and initiatives to promote walking and walkable neighborhoods. A growing body of literature showed that walkable neighborhoods promote physical activity because they provide an array of destinations within walking distance and direct access to parks through a connected street network. Other studies have identified environmental “co-benefits” of walkable neighborhoods, such as the reduction in carbon emission and air pollution. However, economic implications and long-term demand for walkable neighborhoods have been argued to be relatively unknown.
What does this article add?
This study fills this gap by documenting the relative price resilience over time between walkable versus unwalkable neighborhoods experiencing an economic recession. This study employed a natural experimental design to compare single-family (SF) home value changes in walkable versus unwalkable neighborhoods during the Great Recession in Dallas, Texas. It also added methodological insights to this area of research, by using propensity score matching and difference in differences approaches, which contributed to reducing the selection bias and strengthening causal evidence. On average, the SF homes in walkable neighborhoods retained $4566 (2.08%) more on its value than their counterparts in unwalkable neighborhoods.
What are the implications for health promotion practice or research?
The benefits of and demand for walkable communities are solid. However, unwalkable and auto-oriented suburban communities continue to be preferred in most new residential developments. This study aims to help planners and decision-makers in public health and other relevant sectors, by documenting the sustained economic benefits of building walkable communities. The improved understanding of the economics of walkable communities could be used for more effective advocacy. Results from this study can be integrated with research that demonstrates health-care cost savings of walkable environments to create an even more comprehensive set of evidence-based interventions to increase their supply.
Footnotes
Acknowledgments
The authors thank Dallas Central Appraisal District and City of Dallas Office of Economic Development for providing data.
Declaration of Conflicting Interests
The author(s) declared the following potential conflicts of interest with respect to the research, authorship, and/or publication of this article: The authors confirm that the manuscript has been submitted solely to AJHP and that it has not been previously published. The authors have full responsibility for the whole paper. The authors have full access to all of the data, research and writing process in this study, and the authors take complete responsibility for the integrity of the data and the accuracy of the data analysis.
Funding
The author(s) received no financial support for the research, authorship, and/or publication of this article.