



Abstract
Purpose:
The “fat-but-fit” paradigm has been evaluated. However, the duration of overweight/obesity within the “fat-but-fit” paradigm (ie, assessing body mass at more than 1 time point) has not been extensively evaluated, which was this study’s purpose.
Design:
Cross-sectional.
Setting:
National Health and Nutrition Examination Survey 2003 to 2006.
Participants:
Ages 36 to 85; N = 3621.
Measures:
Physical activity assessed via accelerometry. Medical multimorbidity was assessed via physician diagnosis of 13 chronic diseases. Height and body mass were directly measured for current body mass index (BMI), and 10-year prior BMI was calculated using current height and self-reported weight 10 years prior. Six mutually exclusive groups were created: (1) active, normal weight now and 10 years ago; (2) inactive, normal weight now and 10 years ago; (3) active, overweight/obese now but not 10 years ago; (4) active, overweight/obese now and 10 years ago; (5) inactive, overweight/obese now but not 10 years ago; and (6) inactive, overweight/obese now and 10 years ago.
Analysis:
Logistic regression.
Results:
Compared to group 1, adjusted odds ratios (ORs) were as follows: group 2: OR = 2.0 (P = .004), group 3: OR = 1.7 (P = .004), group 4: OR = 2.5 (P < .001), group 5: OR = 2.9 (P < .001), and group 6: OR = 4.8 (P < .001).
Conclusions:
All patterns of weight change/duration and activity level altered the odds of medical multimorbidity, suggesting that the duration of overweight/obesity should also be taken into consideration when assessing the “fat-but-fit” paradigm.
Purpose
The high prevalence of multimorbidity (exceeding 77% in those ≥ 65 years), 1 classified as having more than one chronic disease, is alarming, considering multimorbid individuals are at an approximate 40% increased risk of premature mortality. 2 While the majority of studies assessing the medical consequences of overweight/obesity and physical activity (termed the “fat-but-fit” paradigm) 3 have focused on individual chronic diseases, much less is known on the effects of these parameters on increasing the risk of multimorbidity. Also underinvestigated is the interaction between physical activity and prolonged obesity on health, let alone multimorbidity. Therefore, the purpose of this brief study was to examine how the duration of overweight/obesity impacts the “fat-but-fit” paradigm, since termed the WATCH (Weight and Time Contribute to Health) paradigm, 4 –7 and its influence on multimorbidity.
Methods
Design
Data from the 2003 to 2006 National Health and Nutrition Examination Survey (NHANES) were used. Further details of NHANES can be found elsewhere (http://www.cdc.gov/nchs/nhanes.htm). Six mutually exclusive groups were created based on overweight/obesity status, overweight/obesity duration over a 10-year period, and objectively measured physical activity level (Figure 1).
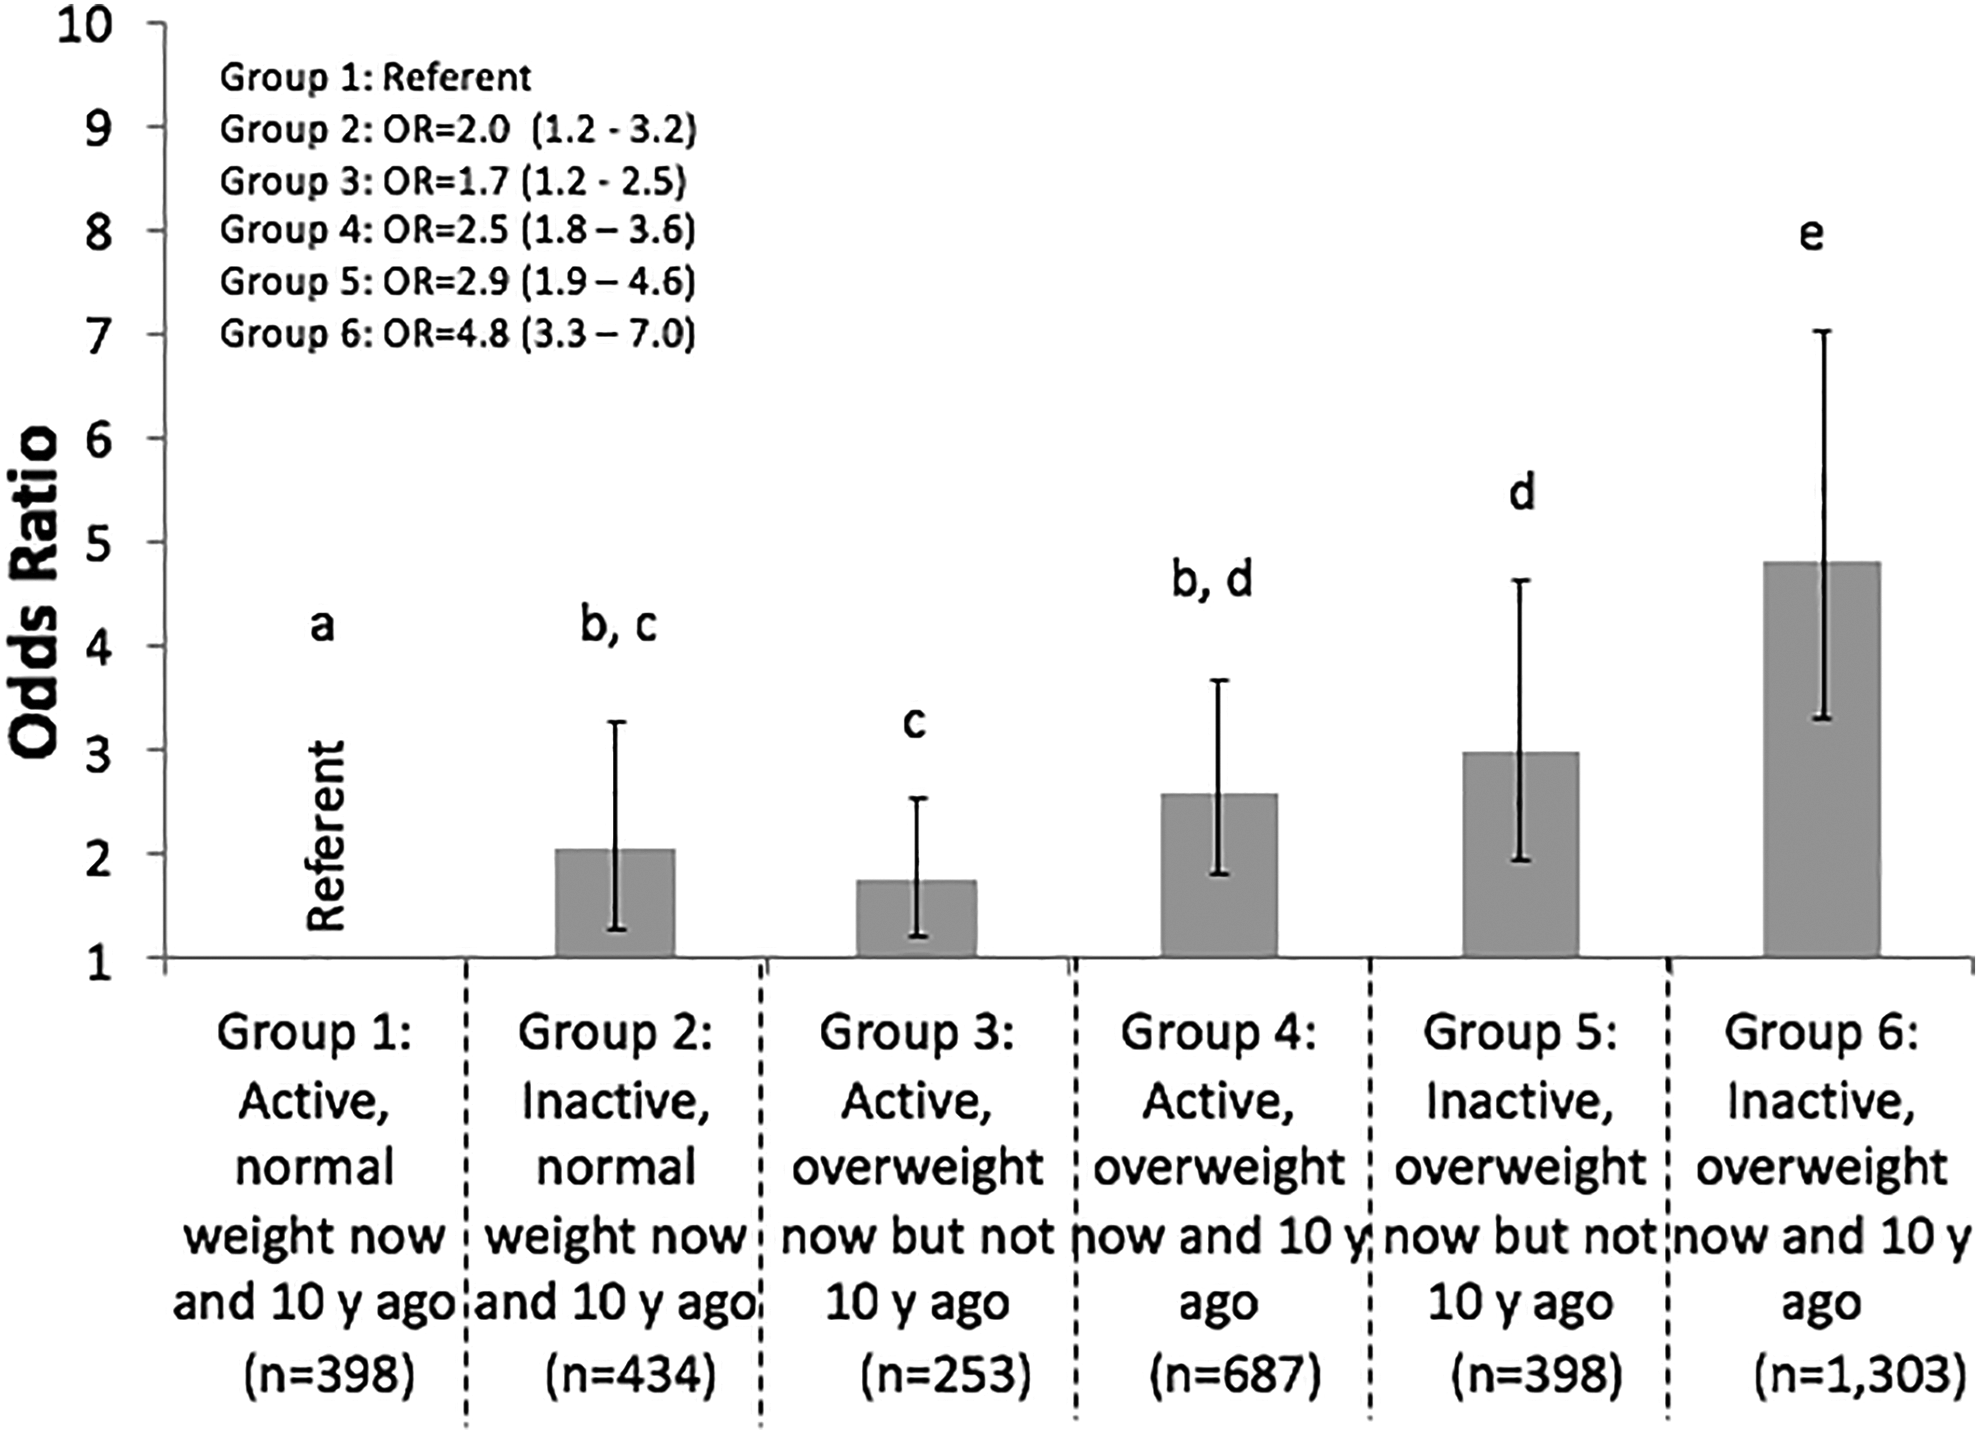
Adjusted odds ratios and 95% confidence intervals demonstrating the association between individual groups and multimorbidity. Different letters indicate differences between groups. Notably groups 1 and 6 were significantly different than all other groups. Covariates included age (years; continuous), race/ethnicity (Mexican American, non-Hispanic black, and other vs non-Hispanic white), cotinine levels (mg/dL; continuous), C-reactive protein (mg/dL; continuous), poverty to income ratio (family income/poverty guidelines; continuous), healthy eating index (ranging from 0 to 100 based on proportion of foods consumed per 1000 kcal; continuous), and change in physical activity level (less active now than 1 year ago or same activity level as 1 year ago vs more active now than 1 year ago; categorical).
Sample
All 3621 individuals (ages 36-85 years) provided informed written consent for this study, which was approved by the ethics committee of National Center for Health Statistics. Individuals were excluded from the analysis if they did not did not have sufficient accelerometer wear time (n = 1324) or did not fall into 1 of the 6 WATCH groups (n = 214).
Measures
Overweight/obesity was classified as having a body mass index (BMI) ≥ 25 kg/m2 (results were similar when using a higher [30 kg/m2] cut point; data not shown). Height and body mass were directly measured for current BMI, and 10-year prior BMI was calculated using current height and self-reported weight 10 years prior. Physical activity was assessed using an ActiGraph accelerometer with moderate-to-vigorous physical activity (MVPA) defined as ≥2020 activity counts/minute (Pensacola, FL). 8 Only those having at least 4 days of 10+ h/d of monitoring were included in the analyses. Nonwear time was identified as ≥60 consecutive minutes of zero activity counts, with allowance for 1 to 2 minutes of activity counts between 0 and 100. Individuals engaging in ≥150 MVPA min/wk were defined as physically active, 9 and this volume of exercise has been associated with health outcomes when assessed via accelerometry. 10 Multimorbidity was defined as having ≥2 of the following physician-diagnosed (unless noted otherwise) chronic diseases 11 : arthritis, asthma, bronchitis, cancer, congestive heart failure, coronary artery disease, diabetes, emphysema, liver disease, stroke, high total cholesterol (>240 mg/dL), low high-density lipoprotein levels (<40 mg/dL), and hypertension (≥140/90 mm Hg).
Analysis
All analyses were performed using Stata (version 12). Logistic regression was employed to examine the association between the WATCH paradigm and multimorbidity (outcome). All analyses were adjusted for covariates detailed in Figure 1. Significance was set at P < .05.
Results
Sample sizes for each group are displayed in Figure 1. The percentage of multimorbid individuals in each group were as follows: group 1: 18.6%, group 2: 41.7%, group 3: 22.3%, group 4: 30.2%, group 5: 40.8%, and group 6: 55.6%. Adjusted odds ratios and 95% confidence intervals for each group are displayed in Figure 1. Individuals who were inactive were at an increased odds of multimorbidity compared to their normal weight counterparts (Figure 2A), and the odds of multimorbidity were increased as the classification and duration of overweight/obesity worsened (Figure 2B). Analyses were recomputed excluding the 1-year change in physical activity covariate and the results remained unchanged.

All values are presented as adjusted odds ratios and 95% confidence intervals. A, Results of 3 independent analyses (separated by the dotted line) comparing inactive individuals to active individuals within the same weight classification/duration. *Significantly different from active referent group. B, Results of 2 independent analyses (separated by the dotted line) comparing different weight classifications/durations across activity levels, with the normal weight groups serving as the referent group for the respective activity status. *Significantly different from normal weight now and 10 years ago significantly different from overweight/obese now but not 10 years ago. Differences across all groups are detailed Figure 1.
Discussion
Summary
The major finding of this study was that all patterns of change in weight status/duration and physical activity level were independently associated with medical multimorbidity. While physical activity appeared to reduce the odds of multimorbidity among all individuals independent of weight classification/duration (Figure 2A), all individuals were at an elevated odds of multimorbidity if they were overweight/obese, and this was even more pronounced in those who were overweight/obese for longer durations (Figure 2B). The greater odds of multimorbidity that accompanied longer durations of overweight/obesity, specifically among active individuals (groups 3 and 4), would allude to the importance of assessing the duration of overweight/obesity within the context of the “fat-but-fit” paradigm. This may be the result of longer durations of overweight/obesity subsequently resulting in more severe obesity (eg, class I, class II obesity), which has been shown to produce higher odds of multimorbidity. 12
Limitations
We could not determine trajectories in body mass over the 10-year period; however, this was unlikely to cause misclassifications among the groups as the majority of individuals either maintain or increase body mass with age. 13 Additionally, self-reported body mass was used for prior BMI; however, the NHANES does not provide objectively measured body mass 10 years prior.
Significance
These results suggest that physical activity level, as well as the status and duration of overweight/obesity, should be assessed by clinicians as they are strong predictors of multimorbidity.
So What?
What is already known on this topic?
Physical activity has been shown to reduce the odds of multimorbidity and mitigate the health consequences associated with overweight/obesity.
What does this article add?
Physical activity reduced the association with multimorbidity among all weight classification/duration groups; however, individuals who were overweight/obese for longer durations were at an increased odds of multimorbidity independent of physical activity status.
What are the implications for health promotion practice or research?
With respect to multimorbidity odds, clinicians should assess their clients’ current BMI as well as the duration in which they have been at a certain weight classification and promote physical activity independent of weight classification/duration.
Footnotes
Declaration of Conflicting Interests
The author(s) declared no potential conflicts of interest with respect to the research, authorship, and/or publication of this article.
Funding
The author(s) received no financial support for the research, authorship, and/or publication of this article.