
Abstract
Purpose:
The purpose of this study was to examine the association between the presence of supportive community planning documents in US municipalities with design standards and requirements supportive of active living.
Design:
Cross-sectional study using data from the 2014 National Survey of Community-Based Policy and Environmental Supports for Healthy Eating and Active Living.
Setting:
Nationally representative sample of US municipalities.
Participants:
Respondents are 2005 local officials.
Measures:
Assessed: (1) The presence of design standards and feature requirements and (2) the association between planning documents and design standards and feature requirements supportive of active living in policies for development.
Analysis:
Using logistic regression, significant trends were identified in the presence of design standards and feature requirements by plan and number of supportive objectives present.
Results:
Prevalence of design standards ranged from 19% (developer dedicated right-of-way for bicycle infrastructure development) to 50% (traffic-calming features in areas with high pedestrian and bicycle volume). Features required in policies for development ranged from 14% (short/medium pedestrian-scale block sizes) to 44% (minimum sidewalk widths of 5 feet) of municipalities. As the number of objectives in municipal plans increased, there was a significant and positive trend (P < .05) in the prevalence of each design standard and requirement.
Conclusions:
Municipal planning documents containing objectives supportive of physical activity are associated with design standards and feature requirements supportive of activity-friendly communities.
Keywords
Purpose
Communities can be designed with supports to encourage individuals to be more physically active. 1 –3 A variety of community design features supportive of active living, such as continuous sidewalk coverage and pedestrian amenities, have been associated with increased physical activity. 4 –6 One way communities can help their residents improve or obtain access to these supports is by adopting activity-friendly design standards or guidelines or by including specific feature requirements in their policies for new development. For example, requiring continuous sidewalk coverage may be part of a community’s requirements for new development and can, as the community grows, help enhance a resident’s opportunity for physical activity.
Design standards and feature requirements for a community can be developed as part of, or in response to, community planning documents. 7 For example, a planning document can include design policies for consideration, or a plan can provide a specific objective, and design guidelines may be a way to achieve the objective. 8 Plans are often broad and cover a wide range of topics, either in one general plan or broken into multiple standalone plans, 9 such as land use plans, transportation plans, and bicycle or pedestrian plans. 10 Plans can add levels of specificity through objectives that can further focus community efforts. For example, to promote activity-friendly design, objectives can be included for (1) adopting a Complete Streets policy, 11,12 (2) promoting street connectivity, and (3) encouraging mixed-use development.
Our hypothesis is that the presence of plans supportive of physical activity—and objectives within these plans—is positively associated with the presence of physical activity supportive design standards and feature requirements in policies for development. We expect that communities that provide language emphasizing physical activity supportive environments in their planning documents are also taking steps to implement these plans and objectives through supportive design standards and feature requirements.
To examine this hypothesis, we used nationally representative data from the National Survey of Community-Based Policy and Environmental Supports for Healthy Eating and Active Living (CBS HEAL). The Centers for Disease Control and Prevention (CDC) surveyed local officials on the topic of policies supportive of active living and healthy eating in CBS HEAL, including plans, objectives, design standards, and features in their communities that contribute to walkability. These data allow us to examine the cross-sectional association between the presence of plans and objectives supportive of active living with (1) 3 design standards—installation of dedicated bicycle infrastructure for roadway expansion projects, developer dedicated right-of-way to local jurisdictions for development of bicycle infrastructure, and traffic-calming features that increase roadway safety in areas with high pedestrian and bicycle volume, and (2) 5 feature requirements in policies for development including continuous sidewalk coverage, a minimum sidewalk width of 5 feet, and parking standards that encourage walking and bicycling.
The purpose of this study is to first estimate the prevalence of US municipalities with design standards and feature requirements supportive of active living. The second is to determine whether having a plan with a higher number of objectives supportive of active living is associated with a higher prevalence of design standards and feature requirements found in municipalities.
Methods
Design
CBS HEAL was conducted from May through September 2014 by CDC’s Division of Nutrition, Physical Activity, and Obesity.
Sample
The sample pool of potential respondents was based on 2007 Census of Governments (COG) units, which include municipalities and townships depending upon the state’s classification. 13 In states with geographic overlap between municipal and township levels of government, the eligible sample pool was modified, and overlapping townships were excluded. The final sample pool included 4484 COG units, which we will reference as municipalities. Municipalities with population size less than 1000 were excluded because small communities were less likely to have policies and practices that support healthy eating and active living. 14 To create a nationally representative sample of municipalities, sampling was stratified by census region and urban status and sorted by population size with a fixed sampling interval. Participating municipalities were each assigned a sample weight. Sample weights were constructed to reflect the probability of municipality selection (ie, inverse of the probability of selection). Then a weighting class nonresponse adjustment was applied to each sampling weight to minimize the bias potential. Nonresponse adjustments were based on census region (4) and urban status (2) for a total of 8 weighting classes. Adjustments were calculated as the ratio of 2 weight sums within each weighting class: (1) the sum of the unadjusted weights over nonparticipants and participants combined and (2) the sum of the unadjusted weights over participants only.
The primary respondent for the survey was the city or town manager, city or town planner, or a person with similar responsibilities. Respondents were encouraged to ask municipal officials in other departments, such as tax, procurement, parks and recreation, or human resources, for help in completing the survey, if needed. Respondents were given a unique identifier that allowed them to complete the survey through a secure website. They also had the option of completing a paper version of the survey. A total of 2029 surveys were completed and returned, for a response rate of 45%. Each nonresponsive municipality received up to 3 follow-up attempts including a series of telephone calls and e-mail reminders. Municipalities that were missing a response to whether they had a plan (master plan, land use plan, transportation plan, or bicycle/pedestrian plan) were excluded, resulting in a final study sample of 2005.
Measures
Municipality characteristics
Characteristics about municipalities were obtained from census sources and merged by using each municipality’s unique Federal Information Processing Standards place code. 15 Population size was categorized as a 3-level variable (<2500 persons, 2500-49 999 persons, and ≥50 000 persons). Urban or rural status is based on the percentage of the population in an incorporated place that live in an urbanized area according to the 2010 US Census Urban Area to Place Relationship File. 16 Municipalities with the majority (>50%) living in an urbanized area are categorized as urban; those with 50% or less are categorized as rural. Geographic region was defined in terms of the 4 major regions identified by the US Census Bureau: Northeast, Midwest, South, and West. 17 Median education level, poverty level, and race/ethnicity of the population of each municipality were estimated from the 2009-2013 American Community Survey. 18 Education was categorized according to the median education level (high school graduate or college graduate), poverty level was categorized as ≥20% or <20% below poverty level, and the race/ethnicity category was designated by ≤50% or >50% non-Hispanic white.
Plans and objectives
Questions about plans, and objectives included within plans, were asked during the first and second modules of the survey, entitled “Communitywide Planning Efforts for Healthy Eating and Active Living.” This section begins with the statement: “These questions ask about communitywide planning documents that local governments may have created or adopted that promote healthy eating and active living. These may include Comprehensive/General Plans, or other plans, such as a transportation plan, a parks and recreation plan, or a bicycle and pedestrian plan.” To assess the presence of plans, local officials were asked whether their government has a comprehensive/general plan, with response options of yes, no, or don’t know. Respondents were further questioned whether the local government has a land use plan, transportation plan, or bicycle/pedestrian plan either as a standalone plan or included with the comprehensive/general plan. Responses of “don’t know” ranged from 86 (land use 4%) to 133 (transportation plan 7%) and were included with “no” responses.
Those who responded yes to having any plan were then asked, “Does your local government have any of the following objectives included in the plan(s)? These objectives should be written in the plan. However, they do not have to have been implemented yet.” This study focuses on 3 objectives: (1) implementing a Complete Streets policy; (2) developing regulations that promote street connectivity; and (3) encouraging mixed-use development that combines residential land use with 1 or more commercial, institutional, or other public land use. Responses of “don’t know” ranged from 183 (encourage mixed-use development 9%) to 300 (implement Complete Streets policy 15%) and were included with “no” responses.
A 5-level combination variable was created to capture plan presence and number of objectives included within plans. Municipalities with “no plan” were those that reported they did not have any of the 4 types of plans (comprehensive, land use, transportation, and bicycle/pedestrian). Municipalities with “plan + no objective” were those that were reported to have at least one of the plans, but none of the 3 objectives (implementing a Complete Streets policy, developing regulations that promote street connectivity, or encouraging mixed-use development). Municipalities with a “plan + 1 objective” were reported to have at least one plan present and only one objective present, those with a “plan + 2 objectives” were reported to have 2 objectives present, and those with a “plan + 3 objectives” were reported to have all the 3 objectives present.
Design standards and policy requirements’ questions
Questions about municipality design standards and feature requirements were asked in the next section, “The Built Environment and Policies That Support Physical Activity.” This section begins with the statement: “The next questions ask about policies or standards that support the physical activity of your community’s residents, even if the policy or standard was passed by another level of government (such as a regional transportation planning authority). You may find it helpful to consult with a representative in either the parks and recreation department or transportation department if you cannot answer a question.”
Respondents were asked, “Does your local government have design standards, guidelines, or policies that require (a) installation of dedicated bicycle infrastructure for roadway expansion projects or when retrofitting streets, (b) developer dedicated right-of-way to local jurisdictions for development of bicycle infrastructure, (c) traffic-calming features that increase roadway safety in areas with high pedestrian and bicycle volume.” Respondents were also asked “Does your local government include any of the following features in policies for development, including zoning codes and design/development guidelines: (a) require short/medium pedestrian scale block sizes, (b) require continuous sidewalk coverage, (c) require minimum sidewalk widths of 5 feet, (d) require that buildings relate to the street at a pedestrian scale (eg, require entrances that face the street, windows, or other architectural features that face the street, or reduced front setbacks), (e) require pedestrian amenities such as trees or furniture along the street, and (f) require parking standards that encourage walking and bicycling (eg, parking maximums or rear and side parking requirements).” Responses of “don’t know” ranged from 106 (traffic-calming features 5%) to 430 (require short/medium pedestrian scale block sizes 21%) and were included with “no” responses. Response choices for all questions were yes, no, and don’t know. These questions were selected based on recommendations for improving physical activity through community design and findings from the literature. 1,19,20
Analysis
The prevalence of having design standards present and feature requirements in policies for development and associated 95% confidence interval (CI) were estimated overall and by the presence of plans and objectives (no plan, plan + no objective, plan + 1 objective, plan + 2 objectives, and plan + 3 objectives). Orthogonal polynomial contrasts and pairwise t tests were used to identify the significant differences by characteristics and whether having design standards increased with plan presence and number of objectives.
Odds ratios examining the presence of each design standard and each feature requirement in policies for development were estimated by the 5-level plan and the number of objective variable (referent: plan + no objective) using logistic regression models adjusted for municipality characteristics (including population size, rural/urban status, census region, median education level, poverty level, and race/ethnicity). All estimates included associated 95% CIs. Linear and quadratic effects were examined using orthogonal polynomial contrasts of these trends. For all analysis, responses of “don’t know” to questions about the presence of a plan, objective, design standard, and feature requirement were categorized with the “no” responses. To address the concern that this decision influenced our findings, logistic regression models were run again after excluding municipalities with relevant “don’t know” response. Analyses were conducted using SUDAAN, Release 11.0 (Research Triangle Institute, Research Triangle Park, North Carolina) to account for survey design and weights.
Results
Prevalence of Design Standards and Feature Requirements
The most prevalent design standard in these communities was to have traffic-calming features that increase roadway safety in areas with high pedestrian and bicycle volume (49.5%), followed by the installation of dedicated bicycle infrastructure for roadway expansion project or when retrofitting streets (27.3%) and then developer dedicated right-of-way to local jurisdictions for development of bicycle infrastructure (18.7%; Table 1). The most commonly included feature requirement for development was minimum sidewalk widths of 5 feet (44.0%), followed by continuous sidewalk coverage (40.2%), buildings to relate to the street (38.6%), pedestrian amenities (33.7%), parking standards encouraging walking/biking (27.8%), and short/medium pedestrian-scale block sizes (14.2%).
Distribution of Municipality Characteristics and Presence of Design Standards and Feature Requirements, 2014 National Survey of Community-Based Policy and Environmental Supports for Healthy Eating and Active Living (CBS HEAL).a
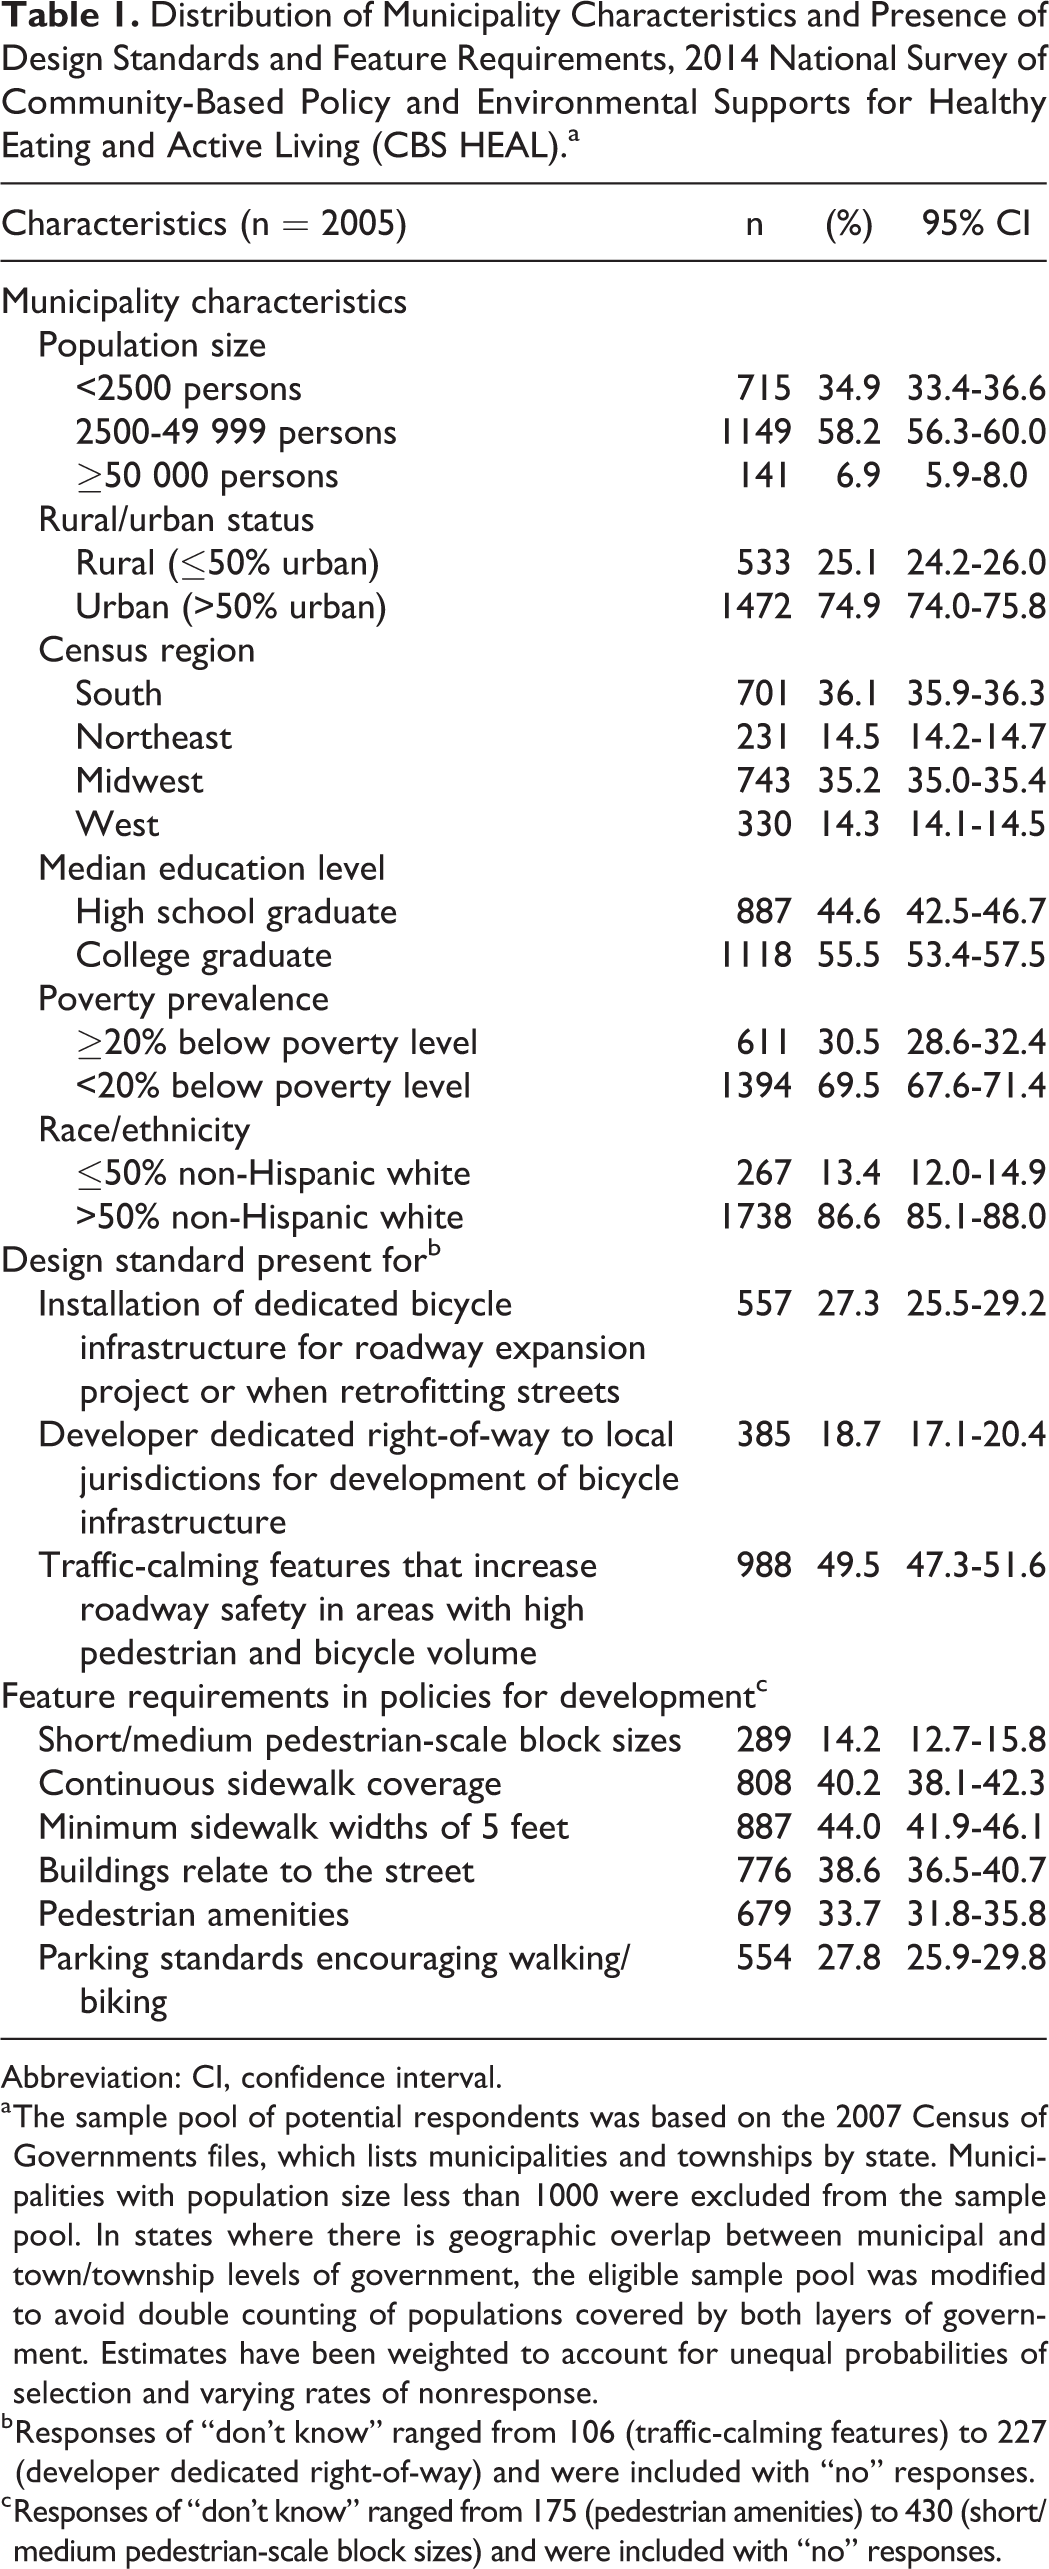
Abbreviation: CI, confidence interval.
a The sample pool of potential respondents was based on the 2007 Census of Governments files, which lists municipalities and townships by state. Municipalities with population size less than 1000 were excluded from the sample pool. In states where there is geographic overlap between municipal and town/township levels of government, the eligible sample pool was modified to avoid double counting of populations covered by both layers of government. Estimates have been weighted to account for unequal probabilities of selection and varying rates of nonresponse.
b Responses of “don’t know” ranged from 106 (traffic-calming features) to 227 (developer dedicated right-of-way) and were included with “no” responses.
c Responses of “don’t know” ranged from 175 (pedestrian amenities) to 430 (short/medium pedestrian-scale block sizes) and were included with “no” responses.
Prevalence of Design Standards and Feature Requirements by Plan Presence and Objectives
A positive trend in having a plan and the number of objectives contained in the plan with the presence of each design standard was observed (Table 2). The prevalence of design standard increased with the presence of a plan and as the number of objectives increased (P value for trend <.05). Prevalence increased from 6% to 35% for municipalities with a plan and no objectives to 42% to 60% for municipalities with a plan and 3 objectives. When municipal characteristics were controlled for, similar patterns in the presence of design standards existed by plan and objective status (Table 3). Compared to those with a plan and no objective, the odds of having a design standard was significantly lower for those with no plan (with the exception of traffic-calming features). The adjusted odds of all design standards being present increased from no plan to with a plan and as the number of objectives increased (P value for trend <.05). Trends remained significant after excluding municipalities with “don’t know” responses for plans, objectives, or design standards.
Prevalence of Design Standards and Feature Requirements by Plan Presence and Number of Objectives Included in Plans, CBS HEAL.a
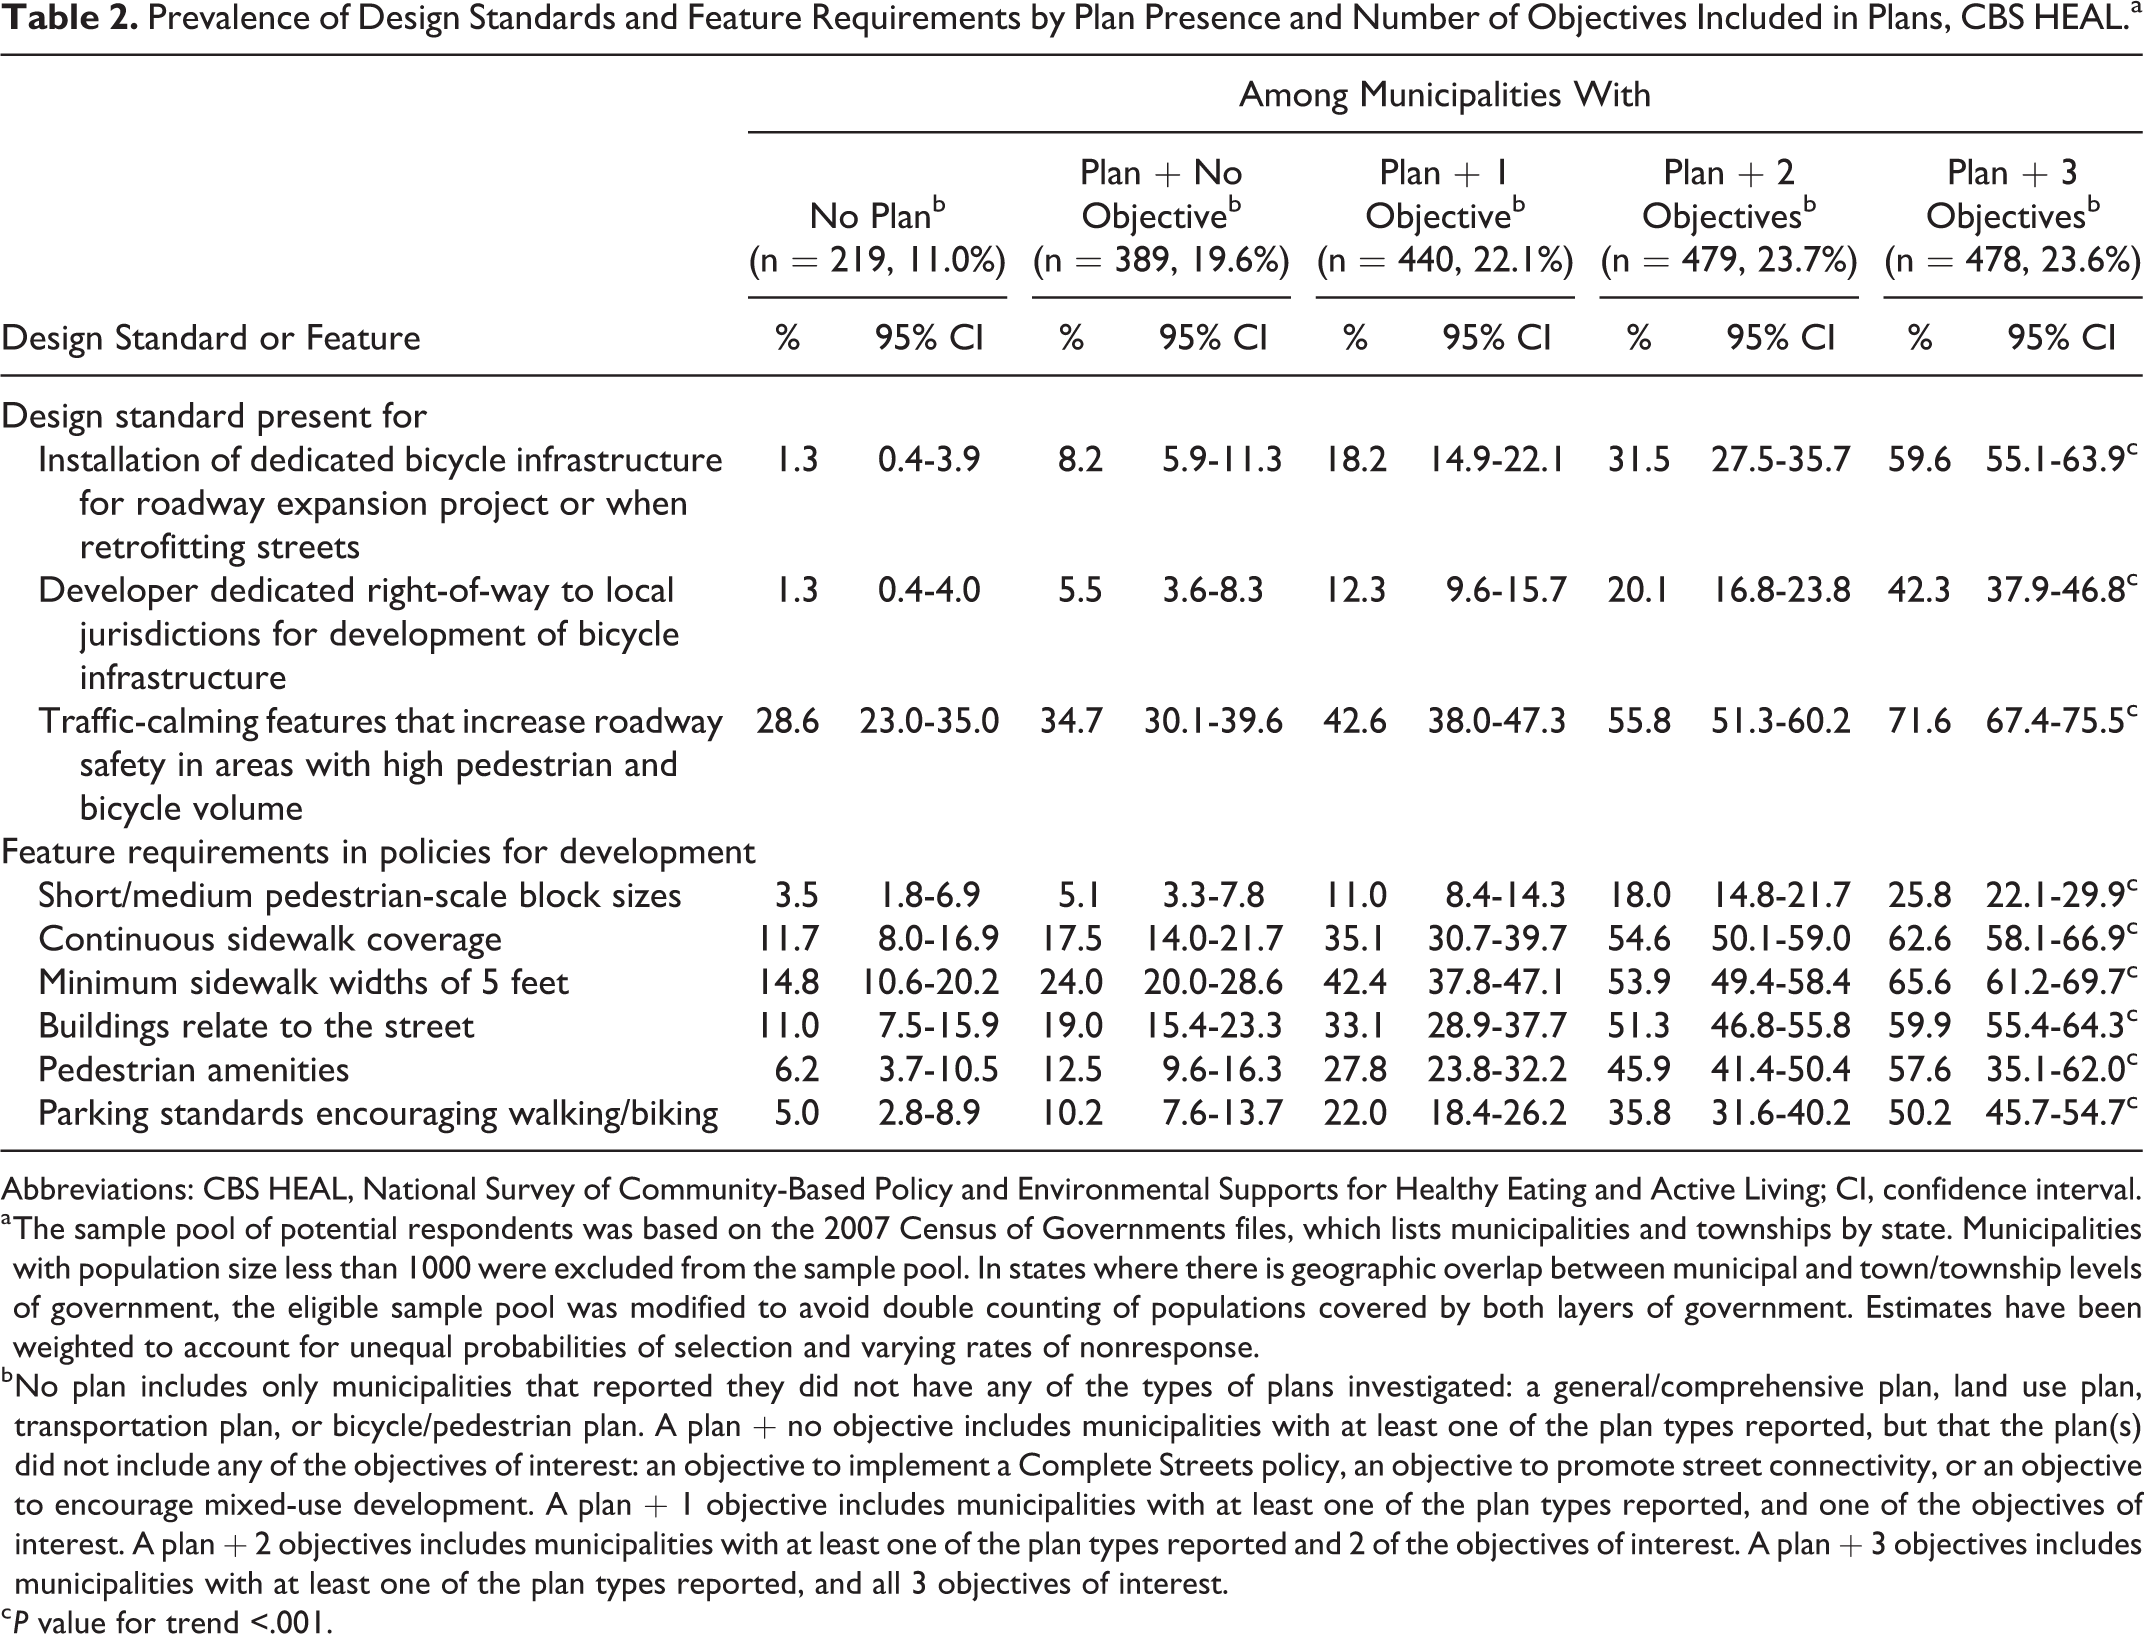
Abbreviations: CBS HEAL, National Survey of Community-Based Policy and Environmental Supports for Healthy Eating and Active Living; CI, confidence interval.
a The sample pool of potential respondents was based on the 2007 Census of Governments files, which lists municipalities and townships by state. Municipalities with population size less than 1000 were excluded from the sample pool. In states where there is geographic overlap between municipal and town/township levels of government, the eligible sample pool was modified to avoid double counting of populations covered by both layers of government. Estimates have been weighted to account for unequal probabilities of selection and varying rates of nonresponse.
b No plan includes only municipalities that reported they did not have any of the types of plans investigated: a general/comprehensive plan, land use plan, transportation plan, or bicycle/pedestrian plan. A plan + no objective includes municipalities with at least one of the plan types reported, but that the plan(s) did not include any of the objectives of interest: an objective to implement a Complete Streets policy, an objective to promote street connectivity, or an objective to encourage mixed-use development. A plan + 1 objective includes municipalities with at least one of the plan types reported, and one of the objectives of interest. A plan + 2 objectives includes municipalities with at least one of the plan types reported and 2 of the objectives of interest. A plan + 3 objectives includes municipalities with at least one of the plan types reported, and all 3 objectives of interest.
c P value for trend <.001.
Adjusted Odds Ratioa (AOR) of Design Standards and Requirements by Plan Presence and Number of Objectives Included in Plans, CBS HEAL.b
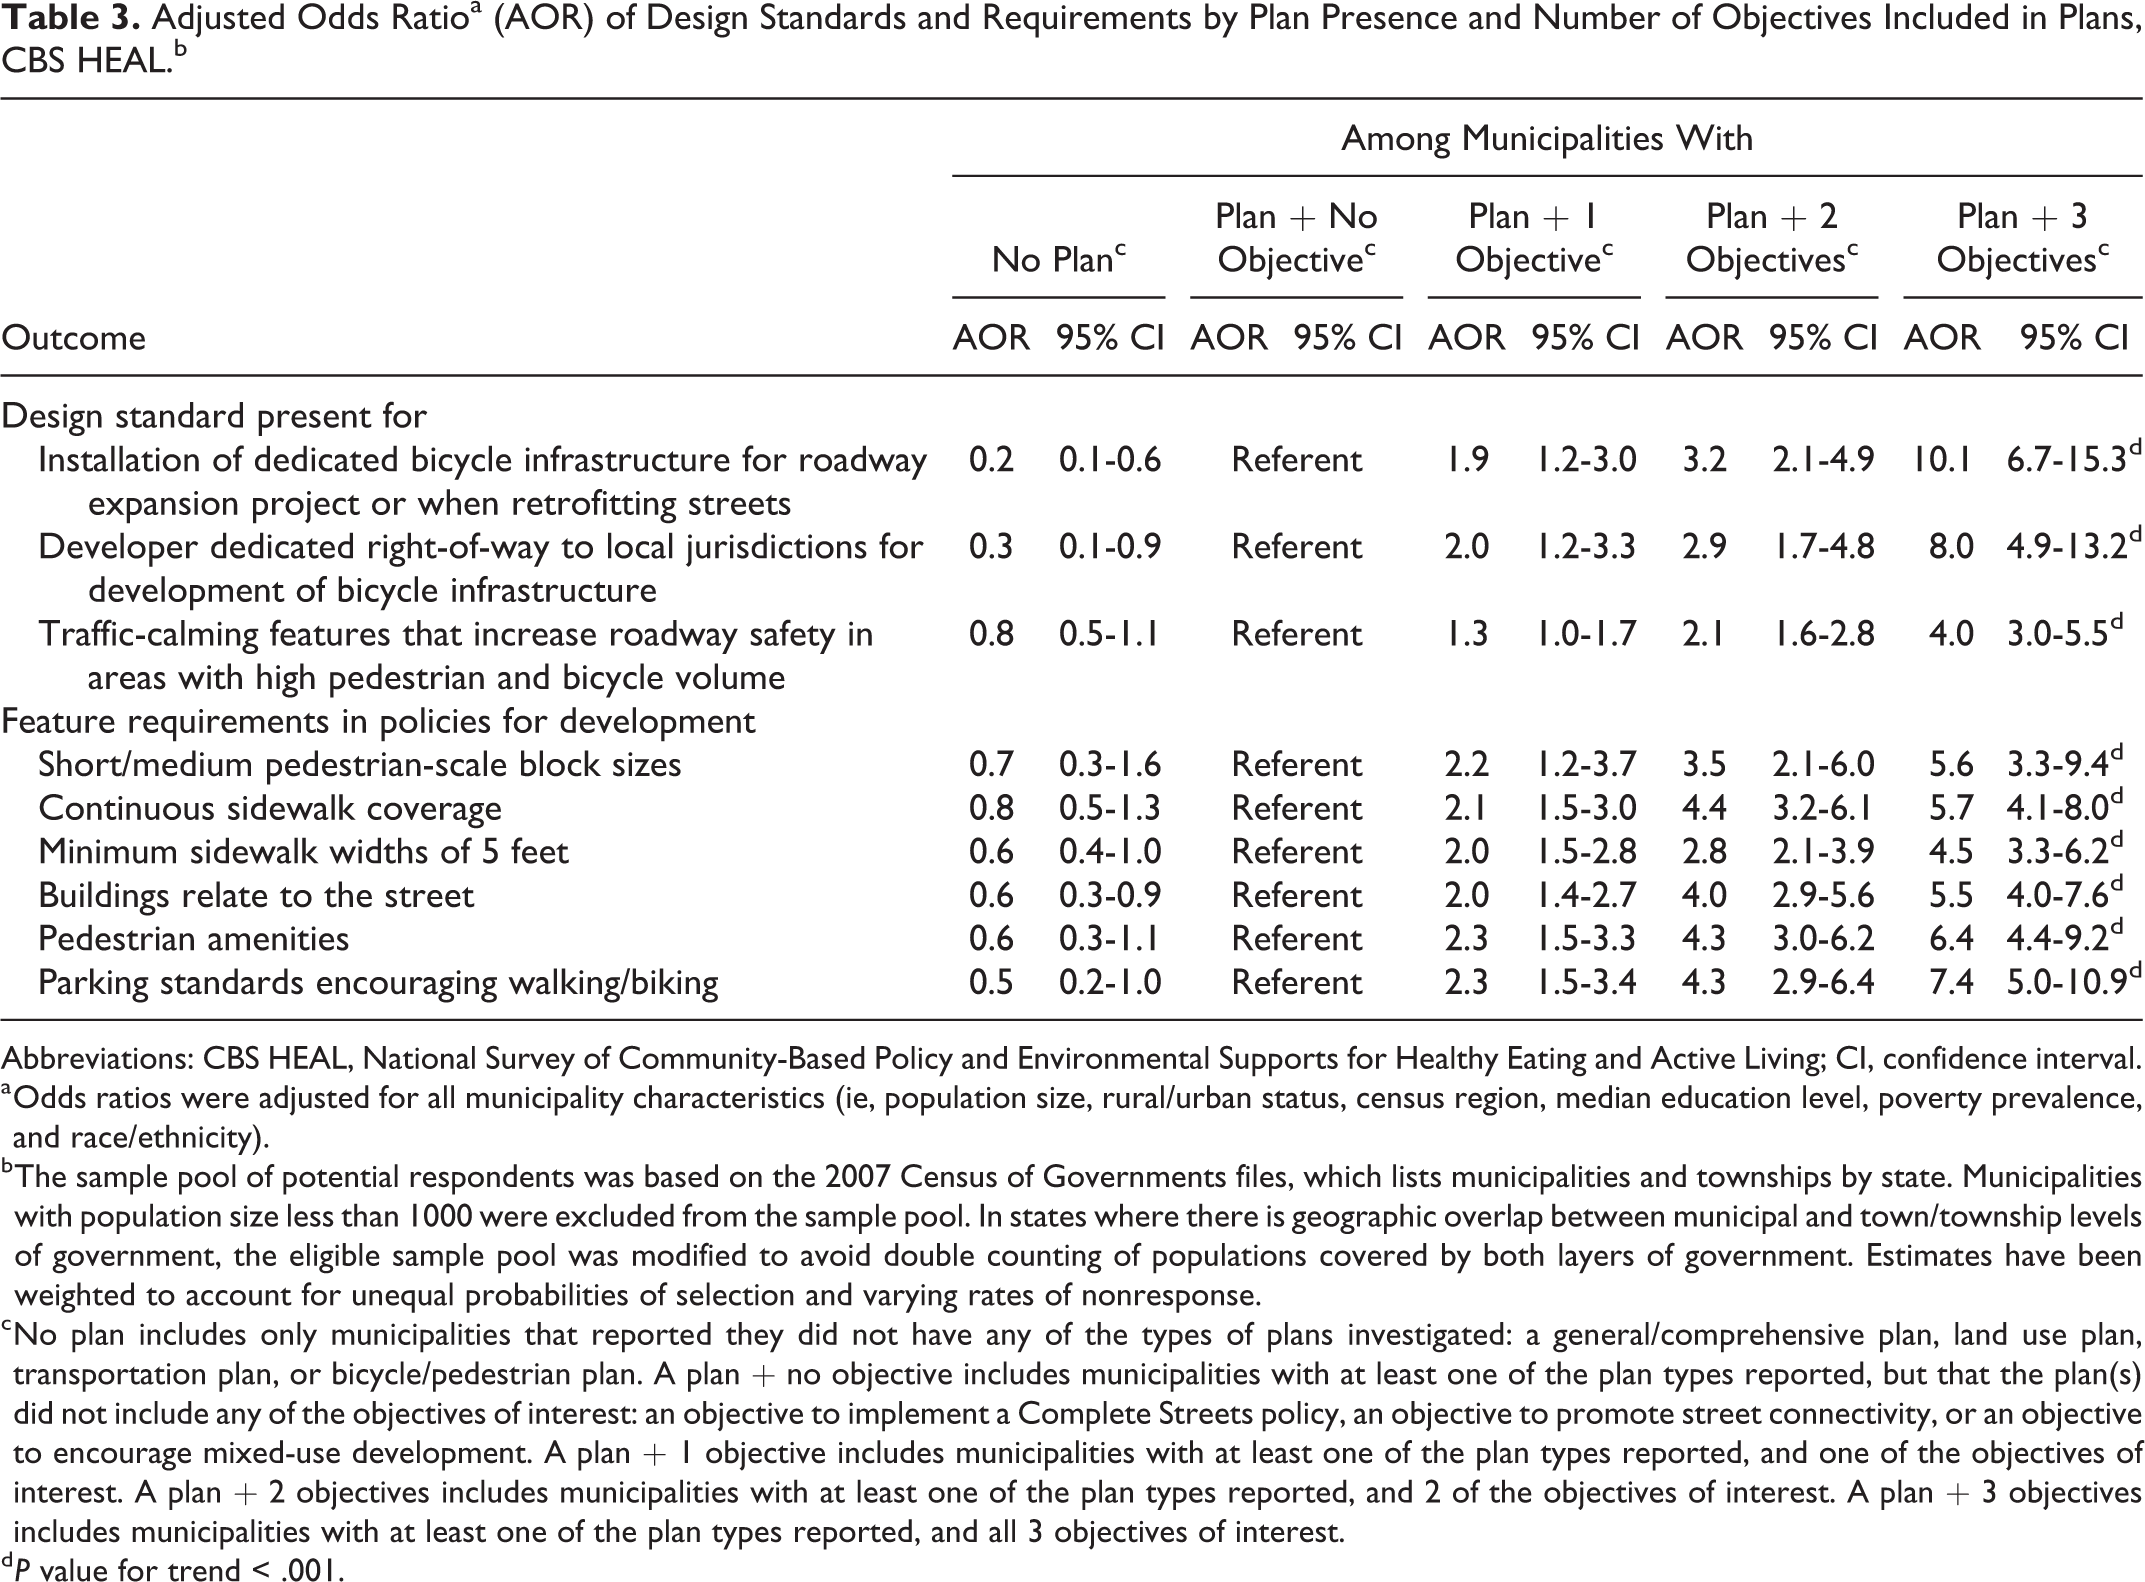
Abbreviations: CBS HEAL, National Survey of Community-Based Policy and Environmental Supports for Healthy Eating and Active Living; CI, confidence interval.
a Odds ratios were adjusted for all municipality characteristics (ie, population size, rural/urban status, census region, median education level, poverty prevalence, and race/ethnicity).
b The sample pool of potential respondents was based on the 2007 Census of Governments files, which lists municipalities and townships by state. Municipalities with population size less than 1000 were excluded from the sample pool. In states where there is geographic overlap between municipal and town/township levels of government, the eligible sample pool was modified to avoid double counting of populations covered by both layers of government. Estimates have been weighted to account for unequal probabilities of selection and varying rates of nonresponse.
c No plan includes only municipalities that reported they did not have any of the types of plans investigated: a general/comprehensive plan, land use plan, transportation plan, or bicycle/pedestrian plan. A plan + no objective includes municipalities with at least one of the plan types reported, but that the plan(s) did not include any of the objectives of interest: an objective to implement a Complete Streets policy, an objective to promote street connectivity, or an objective to encourage mixed-use development. A plan + 1 objective includes municipalities with at least one of the plan types reported, and one of the objectives of interest. A plan + 2 objectives includes municipalities with at least one of the plan types reported, and 2 of the objectives of interest. A plan + 3 objectives includes municipalities with at least one of the plan types reported, and all 3 objectives of interest.
d P value for trend < .001.
Similarly, a positive trend in the number of objectives and the presence of each feature requirement was also observed (Table 2). The prevalence of each feature requirement increased from no plan to with a plan and as the number of objectives increased (P value for trend <.05). Prevalence increased from 5% to 24% for municipalities with a plan and no objectives to 26% to 66% for municipalities with a plan and 3 objectives. When municipal characteristics were controlled for, the odds of having a requirement was significantly lower for those with no plan compared to those with a plan and no objective only for the requirement that buildings relate to the street (Table 3). The adjusted odds for the presence of each feature’s requirement increased from no plan to with a plan and as the number of objectives increased (P value for trend <.05). Trends remained significant after excluding municipalities with “don’t know” responses for plans, objectives, or feature requirements.
Discussion
Our findings show that each design standard and feature requirement in policies for development is present in about half or fewer of US municipalities. Design standards supportive of active living range from 18.7% (developer dedicated right-of-way to local jurisdictions for development of bicycle infrastructure) to 49.5% (traffic-calming features that increase roadway safety in areas with high pedestrian and bicycle volume) in US municipalities. Feature requirements in policies for development range from 14.2% (short/medium pedestrian-scale block sizes) to 44.0% (minimum sidewalk widths of 5 feet). As the number of objectives included in plans increased, a significant and positive trend was found for the presence of each design standard and feature requirement.
Practitioners can use design standards to help promote activity-friendly communities. The importance of including activity-friendly design in communities is underscored by its recommendation as a strategy to increase physical activity. 2,3 The Community Preventive Task Force’s recently released recommendation to combine activity-friendly routes with local destinations in order to improve physical activity highlights the importance of including features supportive of physical activity in communities. 3 In addition, activity-friendly design can offer additional benefits by making communities safer, supporting social cohesion, reducing air pollution, and benefiting local economies. 6 Planning documents provide one vehicle by which activity supportive design may be targeted. Our results provide additional support for planning as a tool for emphasizing community design, which has already been cited as a “promising strategy” for improving active living. 21 These benefits can help communities garner support for including activity-friendly objectives in planning documents and for implementation of supportive design standards and feature requirements in policies for development.
These findings suggest municipality planning documents may provide an opportunity for improving design standards and feature requirements supportive of active living, although the association between objectives and design standards is causal and cannot be demonstrated in this cross-sectional analysis. Although our study cannot provide causal evidence, planning documents are often implemented through design standards and feature requirements in local policies. 22 Another reason for the association could be that a third factor, for example, political values, increases both objectives in planning documents as well as design standards and feature requirements. After implementing design standards and feature requirements, planners may add activity supportive objectives to explain why a standard was set.
Additional work is warranted to better understand the process by which community planning documents, design standards, and feature requirements in policies for development work to create activity-friendly communities. Our findings show that communities with activity supportive design emphasized in community planning documents have a higher presence of supportive design standards and feature requirements. However, additional research can help to determine the nature of the association between community planning documents and design standards and feature requirements in policies for development, and the vehicle by which they improve physical activity levels in communities. Future studies could take advantage of natural experiments and investigate what changes occur in design standards and feature requirements when objectives are placed in planning documents. An additional strategy would be to use a case–control design to compare communities with and without activity-friendly design to determine the differences in their planning documents, after controlling for covariates. Another potential topic for investigation is to identify which components in planning documents, and in what combination, achieve the greatest impact. Better understanding of the effects planning documents have on communities can help to improve future efforts in making communities supportive of active living for all users.
This study has numerous strengths. This is the first study to examine plans, design standards, and feature requirements using a national sample. This is a novel investigation of planning documents and the relationship of plans with design standards and feature requirements in policies for community development. As there are few data available on this topic, this information provides researchers and practitioners with a better understanding of what activity-friendly planning documents, design standards, and feature requirements are present in the municipalities. In addition, our results add to the body of evidence supporting the role of planning documents in activity-friendly community design.
Although this study has several strengths, there are limitations. We did not validate the questions we asked of local officials against official records, which could have resulted in reporting errors. Other studies have found that local officials may not be completely reliable in their knowledge of which plans exist in their communities. 23,24 For example, in a study investigating awareness of Complete Streets policies, agreement between local officials’ reports and a presence in the National Complete Streets Coalition database was 73%, although this varied by municipal characteristics. 24 Also, the percentage of local officials who responded “don’t know” when queried about planning documents, design standards, and feature requirements in their municipality ranged from 4% for whether had a land use plan up to 21% for short/medium pedestrian-scale block sizes. This may have biased our estimates of association in US municipalities; however, our estimates of associations were similar if municipalities with a “don’t know” response were removed from the analysis. In addition, we excluded municipalities that did not report whether they had a plan from the analysis. Because it is likely that these municipalities did not have a plan, this would result in an overestimation of the prevalence of planning documents. Furthermore, because our estimates are from national samples with a response rate of 45%, our study may be subject to nonresponse bias. Nonrespondents were not significantly different from respondents in either population size or urban rural status, although municipalities in the West had a higher response rate than those in the Northeast. Our weighting procedure was intended to minimize this bias; however, nonresponse bias may remain an issue. There may also be additional objectives with an impact on active living that were not included in our survey. Finally, our findings can only be generalizable to incorporated municipalities with population greater than 1000.
So What?
What is Already Known on this Topic?
Design features in communities supportive of active living have been associated with greater physical activity levels.
What does this Article Add?
Little is known about the relationship between planning documents with design standards and feature requirements in policies for development. Our findings show that the inclusion of a greater number of physical activity supportive objectives in community planning documents is associated with a higher prevalence of design standards and feature requirements supportive of activity-friendly design.
What are the Implications for Health Promotion Practice or Research?
Design standards and feature requirements may provide an opportunity for practitioners to improve active living within their community. Practitioners may wish to consider opportunities to create or enhance planning documents and design standards and feature requirements to improve physical activity supportive environments. Additional research can help to determine the nature of the association between supportive community planning documents and design standards and feature requirements in policies for development and how they may best support active living.
Footnotes
Authors’ Note
The findings and conclusions in this report are those of the authors and do not necessarily represent the official position of the Centers for Disease Control and Prevention.
Declaration of Conflicting Interests
The author(s) declared no potential conflicts of interest with respect to the research, authorship, and/or publication of this article.
Funding
The author(s) received no financial support for the research, authorship, and/or publication of this article.