



Abstract
Purpose:
To describe the implementation of Make Your Move Experience (MYME) between 2015 and 2017.
Design:
Cross-sectional.
Setting:
Make Your Move Experience is a culturally sensitive worksite wellness program in South Texas designed to encourage sedentary workers to engage in physical activity.
Participants:
In total, 681 individuals from 19 different organizations.
Intervention:
UTHealth School of Public Health in Brownsville staff recruited individuals within local organizations to join MYME. At the end of the 3 months, organizations in which employees met MYME goals earned an incentive—bike rack or hydration station—selected to be permanent features of the local environment and facilitate physical activity.
Measures:
Participant self-reported gender, physical activity level prior to joining MYME (beginner or experienced), and weekly miles of biking, walking, or running completed.
Analysis:
Mean number of miles biked, walked, and ran each month were compared between (1) beginners and experienced, (2) men and women, and (3) in fall 2016 and spring 2017 using t tests.
Results:
Beginners initiated physical activity by walking. Men biked more miles than women did (P < .05 all 3 years). Bike riders cycled fewer miles (20.2 miles vs 44.9 miles; P = .03) and walkers covered fewer miles (195.4 miles vs 266.7 miles; P = .04) in fall 2016 compared to spring 2017.
Conclusions:
Participation in MYME, a culturally appropriate intervention delivered at the worksite, facilitated an increase in physical activity levels among sedentary individuals.
Purpose
Engaging in regular physical activity has numerous health and economic benefits. 1 -4 The US Department of Health and Human Services recommends that adults engage in at least 150 minutes of moderate-intensity or 75 minutes of vigorous-intensity aerobic physical activity, along with muscle-strengthening activities on 2 days or more each week, to support substantial health benefits. 5 However, national data report that fewer than half of the adult US population meet these physical activity recommendations. Hispanics represent approximately 18% of the US population 6 and are the largest and fastest growing minority group in the nation; yet, more Hispanics than non-Hispanic whites or blacks do not meet these guidelines. 7
Guidelines note that some activity is better than no activity; adults who sit less and do any amount of moderate-to-vigorous physical activity gain some health benefits. 5 Given the length of time spent at work daily, worksites are ideal locations to meet these additional minutes of activity. However, most current worksite wellness programs focus on the individual, 8 which may not be culturally appropriate or even relevant for all groups in the United States, and the role of incentives in motivating behavior remains poorly understood. 9
Brownsville, Texas, located at the tip of South Texas on the border with Mexico, remains one of the poorest cities in the nation, with over one-third of the population younger than 18 years living under the poverty level. 10 The population is overwhelmingly Hispanic of Mexican heritage. 11 Obesity and diabetes rates are higher in this area compared to any other part of the state, while rates of physical activity are low, 12 and the increased prevalence of type 2 diabetes in the Hispanic population 12 has brought the need to promote healthy lifestyles, including physical activity to the forefront.
Creating healthier lifestyles in South Texas is a collaborative effort between several public and private organizations that takes a systematic evidence-based and community-wide approach using culturally and linguistically vetted approaches, media messages, and materials designed to tackle this problem. 13,14 Key partners in the implementation of the community-wide campaign, referred to as Tu Salud ¡Si Cuenta! (Your Health Matters!), include the UTHealth School of Public Health in Brownsville (UT SPH), the City of Brownsville, and Brownsville Independent School District. 14,15 Among other programs such as The Challenge and CycloBia, 16 the initiative supports a worksite wellness program called Make Your Move Experience (MYME), designed to introduce physical activity into the lives of sedentary residents of South Texas and make long-term, sustainable, system-level changes.
Make Your Move Experience was designed to complement existing Tu Salud ¡Si Cuenta! intervention activities and to capitalize on the unique sociocultural context of South Texas. To date, group activity interventions such as CycloBia 16 have been successful in the South Texas area. Thus, MYME, developed to resonate with local residents and ensure social support for physical activity, took a group-based approach to motivate physical activity at a variety of places of work by providing shared incentives to the organization, based on group rather than individual participation. As with The Challenge and CycloBia, 16 MYME intervention was presented to the Community Advisory Board, a collective impact group of over 80 stakeholders in the region, 14 where the intervention approach and materials were discussed and reviewed to ensure they were culturally appropriate.
Here, our overall goals are to (1) describe the implementation of MYME, a worksite wellness program in South Texas designed to be culturally sensitive and encourage sedentary workers to engage in physical activity, and (2) describe enrollment and participation in the program between 2015 and 2017.
Methods
Intervention Design
Make Your Move Experience is a workplace wellness program designed to encourage employees to engage in physical activity over an 8- to 12-week period, logging activity individually with the goal of meeting group metrics to win an incentive for their organization. The program is open to all employees, and the organization is encouraged to target employees who have (self-reportedly) not been physically active in the past to complete physical activity challenges during the designated time. Although individuals are tracked during the program, the prize is dependent on the group achieving milestones to win a prize. In this way, the individual’s progress is tracked, but there is pressure and support from the larger group to be physically active. The MYME study staff work with the recruited organization to identify a champion who is responsible for recruiting and motivating participants to stay with the program, as well as organizing and providing each participant’s physical activity data to the UT SPH staff evaluation team.
The intervention was built using constructs from Social Cognitive Theory, 17 particularly the foundational idea of reciprocal determinism or the idea that behavior (physical activity) is shaped by individual’s confidence (self-efficacy that can be increased through observational learning and practice toward mastery) and the environment (such as a work environment that can promote the desired behavior). The intervention also incorporates incentives for each organization that achieved a set percentage of employees who reported physical activity over the 8 to 12 weeks, rather than individual total miles covered. The incentives themselves, bike racks and hydration stations, were selected to compliment Tu Salud ¡Si Cuenta! intervention activities and to become permanent features of the local environment and facilitate physical activity. From a Social Cognitive Theory perspective, the group goal approach built on the constructs of rewards, collective efficacy, and observational learning.
Moreover, having a “champion” in the workplace setting for the program who was experienced with physical activity provided the participants someone who could guide their mastery learning and provide additional rewards (recognition and support). Benchmark goals are set for each type of activity on a monthly basis that participants are encouraged to meet: at least 26.2 miles for running, 13.1 miles for walking, and 50 miles for cycling. These goals were set with the understanding that for “beginners” (ie, those for whom MYME was designed), these goals may be quite difficult to achieve, yet for individuals already meeting PA guidelines they were likely inadequate. Thus, the goals were set for sedentary individuals, with the goal of moving their activity level closer to achieving guidelines. Incentives were provided to organizations in which 75% of the individuals who started MYME reported engaging in some physical activity throughout the program months. Make Your Move Experience has full approval from UT SPH’s institutional review board.
Sample
Make Your Move Experience was launched in a pilot in 2015. Given the program was new, program staff from UT SPH in Brownsville identified organizations that do not currently have a worksite wellness program, and individuals within the organization who would be willing to serve as the team captain and as a contact between UT SPH and the organization. The team captain was critical to program implementation and was referred to as “the champion.” The UT SPH staff targeted local organizations and schools where they already knew individuals who would serve in the champion role to ask about their interest in MYME. A total of 12 individuals were approached, which resulted in 10 organizations enrolling and completing the program in 2015.
In 2016 and 2017, the staff promoted the program using flyers, e-mails, word-of-mouth, and phone calls for 2 months prior to launching MYME. In order to join MYME, an interested individual submitted an online application on behalf of his or her organization via Survey Monkey. The application is short, simple, and free and can be accessed at https://www.surveymonkey.com/r/WDH2D6Z. The individual was contacted, and a formal presentation was set up at the organization to explain the program. Once an organization had agreed to participate, an individual from the organization was identified as the champion. In 2016, MYME was offered in the fall; 22 organizations completed the online application form, 10 received a formal presentation, and 9 completed the 3-month MYME. In order to determine whether and how participation might vary across different seasons, MYME was offered in the spring of 2017. A total of 12 organizations completed the online application for spring 2017, and 10 received a formal presentation. Six organizations completed all 3 months of MYME, while 3 organizations submitted tracking spreadsheets for February only.
To participate in MYME, a minimum of 5 employees were required to commit to the 2- to 3-month program. Participants, that is individual employees, logged their physical activity daily and provided weekly totals to the champion. The preferred method to track activity was using the Activity Diary Moves App (see Figure 1;
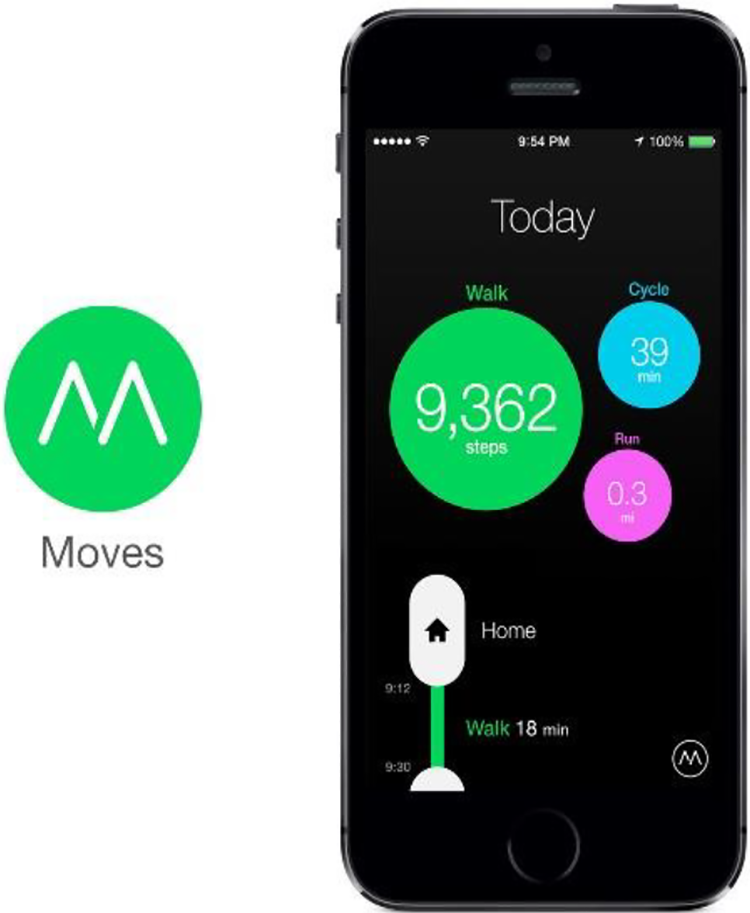
Moves activity diary app for iphone and Android.
At the start of the intervention, the champion and participants received a resource list, with activities such as event announcements and dates, and maps of local parks. Although MYME itself was promoted in both Spanish and English, 19 participant materials were provided in English, reflecting the language preference of the employees who joined MYME. Throughout the program, the champion and participating employees received individualized motivational support via phone calls and e-mails in response to specific questions or requests. Participants at all the organizations were encouraged to send photos, which were posted to the main MYME social media pages. Miles covered commuting to work on foot or bike were included toward the MYME goals. At the end of the 3 months, participant data from each organization were aggregated and evaluated. All organizations in which employees met the MYME goals earned an incentive; delivery of the incentives was coordinated by the MYME study staff at UT SPH.
Measures
Participant data included gender (male or female), whether the individual self-identified as engaging in regular physical activity irrespective of frequency (defined as experienced) or not engaging in regular physical activity (defined as beginner) prior to starting MYME, and the weekly totals of biking, walking, or running each participant completed. The total number and mean number of miles completed biking, walking, and running each month were calculated for each organization. The total number of participants completing each type of physical activity was tracked each month and used to calculate the percent of individuals at each organization who reported engaging physical activity throughout the program. Although some individuals may have participated more than once because their place of work participated more than once, neither individual nor organizational activity levels were tracked over time.
Analysis
Paired t tests were completed to examine mean differences in miles biked, walked, and ran each month. To understand individual-level factors associated with being physically active, Student t tests were used to examine group mean differences in the miles biked, walked, and ran between (1) men and women, (2) beginners and experienced, and (3) miles completed in fall 2016 and miles completed in spring 2017.
Results
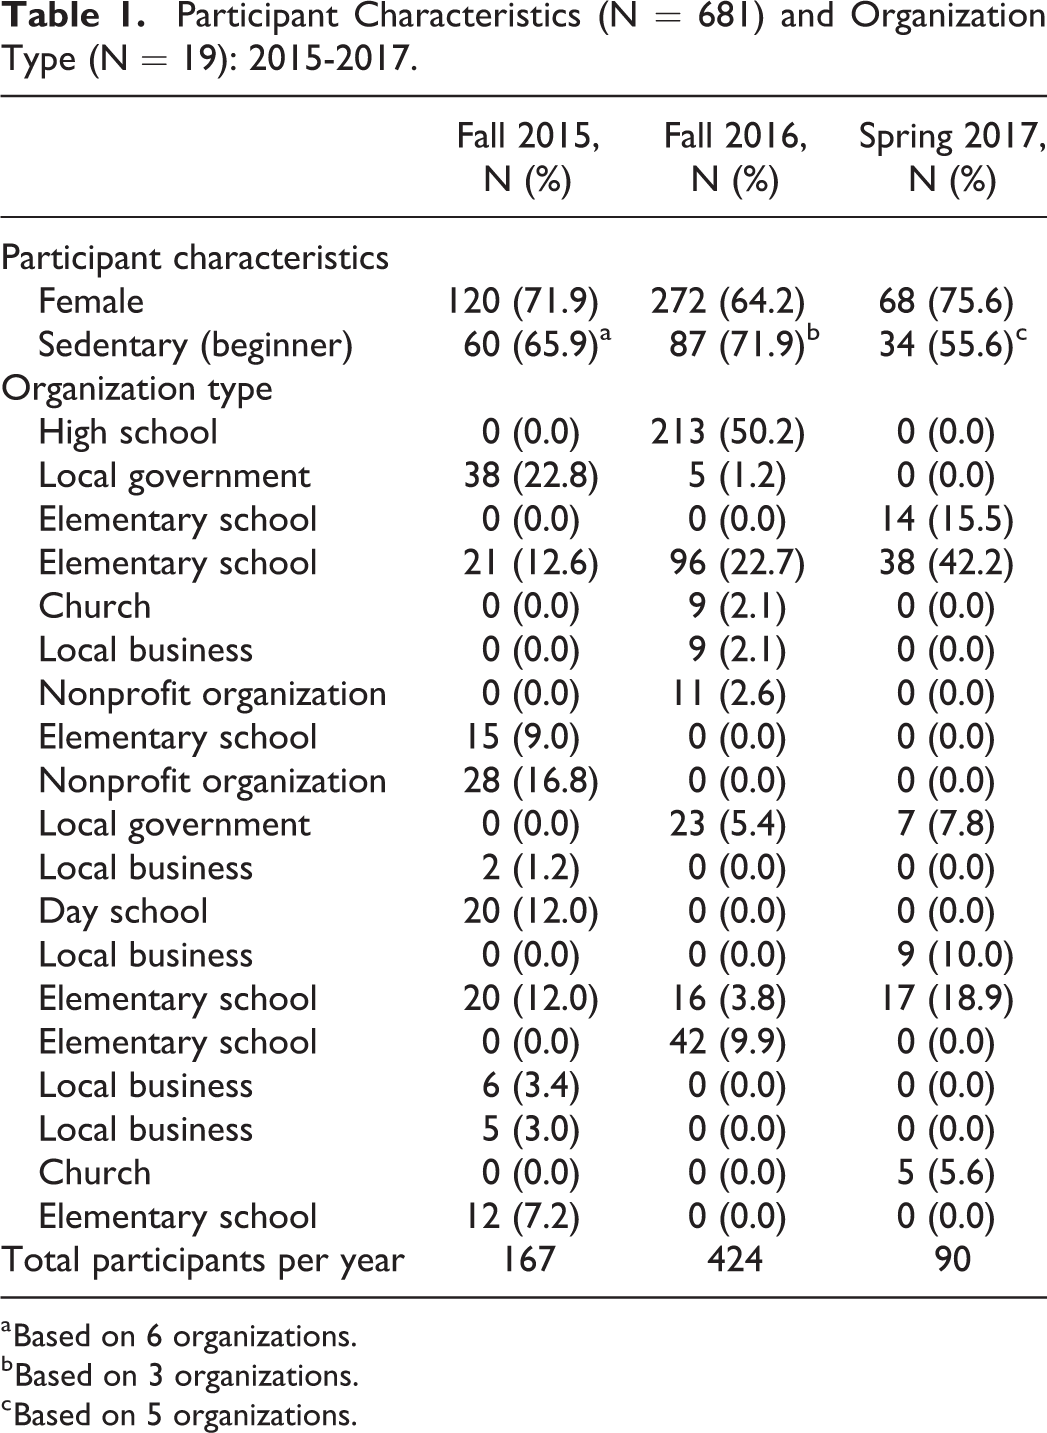
Between 2015 and 2017, 19 different organizations participated in MYME (Table 1). A diverse range of organizations enrolled, including public and private schools, a church, an insurance agency, a law firm, a barbershop, local nonprofits, and government agencies. During the implementation in 2015, MYME was conducted for 8 weeks in October and November. The number of individuals who enrolled in MYME per organization in 2015 varied between 2 and 43 and the number who completed varied between 2 and 38. Of the 167 individuals, 120 (72%) were women. In 2016, completion levels also varied by organizations, from the minimum number required (which was set at 5 individuals after the 2015 implementation) to over 200 individuals. Of the 424 participants, 272 (64%) were women. In 2017, the program was held in the spring, from February through April. Of the 90 participants, 68 (75.6%) were women.
Participant Characteristics (N = 681) and Organization Type (N = 19): 2015-2017.
a Based on 6 organizations.
b Based on 3 organizations.
c Based on 5 organizations.
The completion of MYME was assessed at the organizational level. While some individuals did not complete the monthly goals, at the organizational level, 75% of individuals who started the program reported being physically active throughout the program. As a result, all organizations earned the incentives each year. Of note, the average number of miles walked by individuals exceeded the benchmark goal set for walking at all organizations each year. In contrast, the monthly benchmark goal for running was achieved once over the 3 years, while the goal set for biking was not achieved by any of the participating organizations.
Table 2 presents summary data for the physical activity completed in fall 2015. Participants walked significantly more miles in October than November (P = .03). Although participants reported biking and running more miles in October and November, these differences were not significant. On average, males biked more miles than females in October (37 miles vs 11.5 miles, respectively; P = .06) and significantly more miles in November (30 miles vs 9 miles, respectively; P = .05), but there was no gender-based difference in the number of miles walked or ran. Over the same time period, beginners (ie, participants who self-reported as sedentary prior to joining MYME) biked (Poct = .01 and Pnov = .01) and ran (Poct = .05 and Pnov = .03) significantly fewer miles than participants with experience; however, beginners walked significantly more miles than their experienced peers (Poct = .01 and Pnov = .01).
Physical Activity in Miles Completed in October and November 2015.a

Abbreviation: SD, standard deviation.
a N = 167.
In October 2015, 12% of beginners reported biking compared to 48% of participants with experience, 100% of beginners reported walking compared to 68% with experience, and 12% of beginners reported running compared to 35% of those with experience. In November 2015, 12% of beginners reported biking compared to 48% of participants with experience, 97% of beginners reported walking compared to 58%, and 12% of beginners reported running compared to 39% of those with experience.
Table 3 presents summary data for fall 2016. On average, participants walked more miles in November than September (P = .05) and ran more miles in both October and November than September (P = .02 and P = .01, respectively). Over the 3 months, no gender-based differences were observed in the number of miles biked, walked, or ran. Over the same time period, individuals with experience reported walking more miles in September (P = .02), running more miles in all 3 months (Psept = .01, Poct = .001, and Pnov = .01), and biking more miles in October and November compared to beginners (Poct = .03 and Poct = .05).
Physical Activity in Miles Completed in September Through November 2016.a

Abbreviation: SD, standard deviation.
a N = 424.
In September 2016, 5% of beginners and 30% of participants with experience reported biking, 91% of beginners and 89% of participants with experience reported walking, and 12% of beginners and 56% of participants with experience reported running. In October 2016, 9% of beginners and 29% of participants with experience reported biking, 94% of beginners and 85% of participants with experience reported walking, and 11% of beginners and 50% of participants with experience reported running. In November 2016, 15% of beginners and 29% of participants with experience reported biking, 94% of beginners and 88% of participants with experience reported walking, and 16% of beginners and 50% of participants with experience reported running.
Table 4 presents summary data for spring 2017. On average, participants biked, walked and ran significantly more miles in February compared to March (Pbike = .02, Pwalk = .001, Prun = .001), and walked and ran significantly more miles in March than April (Pwalk = .001, Prun = .001). Men biked more miles than women in March and April (P = .04), but there was no gender-based difference in number of miles walked or ran. Experienced runners covered significantly more miles than beginners in all 3 months (P < .001 for all months), but there were no differences in number of miles walked or biked between beginners and experienced.
Physical Activity in Miles Completed in February Through April 2017.a

Abbreviation: SD, standard deviation.
a N = 90
In February 2017, 12% of beginners and 30% of participants with experience reported biking, 100% of beginners and 70% of participants with experience reported walking, and 31% of beginners and 63% of participants with experience reported running. In March 2017, 12% of beginners and 33% of participants with experience reported biking, 100% of beginners and 88% of participants with experience reported walking, and 38% of beginners and 70% of participants with experience reported running. In April 2017, 12% of beginners and 33% of participants with experience reported biking, 97% of beginners and 89% of participants with experience reported walking, and 35% of beginners and 59% of participants with experience reported running.
Finally, bike riders reported cycling fewer miles, on average, in fall 2016 compared to spring 2017 (20.2 miles vs 44.9 miles, P = .03). Walkers also reported walking fewer miles, on average, in fall 2016 compared to in spring 2017 (195.4 miles vs 266.7 miles; P = .04). In contrast, the average number of miles ran did not vary between fall 2016 and spring 2017 (69.5 vs 78.8; P > .05).
Discussion
Despite rampant public health issues, the desire to redefine South Texas as champions for positive health change is reflected in the positive outcomes of this pilot program. When designing and implementing MYME, UT SPH faculty and staff wanted to ensure that the program resonated with local Hispanic cultural values, as the goal of MYME was to serve the local majority Hispanic population in South Texas. 14,19 Accordingly, MYME was explicitly designed for a collectivist culture, to address the social determinants of health, 20 and to promote group-oriented exercise. Furthermore, by identifying a champion at each organization, MYME also sought to recognize the importance of hierarchical relationships and honor cultural norms for building rapport and relationships within the Hispanic culture. The champion served as a leader by influencing individuals within his or her organization to participate in MYME, keeping track of each individual’s activity level, and reporting the organization’s results to study staff. In this role, the champion solidified the partnership between the organization and UT SPH. Finally, offering individualized encouragement and motivation to participants throughout the program reflects the cultural values of sympathy and “personalismo.”
Results from MYME support existing research on workplace wellness programs, 8 while emphasizing the benefits of group intervention and cultural relevance to increase physical activity. The program found that previously sedentary participants (“beginners”) initiate their health change by walking, a promising lifestyle modification that can lead to sustained increases in physical activity. 21 Of note, walkers attribute the social aspects of participating in a walking group, to their sustained walking and participation in the group, 21 underscoring the benefit of group activity. Consistent with recent research, 22 no gender-based differences were observed in terms of miles walked. A recent Texas-based study examining walking trail use 22 found both men and women reported spending similar amounts of time spent on the trail and reported using trails at a similar frequency. These findings are promising, as they suggest that the new opportunities to trail walk in safe environments in the region may yield increases in physical activity for both men and women.
In contrast, men reported biking more miles than women, which may simply reflect existing gender differences in cycling behavior in the United States in general 23 and is potentially indicative of cultural norms around the cycling culture in the region as well.
The number of miles walked appear to be subject to seasonal variation; participants reported walking roughly 2 miles (or 40 minutes) a day in fall 2016 and roughly 3 miles (or 60 minutes) a day in spring 2017. It is possible that some of same individuals completed MYME in both fall 2016 and spring 2017, as 3 organizations participated at both times. As a result, we do not know if the increase is due to seasonal variation or reflects increased experience and fitness levels among repeat participants. However, and most importantly, these self-reported levels of physical activity not only meet current guidelines for the minimum required level of moderate-intensity physical activity but also exceed them. 3
As with all studies, there are some limitations with the MYME intervention. First, we did not enroll a control group and cannot account for the number of individuals who might have started to engage in physical activity over the same time periods had MYME not been available. Second, many study participants did not use the preferred study app, Moves Activity Diary, to track their activity; as a result, the reported activity estimates vary in terms of reliability and validity. However, although the Moves app is no longer available, the other apps participants used (ie, Fitbit) remain on the market, and all have good reliability and validity. 24 Third, we do not know how many of the MYME participants sustain the physical activity without the support of the champion and structure that MYME provides. Fourth, the sample is a convenience sample, which limits the generalizability of the results. Fifth, participants were classified as sedentary or physically active at the onset of the intervention based on self-report; accordingly, it is possible that some were misclassified. Sixth, there are costs associated with maintaining the incentives and, in particular, maintenance associated with the hydration stations such as new filters, which are not borne by MYME. Given that organizations and individuals can participate more than 1 time, a wider variety of incentives might serve to increase continued participation in the program. Finally, the program relies heavily on the champion to incentivize other employees and provide the employee data to UT SPH. Thus, incentivizing the champion and increasing the ease through which data are gathered and shared with UT SPH might both serve to increase repeat participation among organizations and individuals.
Moving forward, incentives based on number of participants as well as number who complete the program may help sustain motivation to participate in the program. Additionally, increased outreach may help induce friendly competition among organizations and thus encourage completion of the program. Make Your Move Experience is currently the largest worksite wellness program in the Rio Grande Valley and has potential to continue its growth into other communities, evident by existing partner interventions and their expansion. 13 -16,1 9 Participation in MYME may serve to develop worksite wellness norms that support sustained physical activity at both the individual and organizational levels and thereby support the wider community-based efforts in the region 13 -16,1 9 to create healthier lifestyles.
So What?
What is already known on this topic?
Worksite wellness programs can motivate and support healthy lifestyle changes.
What is added by this report?
Make Your Move Experience worksite wellness program focuses on previously sedentary individuals and takes a group approach to motivate behavior change.
What are the implications for health promotion practice?
Culturally appropriate interventions that support changes for the individual and environmental infrastructure are viable approaches to creating healthier lifestyles among previously sedentary individuals in South Texas.
Footnotes
Appendix 1
Activity recording and reporting (data): Please see below the template spreadsheet to help record activity. The spreadsheet is organized to record on a weekly basis, then grouped into monthly summaries.
Authors’ Note
AVW completed the analysis and led the writing, AD contributed to the writing, OD completed the methods, LD contributed to the writing, and BMR conceptualized Make Your Move Experience, contributed to the writing, and provided critical feedback throughout. Anna V. Wilkinson is also affiliated with Michael & Susan Dell Center for Healthy Living.
Acknowledgments
Many individuals contributed to the success of MYME. Mr Fred Tamez and Mr Ernie Garrido recruited the original organizations to participate in MYME, and Mr Graham Shiver supported the program in 2016. Mr Garrido also supported publicity for MYME in subsequent years. The aurhors thank Ms Christina Villarreal and the Brownsville Wellness Coalition for assistance with storing the incentives. Finally, the authors thank Ms Lisa Mitchell-Bennett for her guidance throughout.
Declaration of Conflicting Interests
The author(s) declared no potential conflicts of interest with respect to the research, authorship, and/or publication of this article.
Funding
The author(s) disclosed receipt of the following financial support for the research, authorship, and/or publication of this article: This work was funded by Methodist Healthcare Ministries (grant title: Creating a Culture of Bicycling and Walking in South Texas).
