



Abstract
Purpose:
Examine if Historically Black Colleges and Universities (HBCUs) are more likely to be located in low food access area (LFA) census tracts compared to public non-HBCUs.
Design:
ArcGIS Pro was utilized to capture food environments and census tract sociodemographic data.
Setting:
The sample included 98 HBCUs and 777 public non-HBCUs within the United States. 28.9% of study census tracts were classified as LFA tracts.
Measures:
University data were gathered from the National Center for Education Statistics. Census tract-level LFA classification was informed by the United States Department of Agriculture’s Food Access Research Atlas. Covariates included population density and neighborhood socioeconomic status of census tracts containing subject universities.
Analysis:
Multilevel logistic regression was employed to examine the relationship between university type and LFA classification.
Results:
A higher percentage of HBCUs (46.9%) than public non-HBCUs (26.6%) were located in LFAs. After adjusting for population density and neighborhood socioeconomic status, university type was significantly associated with food access classification (B=0.71;p=.0036). The odds of an HBCU being located in LFA tracts were 104% greater than for a public non-HBCU (OR=2.04;95% CI=1.26,3.29).
Conclusion:
Findings underscore the need for policy interventions tailored to HBCU students to promote food security, environmental justice, and public health.
Purpose
Few studies have examined the prevalence of equitable access to healthy food among college students attending Historically Black Colleges and Universities (HBCUs), with most restricted to one university.1-2 Low food access areas (LFAs) consist of geographic areas in which populations have limited access to food stores. 3 Research highlights the relationship between LFAs, affordability, and dietary intake. 4 The purpose of this study is the to explore the difference in prevalence of HBCUs and non-HBCUs located within singular LFAs on a national scale and discuss one HBCU’s food security program.
Methods
Design
This study examines food access for all HBCUs in the U.S. compared to public non-HBCUs based on whether the university’s census tract was designated an LFA. ArcGIS Pro was used to match each university to the food access classification and sociodemographic data for its census tract.
Sample
A comprehensive list of HBCUs (N=115) and public non-HBCUs (N=6,857) as of June 2020 were collected from the Integrated Postsecondary Education Data System (IPEDS). 5 Universities offering only distance education were excluded (N=60). To ensure comparative educational experiences, we excluded universities designated as entities other than public 2- or 4-year institutions (N=5,092). Only public non-HBCUs located in states containing at least one HBCU were included. Universities in census tracts with missing food environment or covariates information were excluded (N=15). The final sample included 875 universities (98 HBCUs and 777 public non-HBCUs) across 20 states.
Measures
HBCUs and public non-HBCUs were downloaded from IPEDS. 5 Food environment data were downloaded from the United States Department of Agriculture Economic Research Service’s Food Access Research Atlas 2017. 6 Census tracts that were both low-income and low-access at 1- and 10-miles were considered LFAs. Census tracts were identified as low-income if at least 20% of households were below the Federal poverty threshold, or the median family income was less than 80% of either the state or metropolitan area’s median household income. Census tracts were considered low-access if at least 500 people, or 33% of the population, lived more than 1 mile in urban areas or more than 10 miles in rural areas from the closest grocery store. Data were uploaded into ArcGIS Pro and merged with corresponding census tracts using geo identifiers and food access classification within census tracts.
Covariates
Using the ArcGIS Pro Living Atlas portal, 7 sociodemographic data from the US Census Bureau’s 2011-2015 American Community Survey were downloaded for all sample census tracts. Population density was calculated by dividing the total tract population by the tract area in square miles. The neighborhood socioeconomic status (NSES) index, which exists on a scale from 0 to 100 with 50 being the national average in 2010, was used to capture neighborhood disadvantage. 8 NSES takes into account median household income, percentage of households headed by a female, unemployment rate, percentage of households below the federal poverty threshold, and education levels. 8 Partial data were used to calculate NSES for census tracts if two or fewer variables were missing.
Analysis
Multilevel logistic regression was utilized to examine the relationship between HBCU classification and food access status on the census tract level. Initially, we tested whether a multilevel component (i.e., random effect) was justified to control for non-independence within census tracts using intraclass correlation coefficient. We then analyzed three models beginning with the bivariate association between HBCU status and food access classification, followed by multilevel models adjusted for population density and NSES. For each model, variance components were estimated for census tract-level random effects. All statistical tests were conducted using SAS 9.4.
Results
Table 1 presents tract-level characteristics for the HBCUs and public non-HBCUs in the study sample (n=875). Overall, 28.9% of study census tracts were classified as LFAs, average population density was 2,106.1 persons per square mile (SD=3103.5) and average NSES index was 49.2 (SD=11.5). Census tract-level characteristics differed between HBCUs and public non-HBCUs, with a higher average population density in HBCUs compared to public non-HBCUs and lower average NSES index in HBCUs compared to public non-HBCUs (see Table 1). A higher percentage of HBCUs (46.9%) compared to public universities (26.6%) were located in census tracts classified as LFAs (χ2=17.4, p<.0001).
Tract level Characteristics by University Type (N= 875).
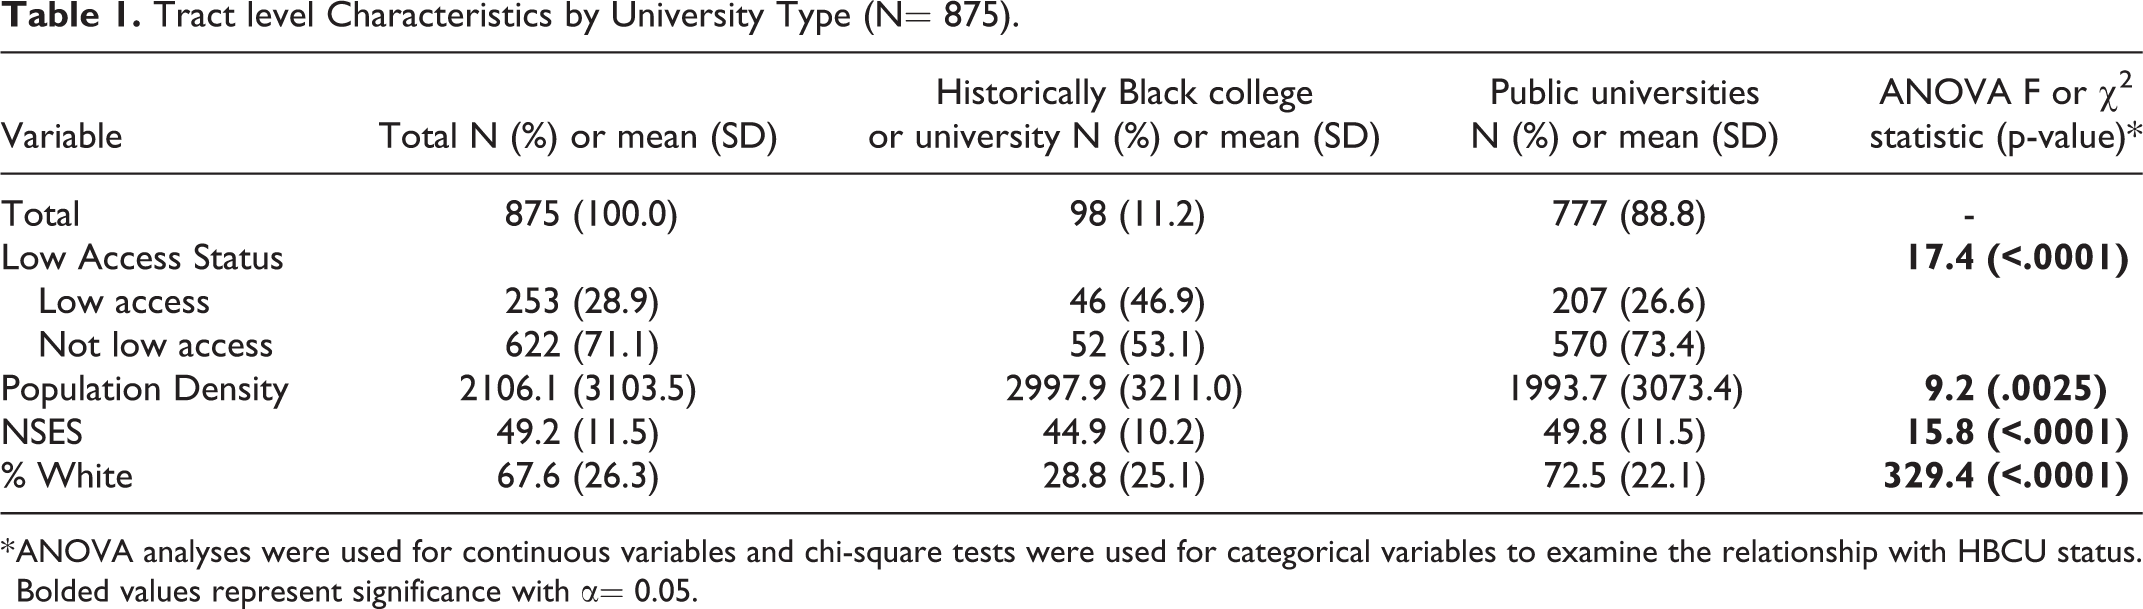
* ANOVA analyses were used for continuous variables and chi-square tests were used for categorical variables to examine the relationship with HBCU status. Bolded values represent significance with α= 0.05.
Table 2 presents one crude and two adjusted multilevel models (all adjusted for non-independence within census tracts) examining the relationship between HBCU status and census tract food access classification. Depicted in Model 1, HBCU status was significantly associated with food access classification (B=0.90;p<.0001). The odds of an HBCU being located in a LFA tract were 146% greater compared to that for a public non-HBCU (OR=2.46;95%CI=1.56,3.88). Model 2 shows that, after adjusting for population density, HBCU status was significantly associated with food access classification (B=0.94;p<.0001). The odds of an HBCU being located in a LFA tract were 156% greater compared to that of public non-HBCUs (OR=2.56;95%CI=1.61,4.06). Model 3 shows that, after adjusting for population density and NSES, HBCU status was significantly associated with food access classification (B=0.71;p=.0036). The odds of an HBCU being located in a LFA tract were 104% greater compared to that of public non-HBCUs (OR=2.04; 95%CI=1.26,3.29).
Multi-Level Analysis Examining the Relationship Between HBCU Status and Food Access (N= 875).

1Odds Ratio (OR), 95% Confidence Interval
* p<.05; **p<.01; ***p<.001
Discussion
Summary
Findings indicate that HBCUs are more likely to be located in LFAs than public non-HBCUs.
Limitations
LFAs may not always be an accurate proxy for healthy eating as research suggests that LFA residents purchase the majority of their unhealthy food at supermarkets. 9 College student food security (i.e., reliable access to sufficient quantities of nutritious affordable food) 10 is also complex as students may have healthy food options available on campus or live outside the university’s census tract.
Significance
This study highlights potential disparities in food environments for students attending HBCUs with implications for food access, academic, 1 and health outcomes (e.g., reduction in risk of chronic disease due to dietary intake). 4 Findings corroborate research showing low rates of food security for students attending HBCUs 1 as well as off-campus HBCU environments with limited healthy food options, 2 mirroring national demographic trends. 10 HBCUs could benefit from alternative methods for helping students access fresh produce (e.g., farmer markets, campus food pantries, mobile markets). For example, to address some of these disparities, Allen University employs a multi-tiered approach for tackling food access including: 1) partnering with a local church to solicit donations, 2) empowering students to run a campus food pantry, 3) reducing stigma associated with accessing the pantry, and 4) working with city leaders to inform local policy. 11 Policy interventions aimed at reducing poverty should be designed to address food access among college students, especially those attending HBCUs (e.g., lowering eligibility barriers for and increasing outreach regarding the Supplemental Nutrition Assistance Program, subsidized meal plans, etc.).
So What?
What is already known on this topic?
Although research examining the prevalence of equitable food access among college students attending HBCUs is limited, several studies suggest that lower food access may exist in food environments surrounding HBCUs.
What does this article add?
This is the first national study to reveal that HBCUs are significantly more likely to be located in a low food access tract as compared to non-HBCUs.
What are the implications for health promotion practice or research?
HBCUs could benefit from alternative methods for helping students access fresh produce and policy interventions designed to increase food access.
Footnotes
Acknowledgements
The authors were the only individuals who contributed to the study.
Authors’ Note
This study utilized archival geographic data from national databases. No human subjects were involved, and thus IRB approval was not needed.
Declaration of Conflicting Interests
The author(s) declared no potential conflicts of interest with respect to the research, authorship, and/or publication of this article.
Funding
The author(s) received no financial support for the research, authorship, and/or publication of this article.
