
Abstract
Policy researchers often have to estimate the future effect of imposing a policy in a particular location. There is often evidence on the effects of similar policies in other jurisdictions but no information on the effects of the policy in the jurisdiction in question. And the policy may have specific features not reflected in the experiences of other areas. It is then necessary to combine the evidence from other locations with detailed information and data specific to the jurisdiction in question, with which to simulate the effects of the policy in the new jurisdiction. We illustrate and use this approach in estimating the impact of a proposed living wage mandate for New York City, emphasizing how our ex ante simulations make use of detailed location-specific information on workers, families, and employers using administrative data and other new public data sources.
Keywords
Introduction
With the advent of the living wage movement in the early 1990s, labor economists and other policy analysts have often been asked to estimate the future effects of imposing a local wage mandate in a city. Lacking a historical record, studies for the cities that implemented living wages early relied on ex ante simulations using some existing data and survey evidence, coupled with assumptions about the effects of the mandates (e.g., Pollin & Luce, 1998). As more local governments adopted living wage laws, “before-and-after” (longitudinal) evidence became available (e.g., Neumark & Adams, 2003), although the experience of other cities may not capture specific features of a given city’s economic landscape or the specifics of a proposed law.
In 2010, a proposal (Intro 251) was introduced to significantly expand New York City’s existing very narrow contractor-only living wage law to a broad “business assistance” living wage law intended to cover firms and real property receiving financial assistance from the city for economic development. The law would have covered employees, contractors, and subcontractors hired by the direct recipients of financial assistance, and tenants and subtenants, establishing a wage floor of $10 per hour, or $11.50 if health insurance was not provided. 1
The New York City Economic Development Corporation (NYCEDC) commissioned a comprehensive study to estimate the effects that Intro 251 would have on labor and real estate markets (Charles River Associates, 2011). The estimates are derived from ex ante simulations specific to New York City, but the parameters used are informed by new longitudinal estimates for other cities. The longitudinal estimates of the effects of living wages in other cities provide the best information we have on the actual effects of living wage laws that have been implemented. At the same time, there are limits to what we can learn about the potential effects of a living wage law in New York City from studying the experiences of other cities, because the law proposed for New York City had idiosyncratic features, and because the evidence from before-and-after analyses for other cities may be less applicable to New York City’s large, complex, and in many ways unique labor market.
Thus, we conducted detailed simulations of the effects of the proposed living wage law mandate in New York City, using highly detailed data for New York City that captures features of the labor market and the proposed law in a realistic way. Nonetheless, one needs to make assumptions about behavioral responses to do the simulation—in particular, for the employment effect of a living wage mandate—and it seems best to rest such assumptions, where possible, on estimates from observed changes in behavior.
The simulation analysis presents a number of innovations relative to the earlier ex ante simulations, based on new data and sources of information including extensive historical data on recipients of financial assistance from the city, employer-level data for New York City from the Quarterly Census of Employment and Wages (QCEW), and data on place of work and residence and other information from the relatively new American Community Survey (ACS). This article highlights the simulation analysis and the role these innovations play in the analysis.
Living wages have been and remain a contentious and politically-charged topic, and the reception of the Charles River Associates study was no exception. 2 Much of the debate focuses on the estimation of the wage and employment effects of living wages that are central inputs into the simulations. The purpose of this article is not to revisit this debate, although many of the estimates presented rely on the methods that have been subject to debate. Our new longitudinal estimates based on other cities are not the focus of the article; readers are referred to Neumark, Thompson, Brindisi, Koyle, and Reck (2012) for details and an extensive discussion of the debate over these methods. 3 The methods used in the simulations can be applied to other cities, whether using our longitudinal methods and estimates or using other estimates or assumptions regarding behavioral responses.
Nor is the goal of this article to argue about the actual effects of proposed legislation that has been substantially revised and, though subject to ongoing litigation, went into effect at the end of September 2012. From a research perspective this would be of little relevance, and confirmation or rejection of our simulation results ultimately requires ex post observations on the outcomes we simulate. Rather, the goal of this article is to present to researchers and practitioners the comprehensive methods and data sources that in our view can and should be used to evaluate the prospective effects of living wage policies. 4 We describe the results of our analysis along the way to illustrate and explain our methods, while recognizing that other researchers, even following our approach, might do things differently and reach different answers. Regardless, we believe the methods and data we use provide a template for more thorough and compelling predictions of the effects of living wage mandates and of related policies for which the data and methods are appropriate.
Simulating the Effects of the Living Wage in New York City
Evaluating the likely effects of New York City’s living wage law required elements of an ex ante analysis to account for the uniqueness of the city and the proposed legislation. At the same time, evidence on the effects of living wages in other cities provides the best information on the actual effects of laws that have been implemented. Thus, we conducted an updated longitudinal analysis of living wage laws in U.S. cities to estimate the behavioral responses, and coupled this with rich, new data sources to try to capture as accurately as possible the specific features of New York City’s labor market. In the next subsection, we briefly describe the results of the longitudinal analysis of other cities before turning in detail to simulations for New York City.
Estimated Effects on Low-Wage Workers and Low-Income Families
The estimation of the effects of living wage laws in other cities relies on monthly Current Population Survey (CPS) files to study workers and the annual March CPS files to study families. We use the methods from Adams and Neumark (2005a), updated as far as 2009. There were a number of complications stemming from changes in the classification of geographic areas in the CPS. Details are provided in Neumark et al. (2012). That same paper also presents a lengthy discussion of earlier criticisms of the research using the CPS data to estimate the effects of living wage laws, concluding that the CPS data and the methods used give valid results. Regardless, the emphasis in this article is on how these estimated effects get used in the simulation study, so researchers or policy analysts can easily substitute their own preferred estimates or a range of estimates or assumptions.
The analysis also required information on living wage laws. Cities are the political units that adopt most living wage laws. We characterized the living wage laws prevailing in a metropolitan area based on the living wages passed by the major cities in the metropolitan statistical area, which was also complicated by the changes in geographic classification. We engaged in extensive research to recover the needed historical information on living wage laws. Using this information, we coded the wage levels for the major cities in our analysis sample with living wages for each year and month from January 1995 through December 2009. 5 We also coded whether or not the living wage law applies to business assistance recipients or only to contractors.
This analysis leads to elasticities of wages and employment of low-skilled workers and individuals with respect to living wages, which we use in the simulation analysis that follows. The elasticity estimates we use come from the evidence on living wage laws in other cities that cover employers who receive financial or business assistance from the city, paralleling the proposed New York City living wage law. 6 Our preferred estimated wage elasticity was 0.051 (not statistically significant, but the positive finding is robust across many specifications and samples and significant in some). This elasticity applies to workers in the bottom decile of the wage distribution. As explained below, however, we do not rely explicitly on this wage elasticity in the simulation because we have detailed wage data and information on employers targeted by the proposal, so we can directly estimate the effect of topping covered workers up to the living wage. The estimated employment elasticity, in contrast, is a key input into the simulation. The estimated employment elasticity with respect to business assistance living wages that we prefer based on our analysis is −0.055 (statistically significant at the 5% level). This is estimated for those in the bottom decile of the predicted wage distribution. Our analysis indicated that the wage and employment effects of living wages fall on these lowest-skilled workers, and hence that their effects on the distribution of family incomes stem mainly from the effects of living wages on the lowest wage and lowest skilled workers. As a result, in the simulations for New York City below, we focus only on effects on the lowest wage, lowest skilled workers. 7
Past research on living wages in other cities has also studied the effects of living wages on family income and, in particular, the probability that a family is poor. These estimated effects capture the distribution of wage and employment (and hours) effects on families at different points of the income distribution. Again, the methods follow Adams and Neumark (2005a) and details are provided in Neumark et al. (2012). This analysis arrives at a preferred estimated effect of −0.035, which implies, for example, that a 100% increase in a business assistance living wage reduces the poverty rate by 3.5 percentage points (again not statistically significant but consistent across many specifications and samples and significant in some). However, in the simulation study we do not apply this elasticity directly, preferring to use the rich information we have on wages in New York City, coupled with our estimated employment elasticity, to directly simulate the effects on the family income distribution. Nonetheless, this estimate is useful as a comparison to our simulation results.
Simulation Study
We establish a baseline for our simulation by providing a detailed description of workers and families that could be affected by the proposed living wage law, and then project how they would be affected. We use multiple inputs, including data on New York City workers, families, and business establishments; estimates of effects of living wage laws that are broadly applicable to New York City; and information on income support and other programs available to New York City residents and how eligibility and benefit levels are determined. The estimates of behavioral responses to living wage laws, where appropriate, come from the analyses described briefly above. The other inputs—including the data used for New York City—are described next.
Data and Measurement
The ACS contains detailed information on where people live and work and can therefore be used to construct a detailed portrait of the New York City workforce and the population affected by the proposed living wage law. We also use the ACS to identify workers based on their wage levels, their industry and borough of employment, their place of residence, and the characteristics of other members of their families; the latter is used for simulating the effects on the distribution of family incomes. We use the 3-year ACS sample covering 2006-2008, which collects yearly data reweighted to yield average values over the sample period.
To identify workers directly affected by the proposed living wage, we had to identify covered work sites and obtain information about workers and earnings at these sites. Typically, tax expenditures for economic development in New York City are tied to construction or renovation of real estate. Various programs in place exempt the taxation of changes in properties’ assessed values for a number of years (New York City Department of Finance, 2011; NYCEDC, 2012). The New York City Department of Finance provided us with longitudinal data on commercial and residential properties receiving tax exemptions for fiscal years (FYs) 1984-2011. 8 The living wage proposal included a minimum financial assistance threshold of $100,000 for mandating living wages. However, it was not specified how to calculate the threshold (net present value, yearly assistance, etc.); the analysis was conducted based on buildings that received real property tax exemptions of $100,000 or more in at least one FY. 9 The proposal also required that once the threshold was met the mandates would apply for the life of the financial assistance or 30 years, whichever was longer.
The information on properties receiving tax exemptions was matched to business establishments in the QCEW data for 2006-2008—confidential data accessible to NYCEDC. 10 The QCEW has information on average quarterly earnings and number of jobs by establishment and on the address of each establishment, which was geocoded to real properties 11 ; we matched to sites that received assistance through FY2011 to provide the most representative snapshot of the kinds of businesses that locate in properties receiving financial assistance. We use the data to estimate the share of workers potentially affected by the living wage law and the increases in wages that would be experienced by affected workers, by borough and by industry. We use data on all for-profit employers at covered sites since many nonprofits were exempted from the proposed law.
We want to estimate how many of the workers at sites that received real property tax assistance of at least $100,000 at some point in the period FY1984-FY2011 (“covered sites”) would be affected by the proposed living wage law and by how much. Because we have no information about the distribution of wages within a QCEW establishment, however, we have to estimate this wage distribution and hence the share of workers paid less than $10 per hour. 12 We first estimate the percentiles of the wage distribution by industry and borough of employment using the ACS. We cannot just assume that the ACS wage distribution holds equally at all establishments in the industry and borough because wage levels may vary across employers. We therefore use the QCEW for each industry and borough to estimate the wage level for covered establishments. This in turn requires an estimate of average hours worked at establishments because the QCEW counts positions (including part-time). We use the ACS data to estimate average hours by industry and borough of employment and apply this to the QCEW data, by industry and borough, to estimate average wages. Finally, we compute the percentage difference between the average ACS hourly wage and the average QCEW wage in the industry and borough, and then adjust the percentiles of the ACS wage distribution by this amount to arrive at an estimated wage distribution for employees at covered establishments in each industry and borough. 13 We can then calculate the wage increases needed to bring wages up to $10, and the implied average percentage wage increase for affected workers and for all workers. This calculation approximates the change in wages that would actually occur in New York City if those earning less than $10 at covered sites were brought to that level.
Finally, we incorporated information on a wide range of income support and other assistance programs that are provided through federal, state, and city resources to New York City residents. Many of these programs have eligibility requirements or determinants of benefit levels based on household characteristics that are not reported in the ACS data, and others provide benefits that cannot be directly measured in dollar terms (e.g., Home Energy Assistance Program and New York City Housing Authority Resident Employment Services). Thus, we limited our analysis to three larger programs—Supplemental Nutrition Assistance Program (SNAP; formerly Food Stamp program), the Earned Income Tax Credit (EITC; federal, state, and New York City’s), and Medicaid—for which eligibility and benefit levels can be determined or estimated from the ACS data. SNAP and EITC benefits can be measured in dollar terms, whereas the dollar benefits of Medicaid depend on the family’s usage of medical services. We therefore measure the effect of the proposed living wage in terms of dollars for the SNAP and EITC programs and in terms of participation for the Medicaid program. Because the ACS data do not provide detailed information on assistance program participation or with which to predict participation well, we assume all families that are eligible to participate in a particular program based on simulated family earnings do participate when we simulate effects on program benefits.
Living Wage Coverage
Our calculations of the percent of employees who would be subject to the living wage law, and the simulations that follow from them, are based on sites that received real property tax assistance of $100,000 or more in at least one year. This threshold also happens to be fairly consistent with living wage laws in other locations, and hence the CPS estimates of the employment elasticity (and the other CPS estimates with which we compare some of our simulation results) are, roughly speaking, applicable to a definition of coverage based on this criterion. Based on workers employed at sites that received $100,000 in assistance, the estimated percentage of workers earning less than $10 per hour who would have been subject to the living wage laws ranges from 9.9% in Brooklyn to 31.3% in Staten Island and is 12.9% across all boroughs. There is also considerable variation across industries, from 4% in construction to 24.4% in retail trade. The potential impact of the living wage legislation depends on the percentage of low-wage workers employed at sites receiving assistance, the number of low-wage workers in the industry, and wages in the industry.
Simulation Methods
We begin with wages. The QCEW data provide estimates of the share of employment in each borough and industry at covered sites. For each borough (b; based on place of work) and industry (i) we denote the share of workers earning less than $10 per hour who are employed at sites that received assistance in that borough and industry as CEbi, which is the number of workers earning less than $10 per hour employed at sites receiving assistance in a borough and industry divided by the total number of workers earning less than $10 per hour in the same borough and industry.
To simulate the effects of the living wage, we have to assign wage increases to some workers who earn less than $10 per hour. In the ACS data, we can identify workers employed in any borough b and industry i who earn less than $10 per hour. Using the estimates of CEbi from the QCEW data, we apply the living wage to the borough and industry using the following method. For all workers employed in borough b and industry i, we take those who earn less than $10 per hour and give them a wage of $10 per hour with probability CEbi, while leaving their wage unchanged with probability (1 − CEbi). For those who are assigned the living wage rate, we assume no change in hours or weeks worked. For the purposes of calculating how the living wage would affect the wage distribution, this “random assignment” is better than just giving everyone the “expected” increase. Giving everyone the expected increase would lead to badly estimated distributional effects. This is particularly important when we examine whether a family is pushed above an income threshold, which can be very different depending on how the benefits are distributed.
Some individuals in the ACS data have wages below the minimum wage (due to measurement error, noncompliance with local minimum wage laws, or inapplicability of the minimum wage). We assume most individuals who would be subject to the law have an hourly pay rate at or above the minimum wage, and therefore in the simulations restrict the population eligible for a wage increase to those who report a wage that is at or above the 2006 minimum wage that is applicable to New York City workers—$6.75 per hour. 14 These restrictions also reduce measurement error from individuals reporting unusual hours, earnings, and weeks worked in the ACS. We also exclude self-employed earners.
The ACS data are reported at the individual level, but the individuals are representative individuals with specific weights based on the number of actual persons in New York City that they represent. To apply wage changes randomly to individuals working in New York City, we expand the ACS data by creating duplicate records for each individual based on their household weight. Using this expanded file, we randomly assign the living wage to individuals earning less than $10 per hour by borough and industry based on the above method. The household weight was used so that we could aggregate individuals back to a complete household level (each person in the household receives the same household weight).
The QCEW data capture those who work in New York City without regard to where they live; however, the ACS data capture place of residence and place of work. Since we are primarily interested in the effects on residents of New York City, we report the wage and employment effects for New York City residents. Nonetheless, some of the effects of the living wage would fall on residents of other cities and states who work in New York City. Below, these “outflows” are reported separately from the results pertaining to New York City residents and are labeled “Outside New York City.”
Given that our estimates from the CPS data indicate some probability of job loss, we also assign job loss to simulate the effects of the proposed living wage law. We tie our projected employment effects explicitly to the CPS evidence, using the elasticity of −0.055 discussed earlier, although we do not do this for wages because the CPS results on wages were less precise, and for New York City the QCEW and ACS data enable us to estimate the wage distribution at affected firms—something that could not be done with the CPS data. This reflects the trade-offs between relying on longitudinal studies of other cities versus ex ante simulations; with regard to wages, we have more specific information about the likely effects on wages in New York City, and hence use that information.
For most boroughs and industries, a $10 per hour living wage rate is above the 10th percentile of the wage distribution, implying that the estimated CPS employment effects would apply only to workers earning less than the living wage. We assume, however, that our CPS employment elasticity with respect to mandated wage increases above the minimum wage for the lower decile would approximately fall on the workers who, according to the QCEW data, would have their wages affected by the living wage, hence applying the earlier estimates for workers in each borough and industry that have wages below $10. 15
We calculate the predicted decline in employment among those workers earning below $10 per hour, given the proposed living wage increase and the estimated employment elasticity. This yields, overall for the city, a predicted probability of job loss, denoted p. We use the −0.055 employment elasticity described earlier. This elasticity comes from the longitudinal evidence from other cities and estimates the effect of increasing the living wage conditional on the other controls in the regression model. It therefore provides an estimate of what would happen in a single city where, as mimicked by the regression model, everything else (including possible underlying trends) remains the same. Applying this elasticity to the increase in the wage floor from the New York state minimum wage of $6.75 to the $10 living wage that the law would entail, a 48.1% increase implies an employment decline of 2.65% (0.055 × 0.481 × 100) among those earning less than $10 per hour.
The job loss presumably occurs among those at covered sites, although we simply apply this to workers in the ACS earning less than $10 per hour—distributed by industry and borough based on their estimated wage distributions—because we cannot identify which workers in the ACS work at covered sites. For each industry and borough, we have an estimate of the share of workers earning less than $10 per hour working at covered sites (CEbi). We want to assign job loss with higher probability to those who are more likely to be working at a covered site, based on their industry and borough of employment. To do this, we construct the probability that a worker earning less than $10 per hour working in borough b and industry i is at a covered site relative to the probability that any worker earning less than $10 per hour working in the city is at a covered site (CEcity). We then use a probability of job loss for a worker earning less than $10 per hour in borough b and industry i of p × {CEbi/CEcity}.
The simulations give us new wages for some workers and different employment statuses for others. Using these wage and employment changes for individuals, we simulate the effects of the living wage law on families by calculating how the distribution of family income changes, in particular relative to the poverty line and one half the poverty line (“extreme poverty”), using the poverty threshold for New York City from the New York City Center for Economic Opportunity (NYCCEO; 2011); we refer to these as “CEO thresholds.” 16 One limitation of this kind of simulation study of the effects of the living wage on family incomes is that we do not know the actual distribution of those who get wage gains and those who lose jobs across families with different levels of income (or differences in other characteristics). In contrast, we simulate effects assuming that these gains and losses from living wages are randomly distributed across potentially affected workers in proportion to their representation in the data by industry and borough. 17
The living wage proposal we studied would have applied to new recipients of financial assistance and to existing recipients in case of renewal or amendment of the original agreements. We do not know when or if current sites receiving financial assistance would, in the future, be new recipients as a result of assistance renewal or when new developments would qualify for and receive assistance in the future. As a consequence, we know of no reliable way to, for example, isolate some sites that would be recipients of new financial assistance in the next year, the next 2 years, and so on. Instead, we assume that the effects apply to all covered workers. As a result, the results should be thought of as long-run effects. Given that most other cities also apply business assistance provisions of living wage laws to new projects only and have been implemented at different times, it is likely that the estimates from the CPS data that we use for the employment response are intermediate between short-run and long-run effects.
Wage and Employment Effects
The dark bars in Figure 1 show the baseline wage distribution (up to $13.50) for those living and working in New York City. The vertical distance measures the percentage in each range relative to all workers living and working in the city. The chart includes all those with positive wages, but in our simulation only those earning between $6.75 and $10.00 could have their wages changed by the living wage. The second set of bars (labeled “Implementation of Living Wage”) shows the wage distribution after simulating the wage effects, with no employment effects. This bar is below each of the baseline bars less than $10 and then spikes at $10, with no changes above the proposed living wage because those who are assigned wage changes have their wages increased to $10. The last and lightest bars show the distribution of individuals after simulating the employment effects as well, where those who become disemployed are assigned a wage of zero. In each instance, the third bar is slightly below the second bar for wages of $10 or less, and these reductions cumulatively add to the small mass in the $0 wage column, reflecting job loss.

Distribution of wages before and after implementation of a $10 living wage law (based on sites receiving $100,000 or more of assistance in at least one year).
To provide some information on the variation in these effects across boroughs and in an industry that would likely be strongly affected, Figure 2 reports results for retail by borough. The figure is limited to those who either received a wage increase (to $10) or experienced a job loss. The largest impacts appear in Staten Island and the smallest impacts in Manhattan, and of course, the impacts are bigger than those in Figure 1. 18

Distribution of wages before and after implementation of a $10 living wage law, retail trade industry, by borough (based on sites receiving $100,000 or more of assistance in at least one year).
Table 1 provides more information on these wage and employment effects. Looking citywide, the table shows that about 13% of the workforce at covered sites are estimated to earn less than $10 per hour and hence would have their wage increased by the living wage. Our estimates indicate that roughly 33,600 workers would receive wage increases. The average increase for those who receive the living wage is substantial ($1.67). 19 Our simulations imply that just fewer than 6,000 would lose their jobs.
Wage and Employment Changes Overall, by Borough, and Outside New York City (Based on Sites Receiving $100,000 or More of Assistance in at Least 1 Year).

Source. Authors’ simulations.
Relative to the entire workforce, the proposed living wage would affect a little more than 1.2% of the entire workforce. But this percentage is more than twice as high in the Bronx (1.6%) than in Manhattan (0.7%), owing to differences in both industry composition and wage levels. The living wage would have a small impact on average wages of the entire workforce (0.1% increase) and on overall employment (a 0.2% decrease). These effects vary in a similar way by borough. Finally, we see that some (approximately 8%) of those receiving the benefit of the living wage mandate reside outside of New York City, suggesting that “leakage” to nonresidents is not very large.
Effects on Poverty and Family Income
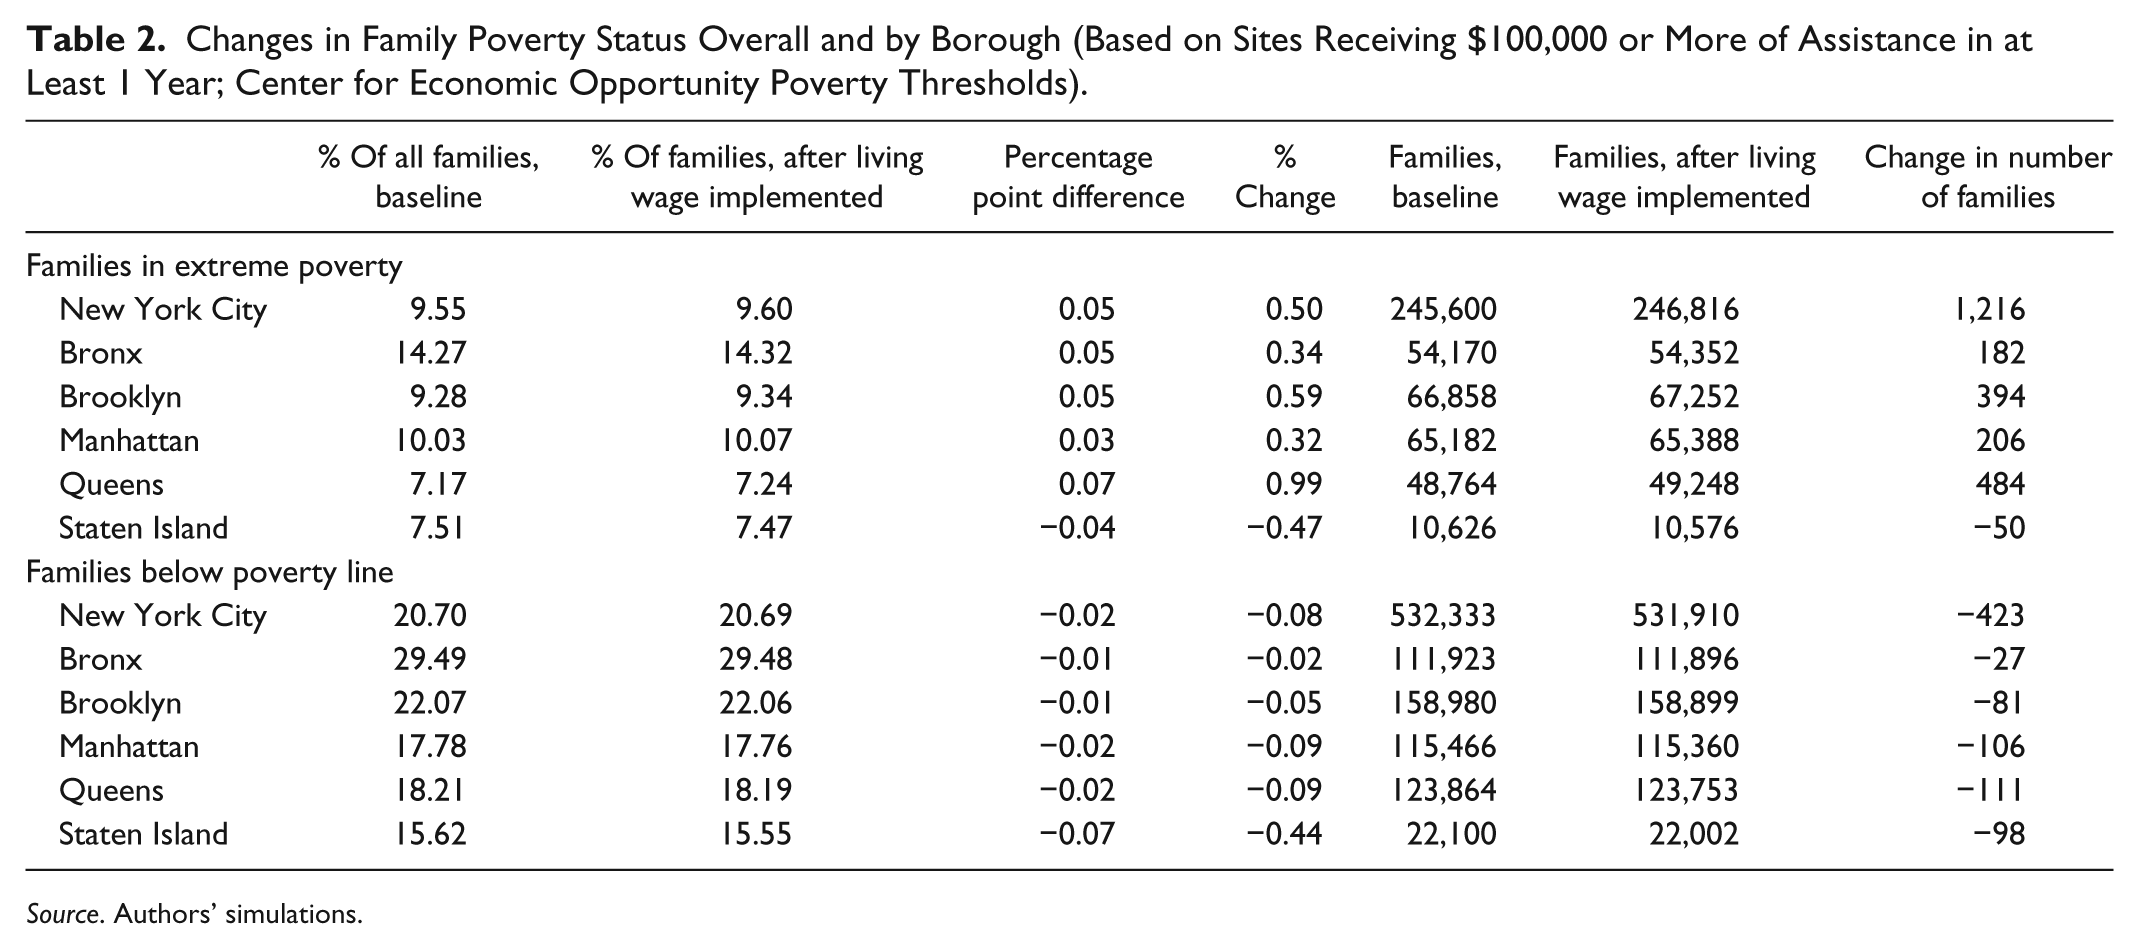
Table 2 reports on the results of the simulation for whether families are moved over the thresholds for poverty or extreme poverty. The first column reports the baseline percentages of families in extreme poverty (top panel) or poverty (bottom panel) for the city overall and for each of the boroughs, and the second column shows the percentages after we simulate the effects of living wages, assigning the wage increases and employment losses reported in the previous table. A comparison of these columns shows that the simulated changes in the income distribution in terms of these two thresholds are small and that they are mixed in terms of direction. As the top panel of the table shows, overall the percentage of all families classified as “extreme poor” would slightly increase by 0.05 percentage points or 0.5%; this would certainly be viewed as an unintended adverse consequence of the living wage. As the bottom panel shows, however, the percentage of families below the poverty line would slightly decrease by 0.02 percentage point or 0.08%.
Changes in Family Poverty Status Overall and by Borough (Based on Sites Receiving $100,000 or More of Assistance in at Least 1 Year; Center for Economic Opportunity Poverty Thresholds).
Source. Authors’ simulations.
The numbers of affected families are correspondingly fairly small. The simulations indicate that an additional 1,200 families would enter extreme poverty, whereas about 400 families would be lifted out of poverty. In other words, some families below the poverty line would be lifted above it, whereas others below the poverty line would sink further beneath it in what is a rather stark illustration of the fact that a higher living wage, given disemployment effects, creates both winners—those who get higher wages—and losers—those who lose their jobs. Overall, the results show that although the number of workers receiving wage increases is considerably higher than the number of workers experiencing job losses, the aggregate effect on the distribution of income is negligible. In other words, the simulations suggest that the living wage mandate would mainly redistribute income from some low-skilled workers who lose jobs to other low-skilled workers who earn higher wages.
These simulated impacts on poverty are lower than those experienced on average for other cities imposing living wage laws, as discussed above with respect to the CPS estimates; however, the findings are not inconsistent. The poverty thresholds used in the simulations are those reported by the NYCCEO (2011), which are higher than the federal poverty thresholds used in the CPS estimates. In addition, when we redid the the simulations without restricting affected workers to those earning at least the 2006 minimum wage rate, the impacts on poverty look more comparable to those estimated using the CPS data, even when we apply the NYCCEO poverty thresholds.
Income Support and Other Programs
Given that many income support programs require low family income to qualify, or tie benefits to income, we might expect the beneficial effects of living wages to be more limited than the increase in earnings because rising earnings reduce eligibility for benefits or affect the amounts for which workers are eligible from social programs such as Medicaid, State Children’s Health Insurance Program, SNAP, housing assistance, and the EITC. The implication is that families that see earnings rise because of a living wage law would also receive fewer government benefits. Of course, the effects of job loss go in the opposite direction.
These changes might be of interest to local policy makers. . If benefits decline, then to the extent that these benefits come from the federal (or state) government, there would be less money coming into a city. As a prime example, the federal EITC has grown into the largest program for providing income support to lower income families (Blank, 2002). As a consequence, when a worker’s earnings rise, the inflow of federal dollars via the EITC can decline. On the other hand, the expenses for some benefits paid by the local government would fall.
Our simulation goes into more detail on how the proposed living wage law would affect local, state, and federal expenditures on income support and other programs in New York City. Program participation and benefit levels are estimated based on the rules and award levels in place at the time of the study. The specific eligibility guidelines and charts showing benefit levels were obtained through state and federal government websites providing program details. 20 Medicaid and EITC eligibility and benefits are determined based on family income and number of family members. SNAP eligibility and benefits were also determined based on family size and income and applied the standard household and shelter deductions. Estimated EITC eligibility and benefit levels are based solely on family income, family size, and family structure (age of family members) and implicitly assume that families pass the other eligibility requirements for which we have no data. We calculate family eligibility and benefit levels prior to assigning wage and employment effects and also after assigning the simulated effects that we project would result from the living wage law to determine how assistance would be affected.
For Medicaid and SNAP there is a clear predicted relationship whereby eligibility or benefits decrease as earnings increase. However, for the EITC, benefits initially rise as earnings increase over some range, then remain flat, and eventually decrease. So for families affected by the living wage, EITC benefits may decline or increase depending on family income and the effects of the living wage.
Table 3 shows the aggregate impacts on eligibility and potential benefit levels for New York City families when the effects of the proposed living wage are simulated. The simulations show declines in EITC payments and in eligibility for and benefits from SNAP but an increase in the percentage eligible for Medicaid. 21 The changes range from approximately a 0.5% decrease to a 0.2% increase. Not surprisingly, boroughs with a higher percentage of low-wage workers covered (e.g., Staten Island) are projected to experience greater changes in eligibility and benefit levels and boroughs with a lower percentage of low-wage workers covered (e.g., Manhattan) are expected to have smaller changes. With respect to the EITC and SNAP, these conclusions imply that where a living wage law has the potential to deliver the most benefit because wages are lower, the earnings gains are likely to be more strongly offset because of declines in income from or eligibility for government assistance.
Changes in Support Programs Overall and by Borough (Based on Sites Receiving $100,000 or More of Assistance in at Least 1 Year).

Note. SNAP = Supplemental Nutrition Assistance Program; EITC = Earned Income Tax Credit.
Source. Authors’ simulations.
Finally, Table 3 also reports the changes in aggregate earnings and benefit amounts that are implied by simulating the impact of the living wage. Based on the simulated effects, family earnings would increase by approximately $11.6 million. Referring back to Table 2, these increases come from the approximately 34,000 workers who experience a wage increase, whereas approximately 6,000 workers experience reduced earnings due to disemployment. SNAP benefits decline only slightly, whereas EITC benefits would decline by approximately $4.6 million, offsetting over one third of the income gains.
Conclusions
We project the effects of a prospective living wage law in New York City, a type of exercise that has been fairly common in recent years and shares many features with prospective evaluations of other proposed policies. Longitudinal estimation of living wages implemented in some cities can be used to estimate effects based on historical experience, but it may fail to capture unique features of a specific labor market or policy proposal. Nonetheless, ex ante simulations require some evidence from this historical experience to obtain magnitudes of behavioral responses used in the simulations. We therefore combine the two methods. In addition, newly available administrative data on the labor market and covered employers, as well as detailed information on where people live and work in the ACS, increase the scope for basing these kinds of studies on a very accurate and complete empirical description of the relevant labor market. This article demonstrates how we use these methods and data to study the proposed living wage law and argues that these kinds of prospective evaluations should use these mixed methods and new data sources.
The key point of the article is its demonstration of methods and uses of data rather than the specific conclusions, both because research on the actual effects of laws is ultimately how social science evaluates policy and because the actual law implemented could end up differing from the one we studied, as it in fact did (as discussed below). For the record, nonetheless, the longitudinal evidence points to living wages generating both winners and losers—the former being those who get higher wages and the latter those who become jobless. This evidence to some extent updates earlier research, although changes in geographic classifications in the CPS data pose challenges in updating the evidence to the present.
These estimated wage and employment effects, along with the administrative and ACS data, are used in the simulations for New York City in large part to assess the likely distributional effects of the proposed living wage. The predicted distributional effects are quite modest, with poverty or extreme poverty rates changing little—although the extreme poverty rate actually increases. Thus the results suggest that the effect of the living wage proposal we studied would have primarily been to shift earnings from some low-wage, low-skilled workers to others. There is a net earnings gain to affected workers, but a sizable share of it (more than one third) would likely be offset by lower EITC benefits.
Insofar as this article is intended to outline how the effects of proposed living wage laws can be simulated, the methods, in our view, can be extended to other legislative proposals, although considerable caution should be exercised in generalizing the conclusions. The methods we have used take very explicit account of the likely effects of an actual living wage law, specifically by incorporating both the historical data on covered employers and the administrative labor market data on workers’ earnings at covered employers. These are very rich data, but once analysts have them in hand, a similar type of analysis can be done for other cities. Of course, the ability of analysts to get access to these data—especially the establishment-level QCEW—may be limited and may be less likely to be granted in smaller cities. We should also point out that only one member of our research team employed by the NYCEDC was able to work with these data directly; outside researchers working in isolation would face greater challenges.
The ACS data, in contrast, are publicly available and can therefore be used for many other cities; however, for considerably smaller cities these data become less useful. The geographic designation in the ACS that identifies cities is the Public Use Microdata Areas, which are areas within a state with at least 100,000 residents, but they are generally constructed using counties as building blocks. 22 Thus, for smaller cities that have larger portions of the counties they occupy outside city boundaries, the identification of city residents or workers is not as clean.
Generalizability of results is much trickier. First, the actual measurement of the number of affected firms, and the number and earnings of workers at those affected firms, can be quite different across cities. This depends on both the economic structure and the economic conditions in different cities, and on the structure of any proposed living wage law. We are of course aware that the economic structure of New York City is unique. New York City’s proposed law is what we have termed a business assistance living wage mandate. Thus the results are more generalizable to other laws that would cover recipients of assistance from cities. In contrast, expected results for narrower contractor-only laws would probably be quite different and—based on the work of Adams and Neumark (2005a)—much more modest.
It is true that the legislative proposal that we studied would have been among the most aggressive business assistance living wage laws in the nation, in part because of the extensive proposed coverage and in part because of steep penalties for noncompliance. 23 In particular, the living wage ordinance proposed for New York City differed from that in other cities in terms of its transference of liability to developers, landlords, or owners of the building, as they are the financial assistance “recipients,” rather than the normal practice of placing liability primarily on employers only. This feature of the living wage law, however, did not really enter into our labor market calculations, as the employment elasticity—which is a key driver of the simulations—was based on evidence from other cities. Thus, the results may be somewhat generalizable, and hence provide a benchmark for business assistance living-wage laws in other cities where the living wage falls at a similar percentile of the wage distribution at covered sites and there is a similar share of workers covered by the law—at least for large cities that share some features with New York City.
Indeed, given these features of the proposed living wage law, it is likely that because this employment elasticity comes from other cities, we have understated the effects of the proposed law in New York City. Moreover the larger report (Charles River Associates, 2011), of which our labor market research was one component, also studied how the real estate market in New York City was likely to be affected by the proposed living wage law. The real estate analysis suggested potentially quite adverse effects on real estate development in New York City owing to the coverage of the living wage law, to whom liability would have been extended, and the penalties for noncompliance, which include repayment of the financial assistance received. Because labor markets and real estate markets are closely related, were these adverse effects on real estate development to occur, the labor market impacts could be worse than the relatively modest impacts suggested by our labor market analysis.
Finally, by way of emphasizing that any simulation exercise like the one we present in this article must be attuned to the details of the specific living wage law under consideration, it turns out that New York City ended up adopting a considerably weaker living wage law (Local Law 37, in June 2012). 24 This law reduces coverage in a number of ways. It applies only to recipients of “discretionary” assistance rather than the broader category in the proposed law we were asked to study, which included “as-of-right” assistance recipients. It exempts tenants and subtenants unless they are controlled by the recipient of assistance. It also exempts nonprofits (largely exempted as well under the original proposal); manufacturing firms; some other affordable housing, retail, and commercial development projects; and businesses with annual gross revenues less than $5 million. Finally, it raises the threshold for coverage to at least $1 million of assistance in present value. The estimates presented in our article are based on a much larger employment base that included nearly all of the now-exempted businesses. There is little doubt then that the far narrower coverage of Local Law 37 would imply much smaller wage and employment effects than those we report in this article. Nonetheless, the methods we use could be readily applied to simulate the effects of the new law, using the data sources we have brought to bear on the problem that allow identification of covered employers and that permit estimation of the distribution of earnings at those employers.
Footnotes
Acknowledgements
We are grateful to Daniel Hamermesh for many helpful comments and to Marsha Courchane, Timothy Riddiough, and Anthony Yezer for collaboration on the Charles River Associates study.
Authors’ Note
The views expressed are those of the authors and do not reflect the views of Charles River Associates, the City of New York, its Office of Management and Budget, or the New York City Economic Development Corporation.
Declaration of Conflicting Interests
The authors declared no potential conflicts of interest with respect to the research, authorship, and/or publication of this article.
Funding
The authors disclosed receipt of the following financial support for the research, authorship, and/or publication of this article: This article is drawn from a larger study conducted by Charles River Associates, commissioned by the New York City Economic Development Corporation.