
Abstract
Previous research has identified the clustering of high-tech industries, entrepreneurial start-ups, and venture capital across metropolitan areas. Using detailed ZIP code data on start-up activity and venture capital investment, this research tests three hypotheses informed by urban theory on the clustering of innovation, entrepreneurship, and high-technology industry: (1) that start-up activity and venture capital investment will concentrate in distinct microclusters within metro areas, (2) that a substantial level of start-up activity and venture capital investment will cluster in dense urban neighborhoods or ZIP codes, and (3) that the clustering of start-ups and venture capital investment will vary by industry or type of technology. The authors find evidence to support all three. Start-up activity and venture capital investment are concentrated in a relatively small number of ZIP codes in the United States, the majority of which are in dense urban neighborhoods, and this clustering varies by industry and type of technology.
Venture capital has long been the type of finance that powers new and innovative start-up companies: Apple in personal computing, smart phones, and more; Genentech in biotechnology; Facebook in social media; and Airbnb in the sharing economy are just a small sample of the diverse and transformative companies financed by venture capital. It is a core component of the regional ecosystems and social structures of innovation that underpin leading high-tech regions (Florida & Kenney, 1988a; Saxenian, 1994).
Following Marshall (1890) and Jacobs (1961, 1970), a large body of literature has identified the geographic clustering of innovative and entrepreneurial activity (Audretsch, 2003; Audretsch, Falck, Heblich, & Lederer, 2011; Feldman & Audretsch, 1999; Feldman & Florida, 1994; Florida, 1995, 2002, 2005, 2006, 2012a; Glaeser, 1999, 2000, 2011; Glaeser, Kolko, & Saiz, 2001; Porter, 1990, 1996, 1998, 2006). Detailed case study research has pointed to the tighter clustering of innovative and entrepreneurial activity in more localized areas (Saxenian, 1994).
Traditionally, venture-capital-backed start-ups have clustered mainly in suburban locations, in office and industrial parks dubbed “nerdistans” (Kotkin, 1997, 2000), in suburbs like California’s Silicon Valley, the Route 128 beltway outside Boston, the suburbs of Seattle where Microsoft is located, suburban Austin, and the North Carolina Research Triangle. Early studies found that a disproportionate share of venture capital flowed to suburban areas in Silicon Valley and outside Boston with no significant venture capital investment or start-up activity occurring in urban areas (Florida & Kenney, 1988a, 1988b; Florida & Smith, 1993).
But, urban theory provides compelling reasons why venture-capital-backed start-ups should cluster in denser, more urban areas. Urbanists, going back to Jacobs (1961, 1970), have noted that innovative and entrepreneurial activity is the product of cities with their dense and diverse concentrations of people, talent, and companies. The past two decades have seen a powerful back-to-the-city movement of skilled and affluent people, which Ehrenhalt (2012) has dubbed a “great inversion.” Indeed, there is evidence that the pattern of start-up activity and venture capital investment has been similarly inverted, with an urban shift in this activity from suburbs to denser urban areas. The Bay area’s (including San Francisco as well as the Silicon Valley) share of venture capital investment has increased substantially over the past few decades, from roughly 22% in 1995 to 45% by 2015 (National Venture Capital Association, 2016). Innovation has become similarly concentrated. Forman, Goldfarb, and Greenstein (2016) have shown that the San Francisco Bay area has accounted for virtually all the increase in patenting in the United States since the mid-1970s, while patenting in all other large metros either stagnated or declined.
Other research has identified an urban shift in venturecapital-backed start-up activity from the suburbs back to cities (Florida, 2012b, 2013, 2014; Florida & Mellander, 2016), from the suburban enclaves of Silicon Valley to the urban districts in and around downtown San Francisco and New York City, especially lower Manhattan. Guzman and Stern (2016) documented the shift in the location of high-quality start-up activity from Silicon Valley to San Francisco, and from the Route 128 suburbs to downtown Boston and Cambridge near Harvard and the Massachusetts Institute of Technology (MIT). They found evidence that high-quality entrepreneurial start-ups have shifted from the exurban Route 128 area to downtown Boston, and dense transit-served areas of Cambridge around MIT and Harvard, and Silicon Valley to downtown and adjacent areas of San Francisco. Their broader statistical analysis found that high-quality start-ups are most likely to cluster geographically and spread into adjacent neighborhoods or ZIP codes. This is in line with urban theory in the manner of Jacobs (1961, 1970), which has long identified dense, diverse, walkable, mixed-use urban areas, and not more sprawling suburbs, as the prime generators of innovation and entrepreneurship.
Drawing from this literature, our research takes shape around three hypotheses. The first is that venture-capital-backed start-ups will cluster in distinct microclusters within cities and metro areas. The second is that we expect a substantial level of venture-capital-backed start-ups to cluster in dense urban neighborhoods or ZIP codes where more commuters walk, bike, or use transit to get to work. The third is that the location and clustering of venture-capital-backed start-ups will vary by industry or type of technology. There is a substantial literature on industry differences in innovative activity (Nelson, 1993; Klevorick, Levin, Nelson, & Winter 1995; Cohen & Klepper, 1996; Cohen & Levinthal, 1990). Commercial innovation and start-up activity in biotechnology has been found to cluster near university-based sources of knowledge and talent (Kenney, 1998, 2000; Powell, Koput, & Smith-Doerr, 1996; Owen-Smith & Powell, 2004). In other industries, innovative activity is shaped by and clusters near sophisticated end users as Von Hippel (1988) has shown. For these reasons, we hypothesize that venture-capital-backed start-ups in biotech and related fields will cluster near university-based sources of knowledge and talent, while venture-capital-backed start-ups in fields like media and entertainment will tend to cluster around end users, larger incumbent firms, and sources of talent that tend to be based in the commercial centers of large cities.
We test these hypotheses by using detailed data at the ZIP code level on venture-capital-backed start-up activity. Previous research has been limited by the availability of highly aggregated data for venture-capital-backed start-ups at the state or metro levels. The ZIP code data enable us to examine the location of venture-capital-backed start-ups in urban versus suburban locations. We do so based on two conventional measures of urbanity: household density and the way people commute to work—looking at the share of commuters who walk, bike, or use public transit versus those who drive their own cars.
We further examine venture-capital-backed start-up activity overall for the five leading industries receiving venture capital investment: software, information technology services, biotechnology, biomedical equipment and devices, and media and entertainment. As noted earlier, we expect the clustering of start-up activity to vary across these industries and technology fields.
Our research examines all ZIP codes with venture-capital-backed start-up activity across the United States. We examine how ZIP codes in which venture-capital-backed start-ups are located differ based on characteristics including population size, household density, and the share of commuters who walk, bike, or take transit to work. We also provide a more detailed and focused examination of the geographic location and clustering of venture-capital-backed start-up activity for the three metropolitan areas that receive the largest amounts of venture capital: the San Francisco Bay area, New York metropolitan area, and the Boston–Cambridge metropolitan area.
Our findings provide substantial evidence in support of these three hypotheses. First, we identify significant clustering of venture-capital-backed start-ups within metros at the ZIP code level. Second, we find more than half of venture-capital-backed start-up investment to be in urban ZIP codes. Third, we find the clustering of venture-capital-backed start-ups to vary by industry or technology fields, with media and entertainment start-ups and information technology start-ups more likely in urban ZIP codes, software start-ups relatively equally located in urban and suburban ZIP codes, and biotech and medical start-ups more likely to be located around universities and laboratories with capabilities in related scientific and technological fields.
The remainder of this study is organized as follows. The next section describes the variables, data, and methodology used in this research, then turn to our findings. We begin by summarizing our key findings regarding the location of venture-capital-backed start-ups across urban versus suburban ZIP codes in the United States. We then map the leading ZIP code microclusters for venture-capital-backed start-up activity across the country as a whole and by leading industry. A more detailed analysis of the urban versus suburban microclusters of venture-capital-backed start-ups in the San Francisco Bay area, New York, and Boston is then presented. The conclusion summarizes our findings and outlines implications for urban theory and future research.
Variables, Data, and Methodology
As noted earlier, a key limitation of previous research on venture-capital-backed start-ups and venture capital has been the availability of only highly aggregated data at the state or metro levels. Our research includes data on all ZIP codes with venture-capital-backed start-up activity based on detailed data from Thomson Reuters (2013), which provides more granular information on venture capital investments by location. Thomson Reuters data are a propriety data set that requires a subscription to access. These data are continually updated as new venture capital and private equity transactions occur and are modified. The data are typically used by venture capital and private equity professionals for financial analysis. The data include the name and address of start-ups receiving venture capital investment, the total dollar value of the investment, industry sector of the start-up, and geographic information, including ZIP code, metropolitan area, and state.
We downloaded the data by address and location including identifiers for metropolitan area and ZIP code. Specifically, we captured all the venture capital transactions that occurred for the year 2013, which was the most recent full year available at the time of our research. We identified venture capital investments in 1,339 ZIP codes. These ZIP code data were assigned to ZIP code tabulation areas (ZCTAs), the representation of ZIP codes used by the U.S. Census Bureau. To aggregate these ZIP code data, we used census conversions to convert the point-based data set of addresses into a polygon data set for ZCTAs. This conversion was done using the Missouri Census Data Center’s ZIP code to ZCTA crosswalk for 2010 (U.S. Census Bureau, 2014). After this conversion, 1,339 ZIP codes became 1,301 ZCTAs receiving venture capital investment. Ultimately, we identified venture capital investments in roughly 4% (3.9%) of all 33,144 ZCTAs across the United States.
ZIP codes are not perfect representations of neighborhoods, but they are the best available unit of analysis for examining the clustering and location of venture-capital-backed start-up activity. ZIP codes include residential neighborhoods, commercial areas, and areas of business and industrial activity. They are thus a reasonable unit with which to test our contention that venture-capital-backed start-ups cluster in specific geographic areas within metro areas, and to test the hypothesis that a substantial share of venture-capital-backed start-up activity will be located and clustered in dense areas of the urban center. ZIP code data are particularly useful in testing this latter contention. Much of the literature on industrial location and, in fact on the clustering of high-technology industry, suggests that industrial and high-tech activities cluster near one another and away from residential areas. But, our ZIP-code-level data allow us to test for the claim that venture-capital-backed start-ups are clustering in areas with high residential densities as opposed to industrial or commercial areas with limited residential activity and uses. If we find venture-capital-backed start-up activity to be clustered in locations with substantial residential densities, this provides evidence that such start-ups are being attracted to, located in, and or clustered around areas with comparatively dense concentrations of people or talent.
We also examine the location of venture-capital-backed start-ups by ZIP code for the five leading industries or technology sectors receiving venture capital investment: software, biotechnology, media and entertainment, medical devices and equipment, and information technology services. These industry definitions are based on those used by PricewaterhouseCoopers (PWC, 2014) in its analysis of the venture capital industry. PWC defines these industry sectors as follows: Software includes producers of software; biotechnology includes drug developers and disease treatment technologies; media and entertainment includes technology and services designed to inform or entertain through various types of media; medical devices and equipment includes technology related to medical diagnostic and therapeutic equipment and devices, and other health related products; information technology services refers to providers of Internet-related services that include software consulting, web design, data input and processing, Internet security, e-commerce services, and other related services.
We identify urban versus suburban ZIP codes based on a methodology originally devised by Kolko (2015) that classifies them based on household density, which is a basic measure of urbanity. The cutoff for urban areas is 2,213.2 households per square mile. Suburban areas are defined as areas with between 101.6 and 2,213.2 households per square mile and rural areas are defined as areas that have less than 101.6 households per square mile. Across the nation, 63.3% of ZCTAs (18,572 of the 29,330) are rural, 28.7% (8,406) are suburban, and 8% (2,352) are urban. In addition, 2.4% or 31 ZCTAs are nonresidential ZIP codes that are not designated urban, suburban, or rural. Of the 1,301 ZCTAs that receive venture capital investment 38.6% (501) are urban, 44.3% (718) are suburban, and just 4% (49) are rural. This more precise definition of urban versus suburban locations represents an advance over previous studies of start-up activity and venture capital investment.
We further distinguish locations based on the way people commute to work, identifying between ZIP codes by the mode of transportation based on the shares of commuters who walk, bike, or use transit to get to work versus those who drive to work. ZIP codes where more people walk or bike to work are typically located closer to central business districts and commercial areas, while ZIP codes where more people use transit to get to work are located around transit hubs, which also tend to require greater density. Conversely, ZIP codes where people use cars to get to work are less dense, more sprawling, and more suburban. These data are from the American Community Survey’s 2013 five-year estimate (U.S. Census Bureau, 2013). The data from the American Community Survey are based on the respondent’s place of residence. Therefore, this commuting measure is based on where people live. As such, it provides an indicator of the location of venture-capital-backed start-ups around denser, more urban neighborhoods where people live as opposed to where they work, which is exactly what we want to capture in this research.
We provide a more detailed examination of the location and clustering of venture-capital-backed start-up activity in the three city-regions or metro areas that receive the greatest amounts of venture capital—the San Francisco Bay area (which includes San Francisco and San Jose), greater New York, and the Boston–Cambridge metropolitan area. Together, these three metros attract roughly 60% of all venture capital invested across the United States. For these three metros, we provide detailed maps of investment in venture-capital-backed start-ups, which enable us to look in greater detail at the location and clustering of them around research universities based on the Carnegie Corporation list of 115 R1 universities (2016) and research laboratories, and around subway and transit lines.
Mapping Venture Capital Investment by ZIP Code
We now turn to the findings of our research. We begin by looking at the geography of venture capital investment by ZIP code. Figure 1 maps the location of venture capital investment by ZIP code across the United States in 2013. Note the large circles in the San Francisco Bay area, around Los Angeles and San Diego in southern California, the New York–Boston–Washington corridor on the east coast, and elsewhere across the country, indicating large levels of investment.

Venture capital investment by ZIP code (2013).
Table 1 lists the top 20 ZIP codes for venture capital investment across the United States and shows how they compare on these urbanity measures. Of the top 20, 11 are urban and 9 are suburban. In these top 20 ZIP codes, roughly three times as large a share of commuters walk, bike, or use transit to get to work compared with the national average—25.9% versus 8.4%. In 6 of the top 20, 60% of commuters do so. In 16 of the top 20 ZIP codes, the share of commuters who walk, bike, or take transit to work exceeds the national average. Seven of these ZIP codes have densities greater than 5,000 people per square mile. The top two ZIP codes for venture capital investment, each of which receives more than a billion dollars in investment, have densities of nearly 10,000 people per square mile, and roughly 60% of commuters in these two ZIP codes walk, bike, or use transit to get to work.
The Top 20 ZIP Codes for Venture Capital Investment (2013).

Overall, venture-capital-backed start-up activity is highly concentrated in a relatively small number of ZIP codes across the United States. The top 20 ZIP codes for venture investment account for nearly one third of the total, while just the top 10 account for roughly one fifth of total venture investment. Furthermore, less than 1% of ZIP codes attracted more than $100 million in venture capital investment, and these ZIP codes account for more than 60% of all venture capital investment. In fact, less than 4% of all ZIP codes received any venture capital investment at all, and of these, roughly half attracted less than $5 million each.
Key Characteristics of Venture Capital Investment ZIP Codes
We now turn to the key characteristics of venture capital investment ZIP codes. Table 2 shows the share of venture capital investment in urban versus suburban ZIP codes based on their household density thresholds (Kolko, 2015).
Venture Capital Investment in Urban Versus Suburban ZIP Codes (2013).

More than half of all venture-capital-backed start-up companies (56.6%) and half of all venture capital investments (54%) are in urban ZIP codes. Indeed, the share of ZIP codes with venture-capital-backed start-ups and venture capital investment is roughly seven times greater compared with the national average. (Across the United States, more than 60% of all ZIP codes are rural, about 30% are suburban, and just 8% are urban.)
Another way to gauge urbanity is through the way people commute to work. People in more urban areas are far more likely to walk, bike, or use transit, while people in more sprawling suburbs are more likely to drive cars. In fact, a key dimension of an older style, suburban, high-tech nerdistan is that the engineers and other commuters that populate high-tech companies prefer to drive their cars to work. Table 3 shows the distribution of ZIP codes with venture capital investment by the percent of commuters who walk, use their bikes, or take transit to work.
Venture Capital Investment by Type of Commute (2013).
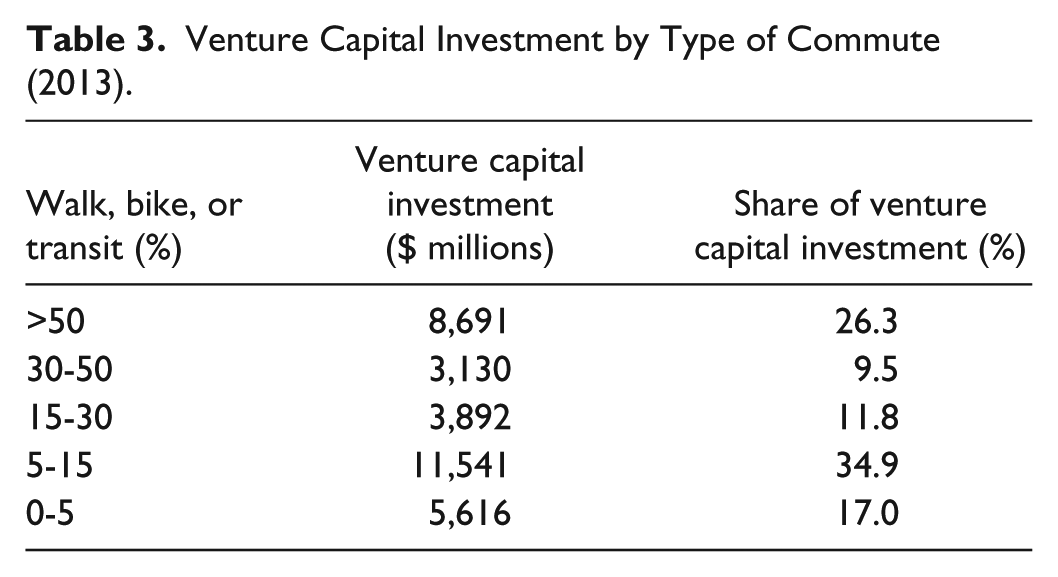
Across the United States as a whole, 8.4% of commuters walk, bike, or use public transit to get to work, while the vast majority drive. However, in ZIP codes with venture-capital-backed start-ups, significantly more commuters walk, bike, or use transit. In fact, nearly twice as large a share of commuters (16.6%) walk, bike, or use transit to get to work in ZIP codes with venture-capital-backed start-ups. Nearly half of all venture capital investment is in ZIP codes where more than 15% of commuters walk, bike, or take transit to get to work. And, more than a quarter of all venture capital investment is in ZIP codes where more than half of all commuters walk, bike, or take transit to work.
To get a sense of the broader statistical relationship between venture-capital-backed start-ups and urbanity, we ran a basic correlation analysis between the number of venture-capital-backed start-ups and the amount of venture capital investment, and density, commuting style, and several other demographic factors, notably income and education levels, for the 1,000-plus ZIP codes that have venture capital investment. There are two caveats to this analysis. First, it does not consider the many ZIP codes that do not have any start-up activity or venture capital investment. Second, ZIP codes are relatively small geographic areas, and workers will frequently live and work in different ZIP codes, which our analysis does not consider.
Still, we find positive and significant correlations between density and the number of venture-capital-backed start-up companies (0.32) and the amount of venture capital investment (0.23), as well as between the share of commuters who walk, bike, or take transit to work and the number of venture capital–backed start-ups (0.36) and venture capital investment (0.17). Not surprisingly, since urban neighborhoods in cities that have plenty of venture capital (e.g., San Francisco, New York, and Boston) tend to have higher housing prices and be composed of greater numbers of more affluent and more highly educated people, we also find positive and significant correlations between venture-capital-backed start-ups and the amount of venture capital investment and both income levels (0.28, 0.25), and education attainment measured as the share of adults who are college graduates (0.21, 0.24).
It is also important to point out that these correlations appear to be driven by a relatively small number of ZIP codes that have large amounts of venture-capital-backed start-ups and venture capital investment. And, of course, correlations do not specify causality or the direction of these relationships, but simply are suggestive of relationships between these variables, which may go either or both ways and may be influenced by other factors for which we do not test or control. For these reasons, we want to stress that these correlations are merely suggestive of the connection between venture-capital-backed-start-ups and the density and urbanity of ZIP codes. It may be that it is not density per se that is the ultimate cause of this connection, but rather that density reflects other characteristics of places that attract the talent and help create an environment that is more conducive to venture-capital-backed start-ups.
Table 4 extends our analysis comparing ZIP codes with venture-capital–backed start-up activity with those without it. We compare the top 10, top 50, and all ZIP codes with venture capital investment versus ZIP codes without venture capital investment and versus all U.S. ZIP codes in 2013. We do this for our key indicators of household density and the share of commuters who walk, bike, or use transit to work. As Table 4 shows, the ZIP codes with venture capital investment have significantly higher densities and significantly higher shares of commuters who bike, walk, or use transit to work. The differences regarding household density and the share of commuters who walk, bike, or use transit to get to work are statistically significant based on t tests.
Characteristics of Venture Capital ZIP Codes in the United States (2013).

Note. The differences between ZIP codes with venture capital investment and those without are statistically significant based on t tests.
The top 50 ZIP codes for venture capital investment have household density of 3,379 households per square mile and all ZIP codes with venture capital investment have density of 3,065 households per square mile. This compares with a density of 401 households per square mile for ZIP codes without venture capital and a density of 516 households per square mile for all U.S. ZIP codes. In the top 50 ZIP codes with venture capital, 17.9% of commuters walk, bike, or take transit to work, compared with 16.6% of commuters in all venture capital ZIP codes and 8.4% in all ZIP codes and just 4.9% in ZIP codes without venture capital.
Variation in the Location of Venture Capital Investment by Industry
We now turn to the location and clustering of venture-capital-backed start-up activity by major industry, mapping investment by ZIP code for the five leading high-tech sectors: software, biotechnology, media and entertainment, medical devices and equipment, and information technology services. Figure 2 maps the leading microclusters for venture-capital-backed start-up activity in these five leading industries.
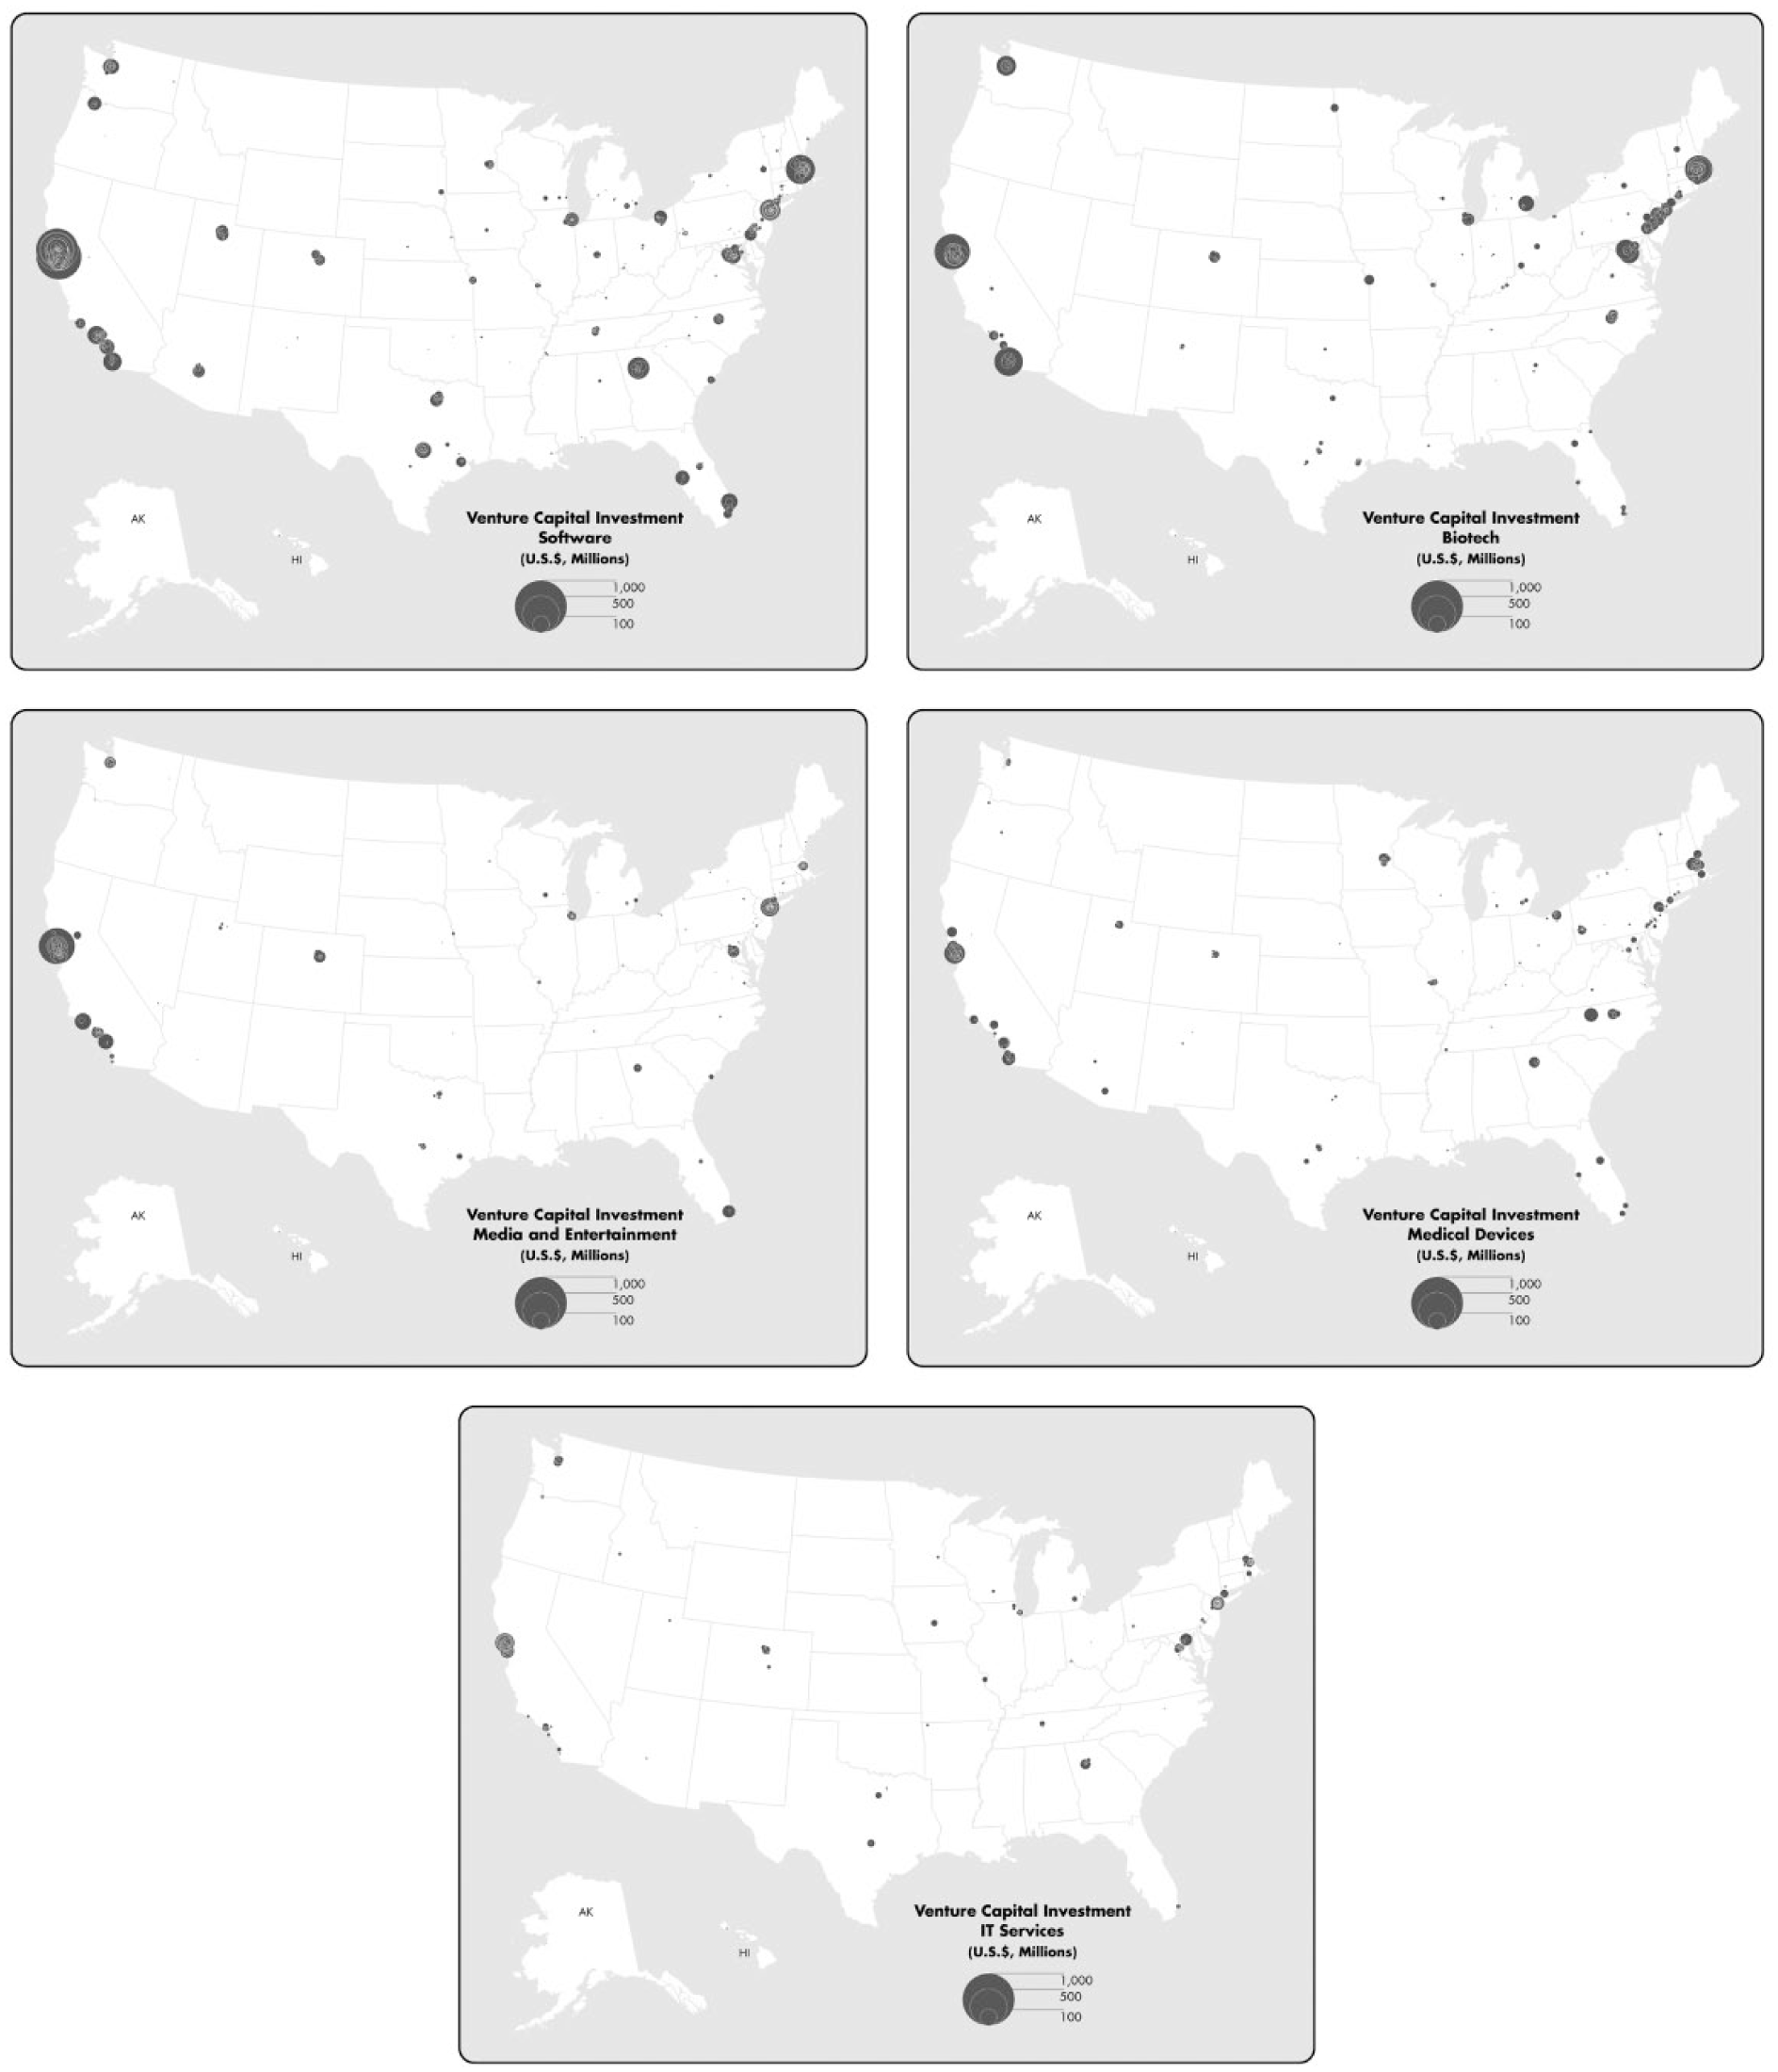
The five leading industries for venture capital investment (2013).
Software
Software is the leading industry for venture capital investment across the United States, attracting 36% of the total. Figure 2 shows significant clusters in and around the San Francisco Bay area and across the New York–Boston–Washington corridor, as well as smaller clusters in and around Los Angeles and southern California, Seattle, Portland, the North Carolina Research Triangle, Austin, and several other areas. Table 5 lists the 20 leading ZIP code–level microclusters for venture capital investment in software.
Leading ZIP Codes for Venture Capital Investment in Software (2013).

Palo Alto (94301) tops the list with 6.3% of the total. Three San Francisco ZIP codes are next: Rincon Hill (94105) with 5.5%, Potrero Hill/Dogpatch/South Beach (94107) with 3.7%, and south of Market/Mission District (94103) with 3.3%. Fifteen of the top ZIP codes for venture capital investment in software are in the San Francisco Bay area—eight in San Francisco and seven in San Jose. Outside the Bay area, two ZIP codes in New York fall in the top 20 (Gramercy Park and Times Square/Hell’s Kitchen) and one each in Boston (Waltham), Atlanta (Dunwoody), and San Diego (Sorrento Valley). Of the top 20 ZIP codes, 11 are urban while 9 are suburban, with the top 4 ZIP codes being urban.
Venture capital investment in software is highly clustered at ZIP code level as well. The top 20 ZIP codes account for nearly half of the national total (43.5%) and the top 10 accounts for 30% of all software investment.
Biotechnology
Biotechnology is the second leading sector for venture capital investment with 17% of all venture capital investment in the country. Figure 2 shows significant clustering in and around the San Francisco Bay area, southern California, and the New York–Boston–Washington corridor, as well as Seattle and Detroit. Table 6 lists the 20 leading ZIP-code-level microclusters for investment in biotechnology across the country.
Leading ZIP Codes for Venture Capital Investment in Biotechnology (2013).
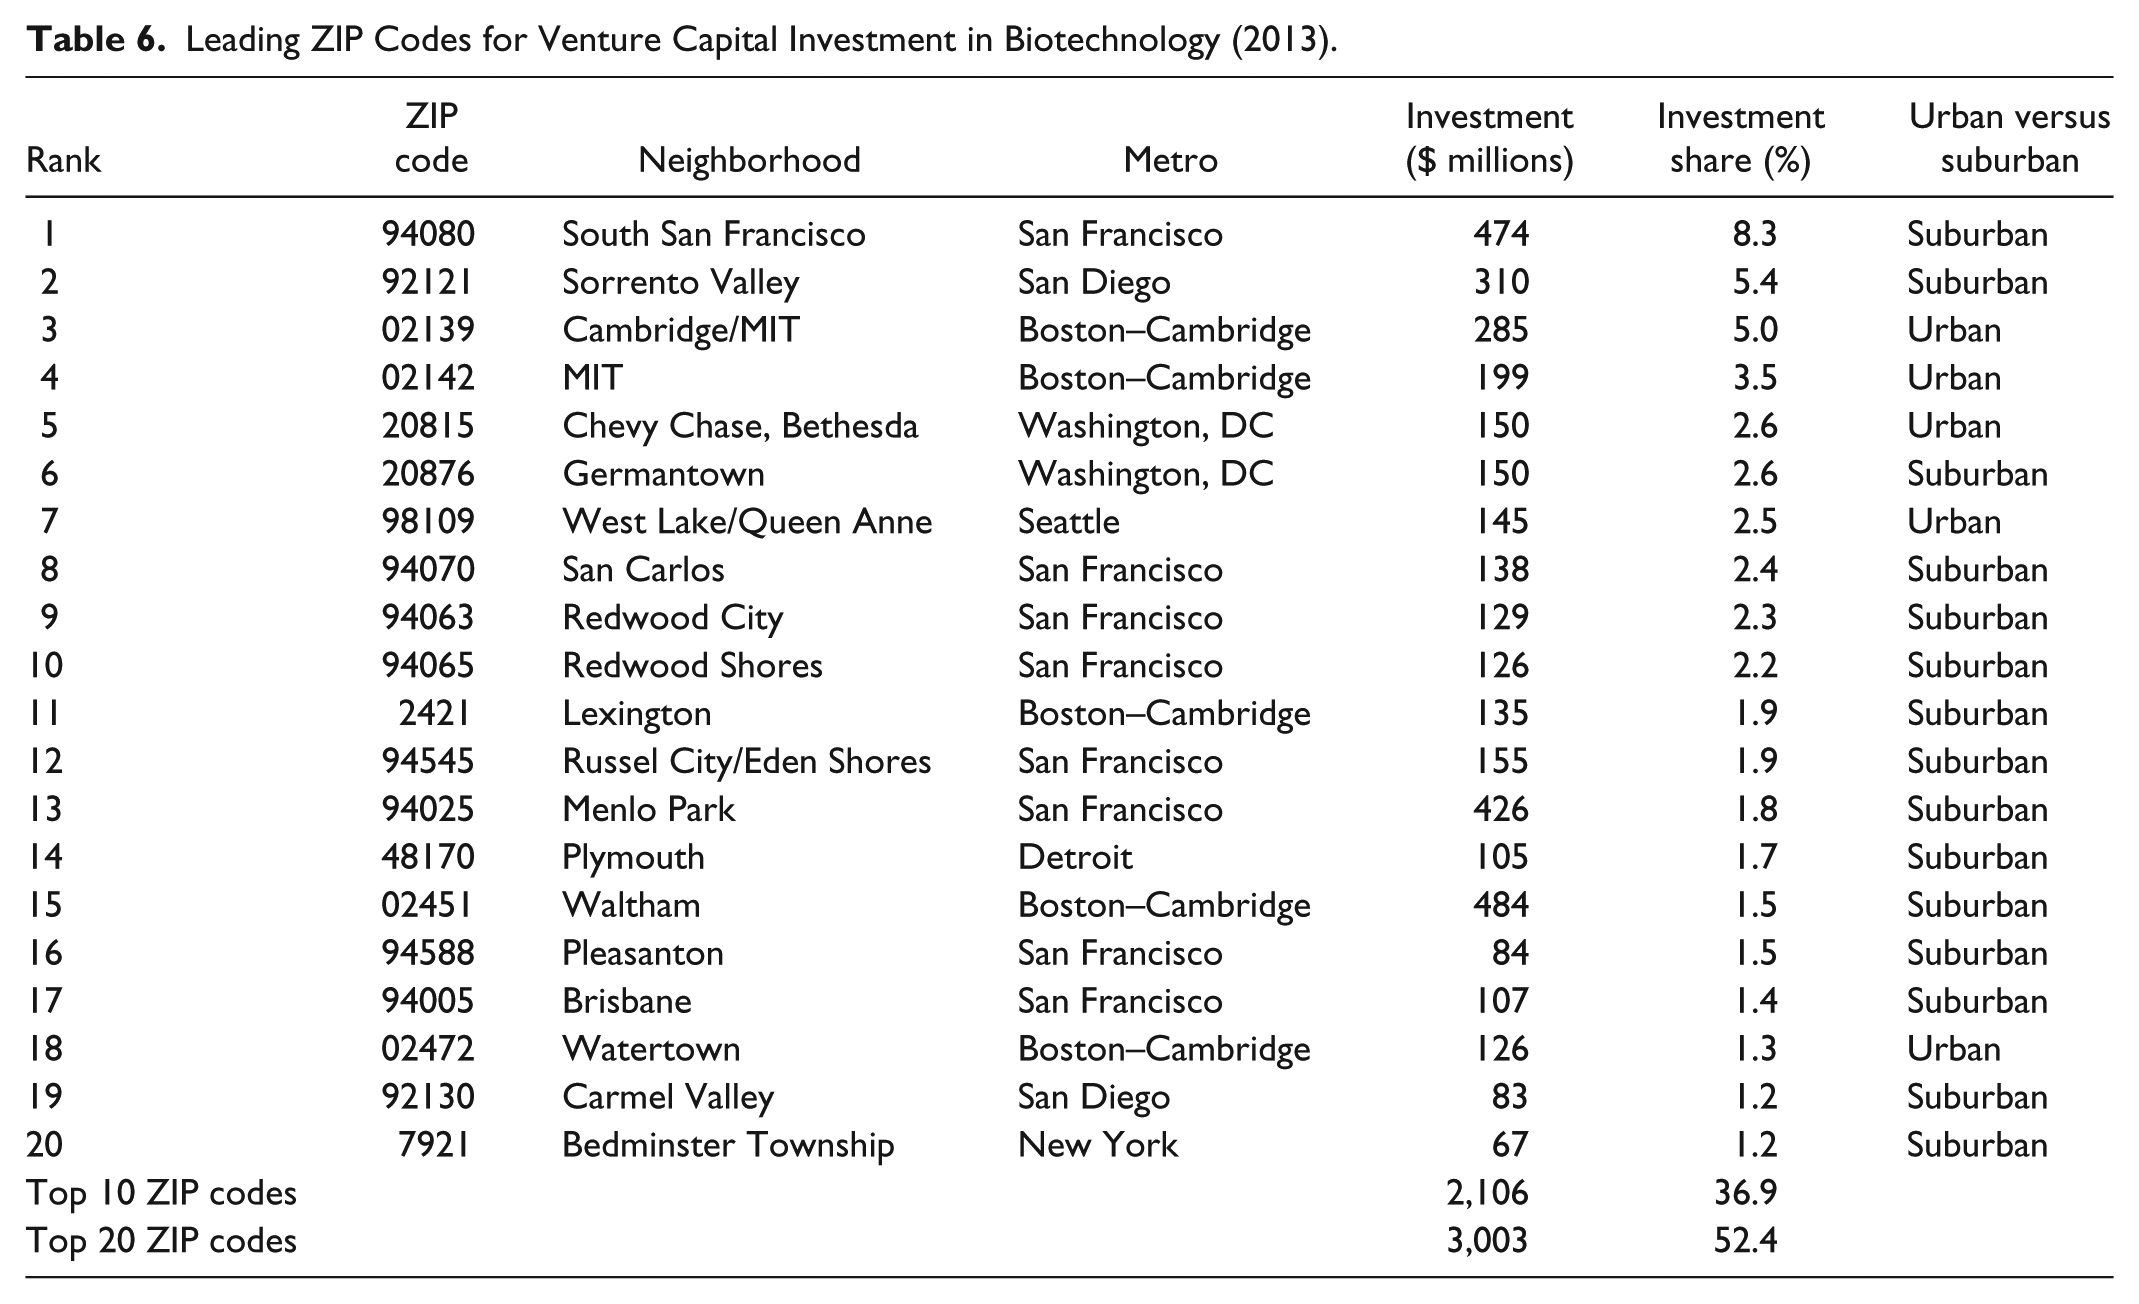
Topping the list is south San Francisco (94080) with 8.3% of total biotechnology investment. Next in line is Sorrento Valley in San Diego (92121) with 5.4%. Two ZIP codes near MIT (02139 and 02142) and Chevy Chase/Bethesda (20815), close to the National Institutes of Health, round out the top five. Eight of the top 20 ZIP codes are in San Francisco, five in Boston (Cambridge, MIT, Lexington, Waltham, and Watertown), two in San Diego (Sorrento Valley and Carmel Valley), and two in Washington, D.C. (Chevy Chase/Bethesda and Georgetown). Seattle (West Lake/Queen Anne), Detroit (Plymouth), and New York (Bedminster Township) have one each. Venture investment in biotechnology is often located near universities or research centers, notably around MIT, the University of California, San Francisco, and the University of California, San Diego. Unlike the software sector, venture capital investment in biotechnology is more suburban with 15 of the top 20 ZIP codes suburban.
Venture capital investment in biotechnology is also concentrated at the ZIP code level. The top 10 ZIP codes account for or more than one third (36.9%) of total investment, while the top 20 accounts for more than 50% (52.4%).
Media and Entertainment
Media and entertainment is the third leading sector for venture capital investment, accounting for almost 10% of the total. Venture capital investment in media and entertainment is heavily concentrated in the Bay area, greater Los Angeles, and New York with smaller clusters around, Seattle, Denver, and Miami (see Figure 2). Table 7 lists the 20 leading ZIP-code-level microclusters for venture investment in media and entertainment.
Leading ZIP Codes for Venture Capital Investment in Media and Entertainment (2013).

At the top of the list is south of Market/Mission District (94103) with 15.3% of all media and entertainment investment. Rounding out the top five are Rincon Hill (94105), Soho/NYU (10012), Potrero Hill/Dogpatch/South Beach (94107), and Palo Alto (94301). Six of the top 20 ZIP codes are in San Francisco, four are in New York, three in San Jose, and two in Los Angeles. The top 20 also includes single ZIP codes in Santa Barbara, Miami, Denver, Washington, D.C., and Seattle. Venture capital in media and entertainment is largely going to urban ZIP codes with 17 out of the top 20 ZIP codes urban. The three suburban ZIP codes are in Santa Barbara, Los Angeles, and San Jose.
Venture capital investment in media and entertainment is again highly concentrated. The top 10 ZIP codes account for nearly half (45.9%) of all investment, while the top 20 accounts for nearly two thirds (62.9%).
Medical Devices and Equipment
Medical devices and equipment is the fourth leading sector for venture capital investment, with $2.4 billion, which is roughly 7% of the total. Clusters of venture capital with investment in medical devices and equipment can be seen in the San Francisco Bay area, Boston, southern California, New York, Minneapolis–St. Paul, and North Carolina. Clustering in the Bay area is less pronounced here than in other industries. Table 8 lists the 20 leading ZIP-code-level microclusters for investment in medical devices and equipment.
Leading ZIP Codes for Venture Capital Investment in Medical Devices and Equipment (2013).
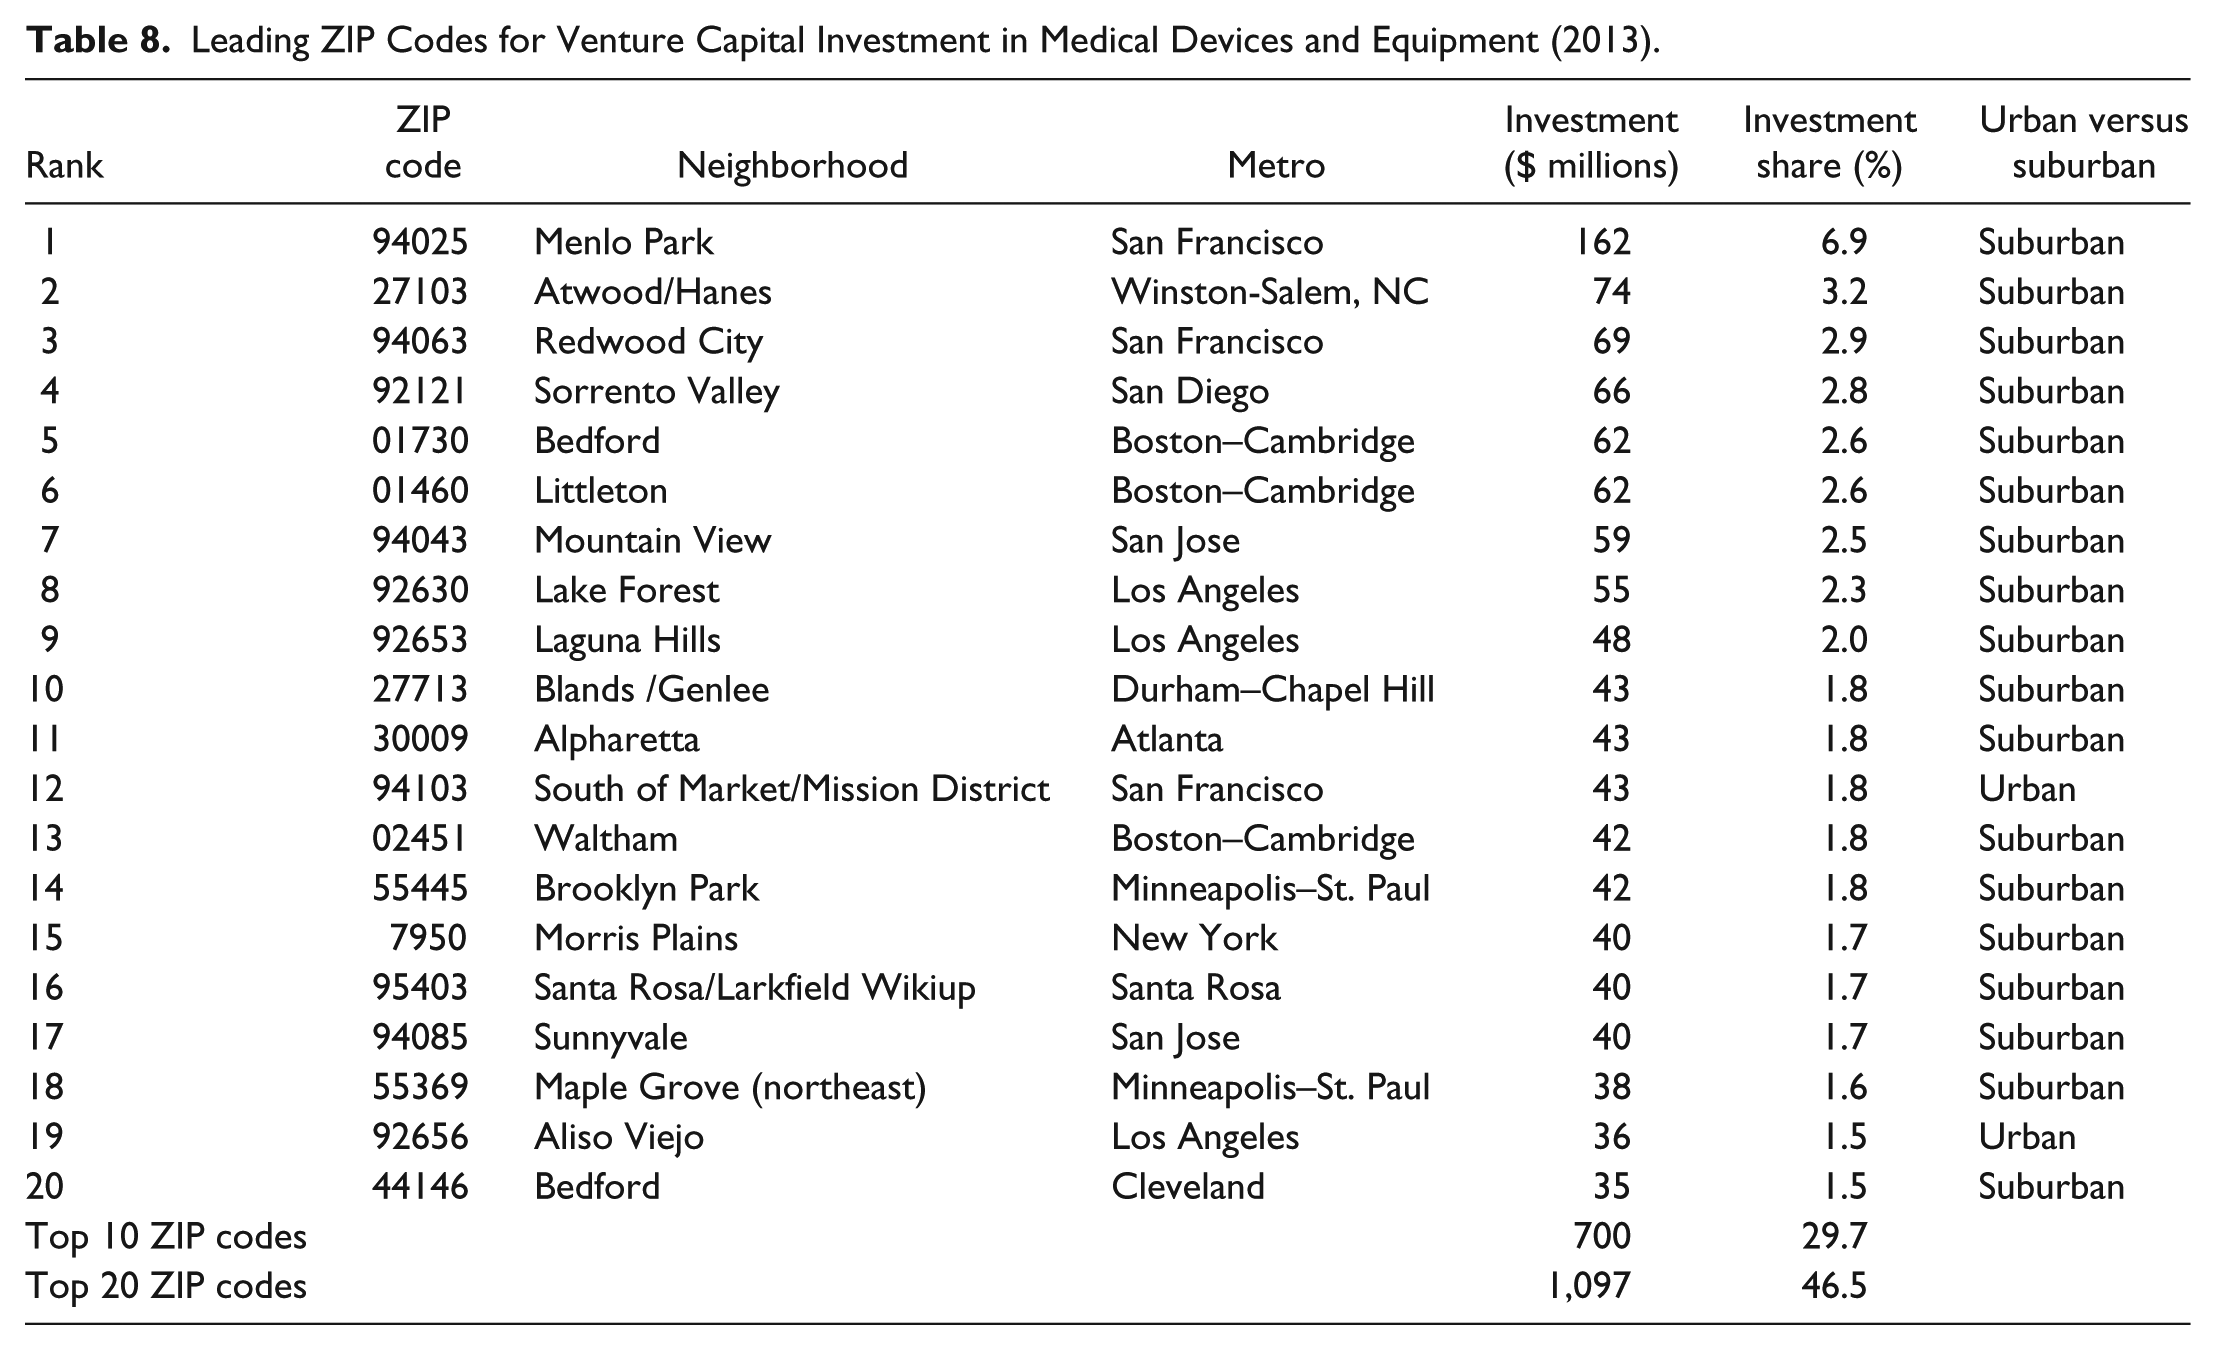
San Francisco’s Menlo Park (94025) leads with 6.9% of total venture capital in medical devices and equipment, more than twice the investment in the next ZIP code. Venture capital investment in medical devices and equipment is less clustered or urban than other sectors. Still, three metros each boast three of the top 20 ZIP codes: Boston–Cambridge, San Francisco, and Los Angeles, with two ZIP codes each in San Jose and Minneapolis–St. Paul. There is one ZIP code each in greater New York, San Diego, Atlanta, Durham–Chapel Hill, Winston-Salem, Santa Rosa, and Cleveland. Of the five industry sectors, the medical devices and equipment sector has the largest number of its top 20 ZIP codes in the suburbs. Eighteen of the top 20 are in the suburbs with only urban ZIP codes in south of Market/Mission District in San Francisco and Aliso Viejo in Los Angeles.
The top 10 ZIP codes for investment in medical devices and equipment account for nearly 30% of total venture investment, while the top 20 ZIP codes account for nearly half (46.5%).
Information Technology
Information technology is the fifth leading sector for venture capital investment with $2 billion or 6% of all U.S. venture investment. Figure 2 shows significant clusters in and around the San Francisco Bay area, the Boston–New York–Washington corridor, Seattle, and Atlanta. Table 9 lists the top 20 ZIP codes for venture investment in information technology services.
Leading ZIP Codes for Venture Capital Investment in Information Technology (2013).
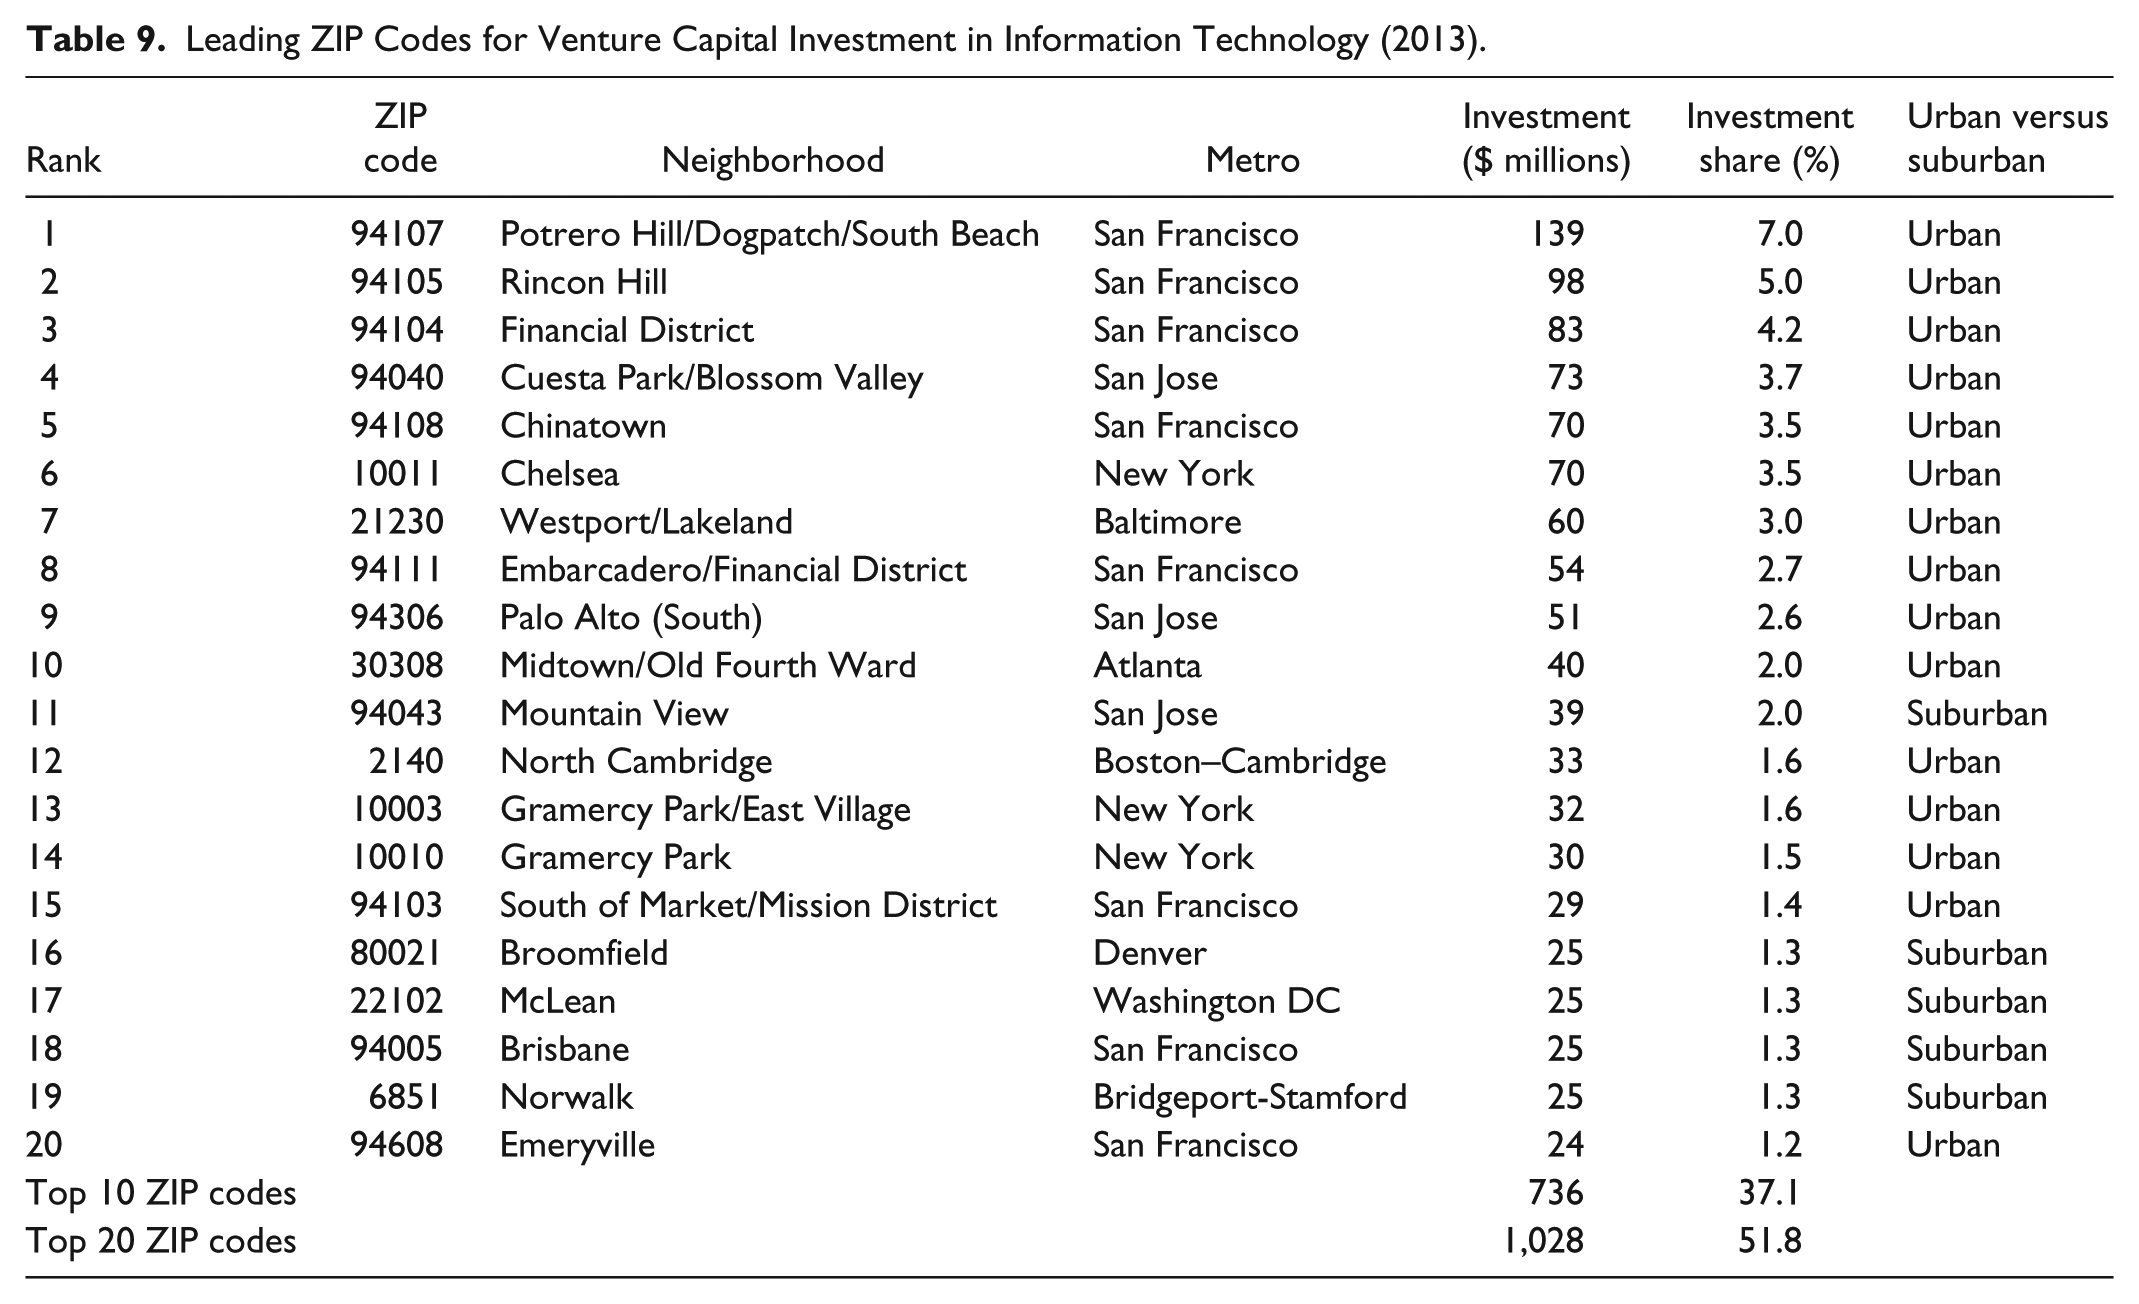
Three San Francisco ZIP codes top the list: Potrero Hill/Dogpatch/South Beach (94107), Rincon Hill (94105), and the Financial District (94104). With eight of the top 20 ZIP codes, investment is clustered in San Francisco with a further three in nearby San Jose. New York also has three ZIP codes in the top 20: Chelsea, Gramercy Park/East Village, and Gramercy Park. Boston, Washington, DC, Baltimore, Atlanta, Denver, and Bridgeport, CT each claim a single ZIP code. The top 10 ZIP codes in the information technology sector are all urban, with a total of 15 of the top 20 urban.
Venture capital investment in information technology services is again concentrated. Overall, the top 10 ZIP codes account for 37.1% of venture investment, while the top 20 accounts for more than half (51.8%) of all venture investment in this sector.
Across these five industry sectors, we find venture-capital-backed start-ups to be largely concentrated in the San Francisco Bay area, along the Boston–New York–Washington corridor, and to a lesser extent in Los Angeles and southern California. There are, however, key locational differences across the five sectors. Each sector has distinct clusters outside these three major locations. The medical device industry, for example, is less clustered in the Bay area than the others, with clusters in Minneapolis–St. Paul and the North Carolina Research Triangle. The biotech industry had additional clusters in Seattle and greater Detroit. The software industry has other clusters in Seattle, Portland, the North Carolina Research Triangle, and Austin. The media and entertainment sector has distinct clusters in Seattle, Denver, and Miami.
Moreover, we find the more localized microclustering of venture-capital-backed start-ups to vary by industry or technology field, with media and entertainment start-ups and information technology start-ups more likely in urban ZIP codes; software start-ups are equally located between urban and suburban ZIP codes, and biotech and medical start-ups more likely to be located around universities and laboratories with capabilities in related scientific and technological fields.
Mapping Clusters of Venture Capital Investment in Three Leading Regions
We now take a closer look at the distribution of venture-capital-backed start-up activity in the three city-regions or metro areas that attract the greatest amount of venture capital investment: the San Francisco Bay area (including the combined San Francisco and San Jose metros), the New York and the Boston–Cambridge metro areas. Together, these three metros attracted roughly 60% of all venture capital invested across the United States. Figure 3 maps venture capital investment by urban versus suburban ZIP code within these three metros. The dots indicate the size of venture capital investment and the shading indicates the degree of urbanity. Figure 4 overlays venture capital investment on the share of commuters who walk, bike, or take transit to work compared with those who drove to work in these three metros in 2013.
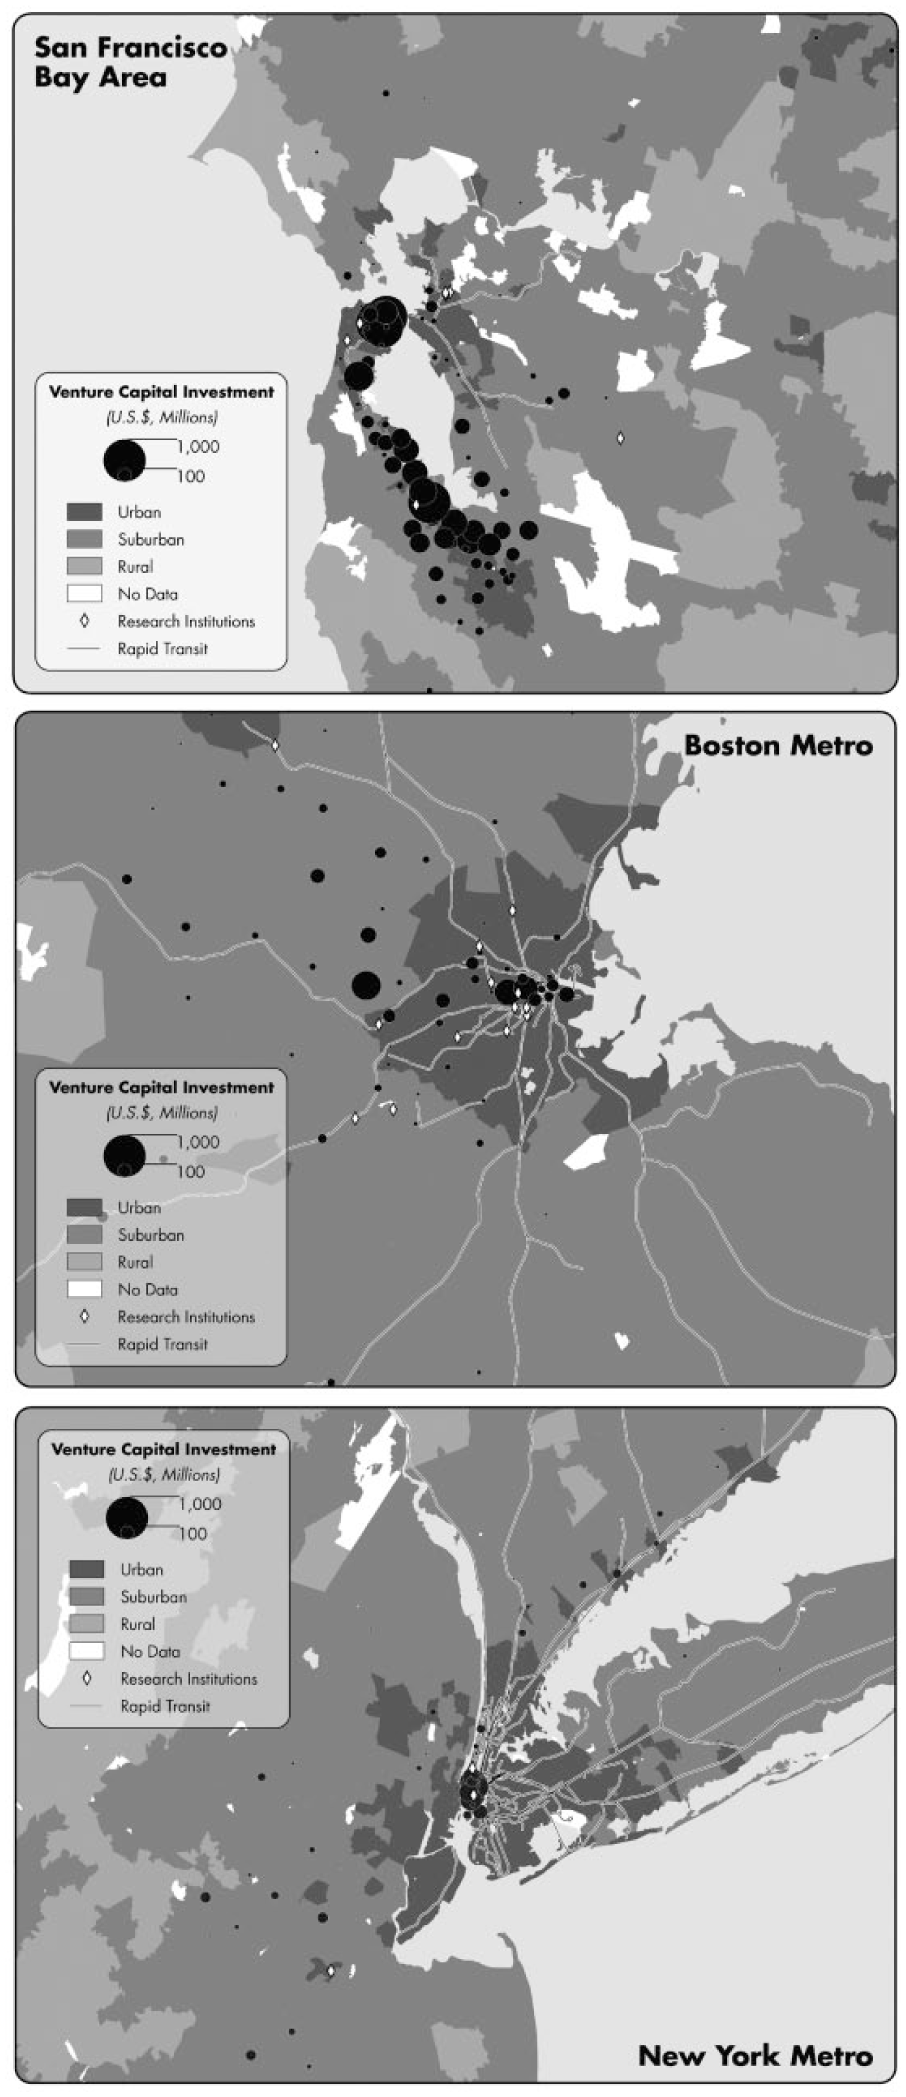
Urban versus suburban investment in San Francisco Bay area, Boston–Cambridge metro, and New York metro (2013).
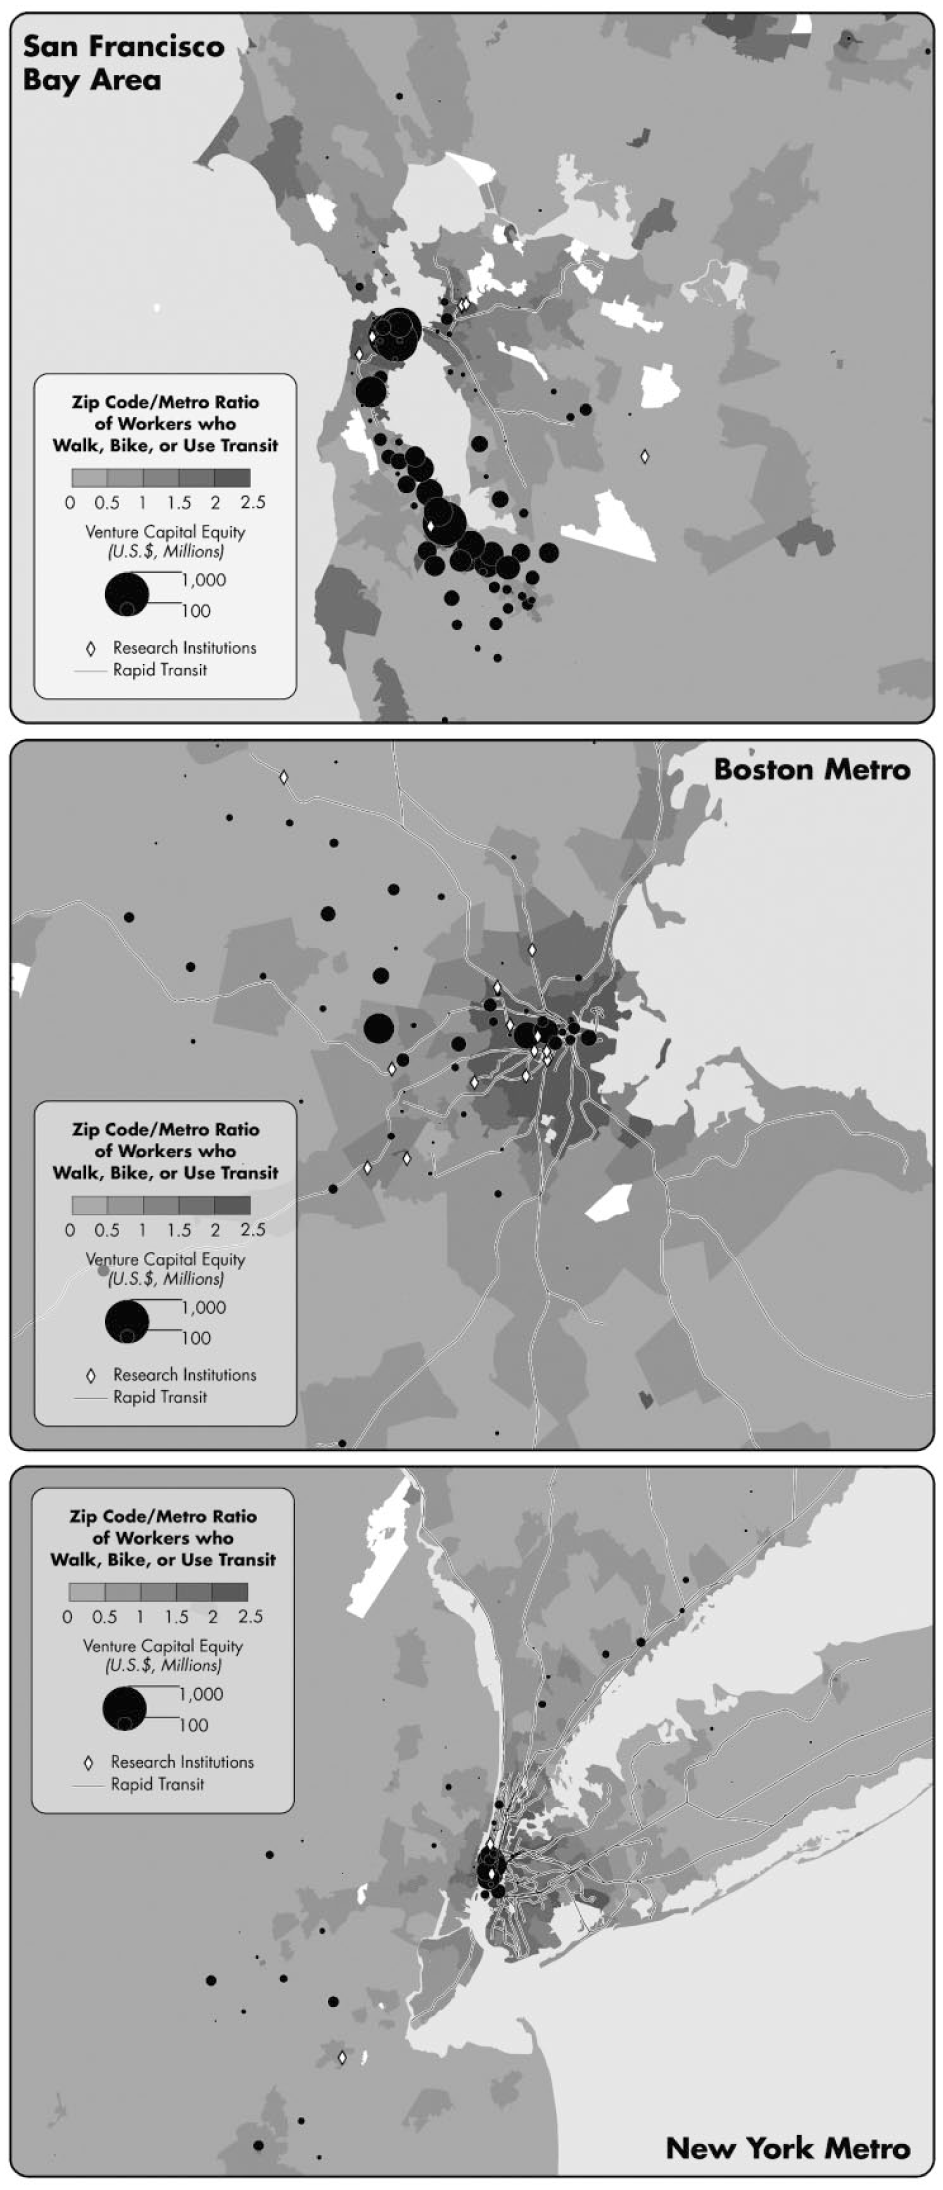
Venture investment by percent who walk, bike, or use transit in San Francisco Bay area, Boston–Cambridge metro, and New York metro (2013).
New York has the highest share of commuters who walk, bike, or take transit to work at 36.7%, followed by Boston at 18.3%, and the San Francisco Bay area at 14.6%. On the maps, the share of commuters who walk, bike, or take transit is shown as a ratio of the share in the ZIP code to the metro average. The maps also identify the location of major transit lines and major research universities.
Venture Capital Investment Patterns in the San Francisco Bay Area
The San Francisco Bay area, which spans both greater San Francisco and Silicon Valley, is the nation’s leading center of venture capital investment, attracting 40% of the total investment. Overall, nearly 60% (59.2 %) of all venture capital investment in the Bay area is in urban ZIP codes, while 40.7% is in suburban areas. The figures are even higher for venture-capital-backed start-up companies: 63.3% of these companies are in urban ZIP codes compared with 36.3% in suburban areas.
Figure 3 shows the large cluster of venture capital investment in and around downtown San Francisco. Looking south, there are also a series of circles stretching through Silicon Valley, particularly in and around denser areas like Palo Alto, close to Stanford University. Figure 4 shows large clusters of venture capital investment in dense, transit-served ZIP codes in and around downtown San Francisco and in close proximity to the University of California at San Francisco, a leading center for biotechnology research. The large microcluster of venture capital investment in Silicon Valley is in Palo Alto in close proximity to Stanford University, the densest and most urban area of the Silicon Valley.
Across the Bay area, including Silicon Valley, nearly 20% (19.9%) of commuters in ZIP codes that receive venture capital investment walk, bike, or take transit to work compared with 8.4% for the nation. Nearly 40% (37%) of all venture capital investment in the Bay area goes to ZIP codes where more than 30% of commuters walk, bike, or use transit. Furthermore, venture capital investment is heavily concentrated in downtown San Francisco, largely in ZIP codes where more than 50% of commuters walk, bike, or take transit to work.
Table 10 shows how the top 20 ZIP codes for venture capital investment in the Bay area stack up on both measures: the degree to which they are urban or suburban and the share of commuters who walk, bike, or use transit to get to work. It also compares their density measured as households per square mile. Eleven of the top 20 ZIP codes are urban, while nine are suburban. Of the top 10, six are urban, while four are suburban. Six of the top 20 have densities greater than 5,000 people per square mile. The two leading ZIP codes—each of which attracts more than a billion dollars in venture capital investment—have densities of roughly 10,000 people per square mile. Roughly 60% of commuters walk, bike, or take transit to work in these ZIP codes. While suburban nerdistans still play a role in Bay area venture capital and start-up activity, the preponderance of it is in urban ZIP codes in the city itself.
Leading Bay Area ZIP Codes for Venture Capital Investment (2013).
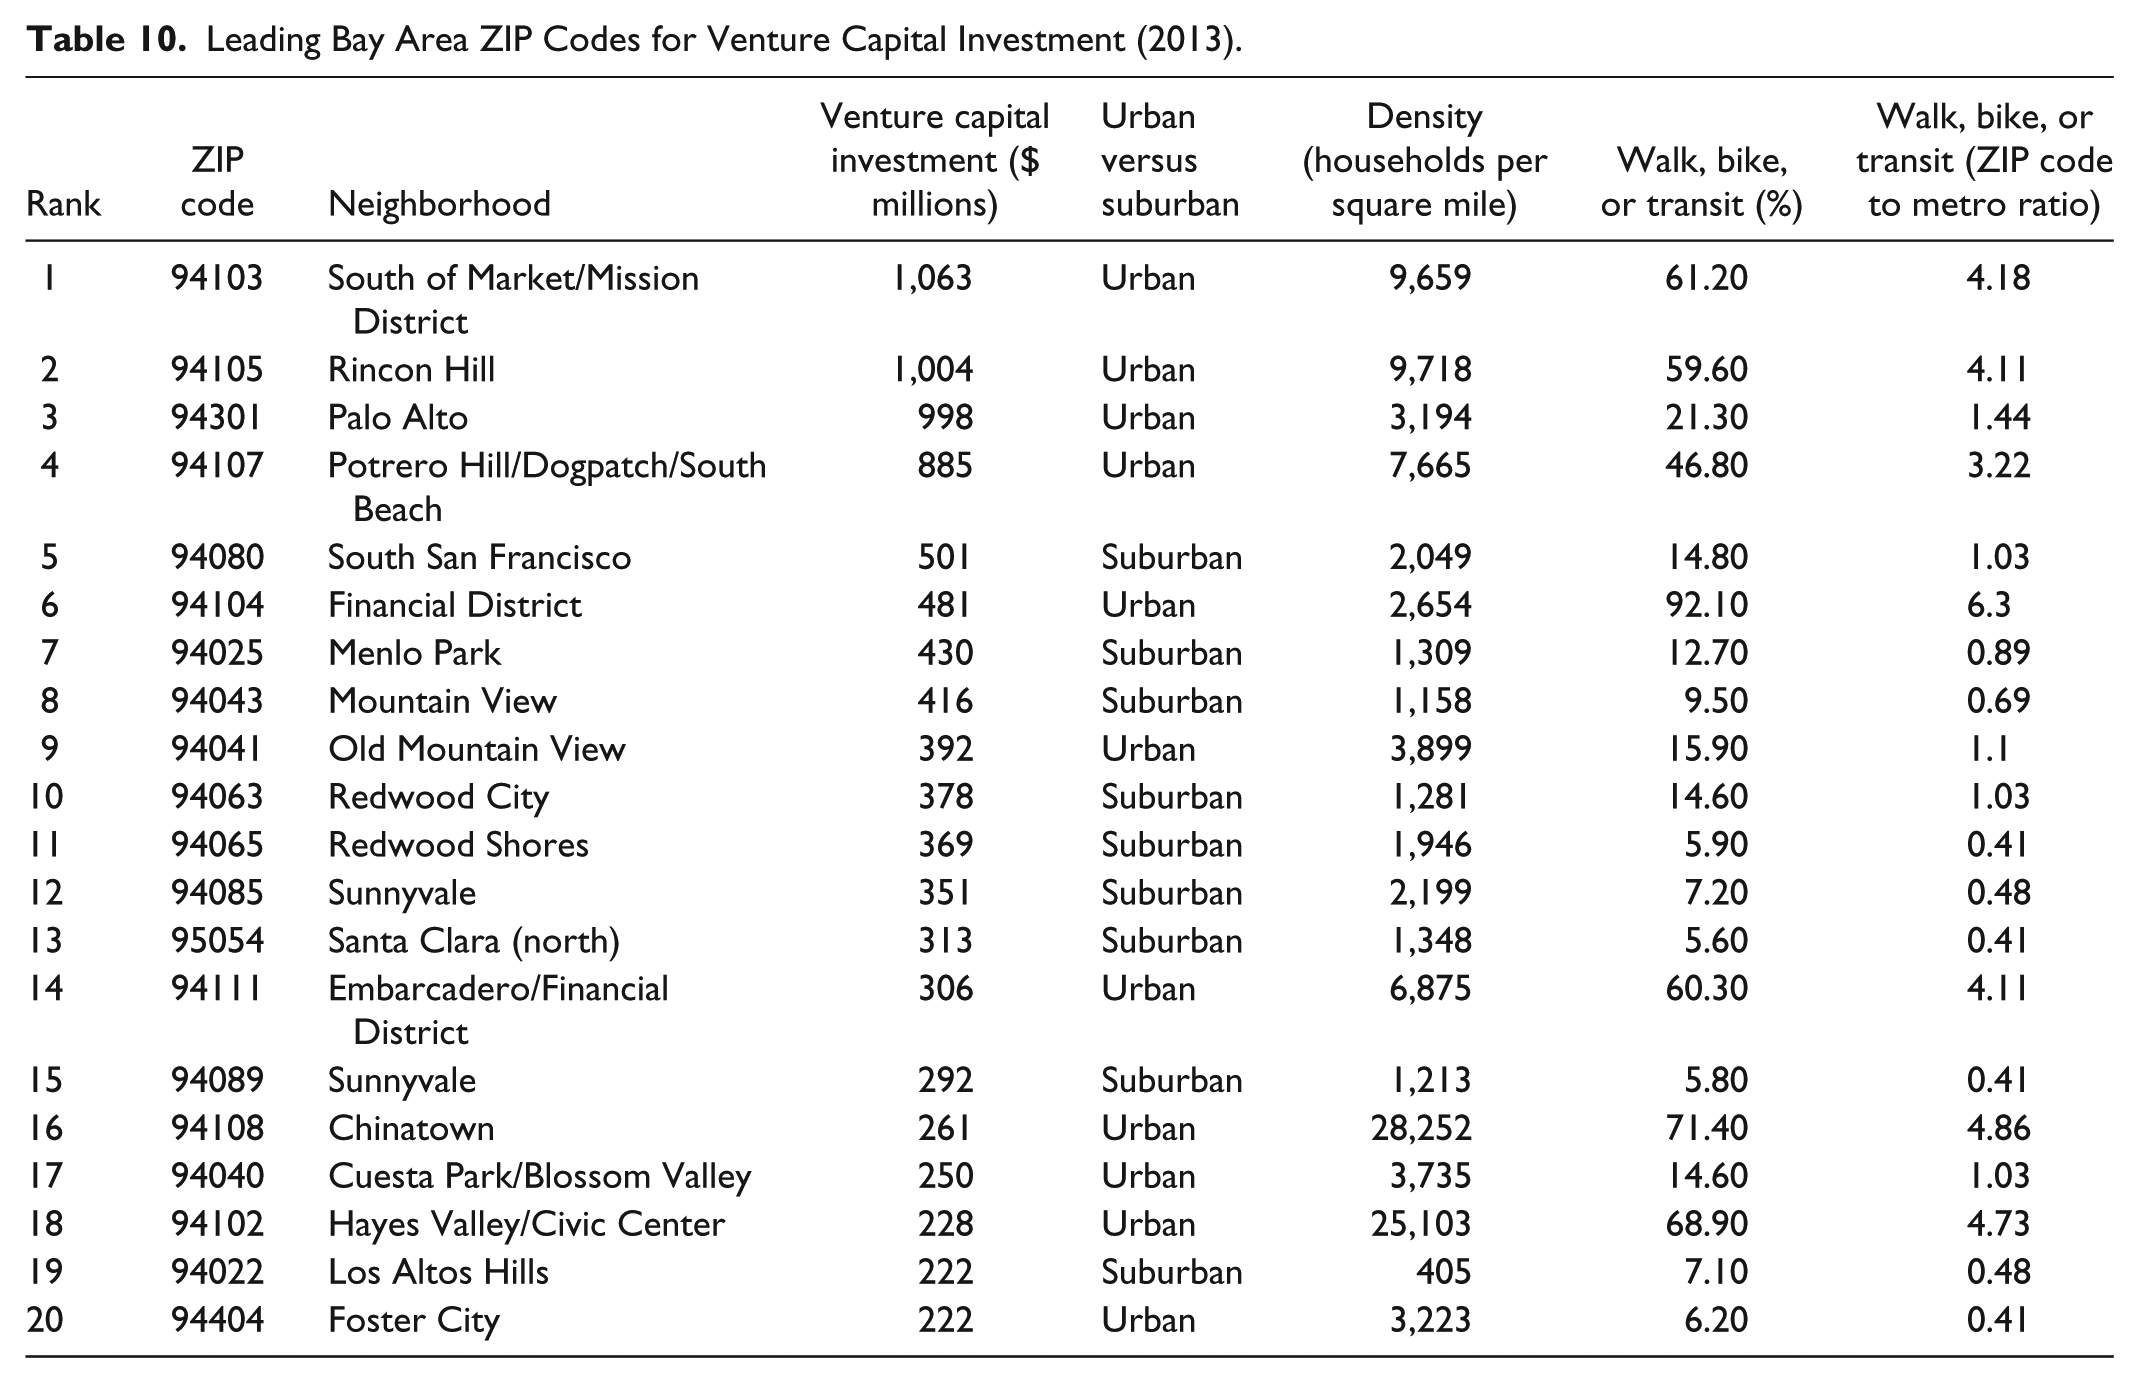
Table 11 compares the characteristics of leading ZIP codes for venture capital investment in these three leading city-regions with all ZIP codes in these regions. Across all venture capital investment ZIP codes in the region, the average density is 3,875 households, which is considerably more than the ZIP codes without venture-capital-backed start-ups (1,434 households per square mile).
Characteristics of Venture Capital Investment ZIP Codes of San Francisco Bay Area, Boston Metro, and New York Metro (2013).

Here, we find a somewhat bifurcated pattern of urban-oriented versus suburban-oriented venture capital investment. The top 10 ZIP codes for venture-capital-backed start-ups are rather dense, having an average density of 4,259 households per square mile. But these 10 ZIP codes are split between very dense and less dense locations. The top five ZIP codes have an average density of 6,457 households per square mile, while ZIP codes that rank 6th through 10th have an average density of 2,060 households per square mile.
The same pattern can be seen in commuting patterns. In the top 10 venture capital investment ZIP codes roughly 35% of commuters walk, bike, or take transit to work, as compared with 20% for all venture capital investment ZIP codes, 14.6 for all ZIP codes, and just 12.6% for ZIP codes without venture capital investment. In the top five venture capital investment ZIP codes, 41% walk, bike, or take transit to work compared with 29% in ZIP codes 6 through 10.
Venture Capital Investment Patterns in the Boston–Cambridge Metro
With its cluster of leading edge universities and research institutions, the Boston–Cambridge metro was the nation’s second leading center of venture capital investment at the time of this study, attracting $3.4 billion, roughly 10% of the national total.
Figure 3 shows the significant clusters of venture capital investment in and around downtown Boston and in nearby Cambridge where MIT and Harvard are located. More than half (54%) of all investment is in urban ZIP codes compared with 46% in suburban ZIP codes. Furthermore, 61% of start-ups receiving venture capital investment are in urban ZIP codes, compared with 39.0% in the suburbs. Figure 4 shows the concentration of venture capital investment in walkable, transit-served ZIP codes stretching along the transit lines that serve both Boston and Cambridge and into the suburbs. Overall, 22.9% of commuters in ZIP codes that receive venture capital walk, bike, or take transit to work. That compares with 13.8% for the metro and 8.4% for the nation. Roughly 40% of all venture investment and 48% of venture-capital-backed start-ups in the Boston–Cambridge metro is found in ZIP codes where more than half of commuters walk, bike, or take transit to work.
Table 12 shows how the top 20 ZIP codes for venture capital investment in the Boston–Cambridge metro stack up on both measures: the degree to which they are urban or suburban and the share of commuters who walk, bike, or use transit to get to work. It also compares their density measured as households per square mile. Of the top 20 ZIP codes, 11 are in urban areas while 9 are in suburban locations. And of the top 10, seven are in urban areas. These urban ZIP codes are in downtown Boston, or in Cambridge near MIT and Harvard. Eight of the top 20 ZIP codes have densities that exceed 5,000 people per square mile. In six of the top 20 ZIP codes, more than 60% of residents walk, bike, or take transit to work. In eight of the top 20, more than 50% also walk, bike, or use transit to get to work. While suburban nerdistans still play a role in venture capital investment and start-up activity in greater Boston, there is also clear evidence of an urban presence here. More than half of all venture capital goes to relatively dense urban ZIP codes, and 40% of it flows to ZIP codes where more than half of commuters walk, bike, or use transit to get to work.
Leading Boston–Cambridge ZIP Codes for Venture Capital Investment (2013).

We next compare the characteristics of leading ZIP codes for venture capital investment in the Boston–Cambridge metro with all ZIP codes in the region (see Table 11). Across all venture capital investment ZIP codes in the region, the average density is 3,669 households per square mile, considerably more than all ZIP codes (1,957 households per square mile) and ZIP codes without venture capital investment (1,240 households per square mile). The top 10 ZIP codes for venture-capital-backed investment have an even higher average density of 4,980 households per square mile, which is quite urban. We also see something of a bifurcation in these leading ZIP codes for venture-capital-backed start-ups, though it is different from what we find for the San Francisco Bay area. The top five ZIP codes for venture-capital–backed start-ups in the Boston–Cambridge metro have an average density of 3,575, which is considerably less than the average density of 6,385 households per square mile for ZIP codes 6 through10. Still in both cases, these groups of ZIP codes are well above the threshold for urban density.
A similar pattern can be seen in how workers commute. In the top five venture capital investment ZIP codes 40.3 % of commuters walk, bike, or take transit to work, in the top 10, 35.0% do so, and in all venture capital investment ZIP codes 22.9 % do, compared with 13.8 % for all ZIP codes and just 10.9 % for ZIP codes without venture capital investment.
Venture Capital Investment Patterns in the New York Metro
The greater New York metro was the nation’s third leading center of venture capital investment at the time of our research, attracting $3.2 billion in venture capital investment, roughly 10% of the total investment. Figure 3 shows the substantial clustering of venture capital investment and start-up activity for lower Manhattan. Overall, more than 80% of venture capital investment (83% of investment dollars and 84.4% of start-up companies) in greater New York is in urban areas.
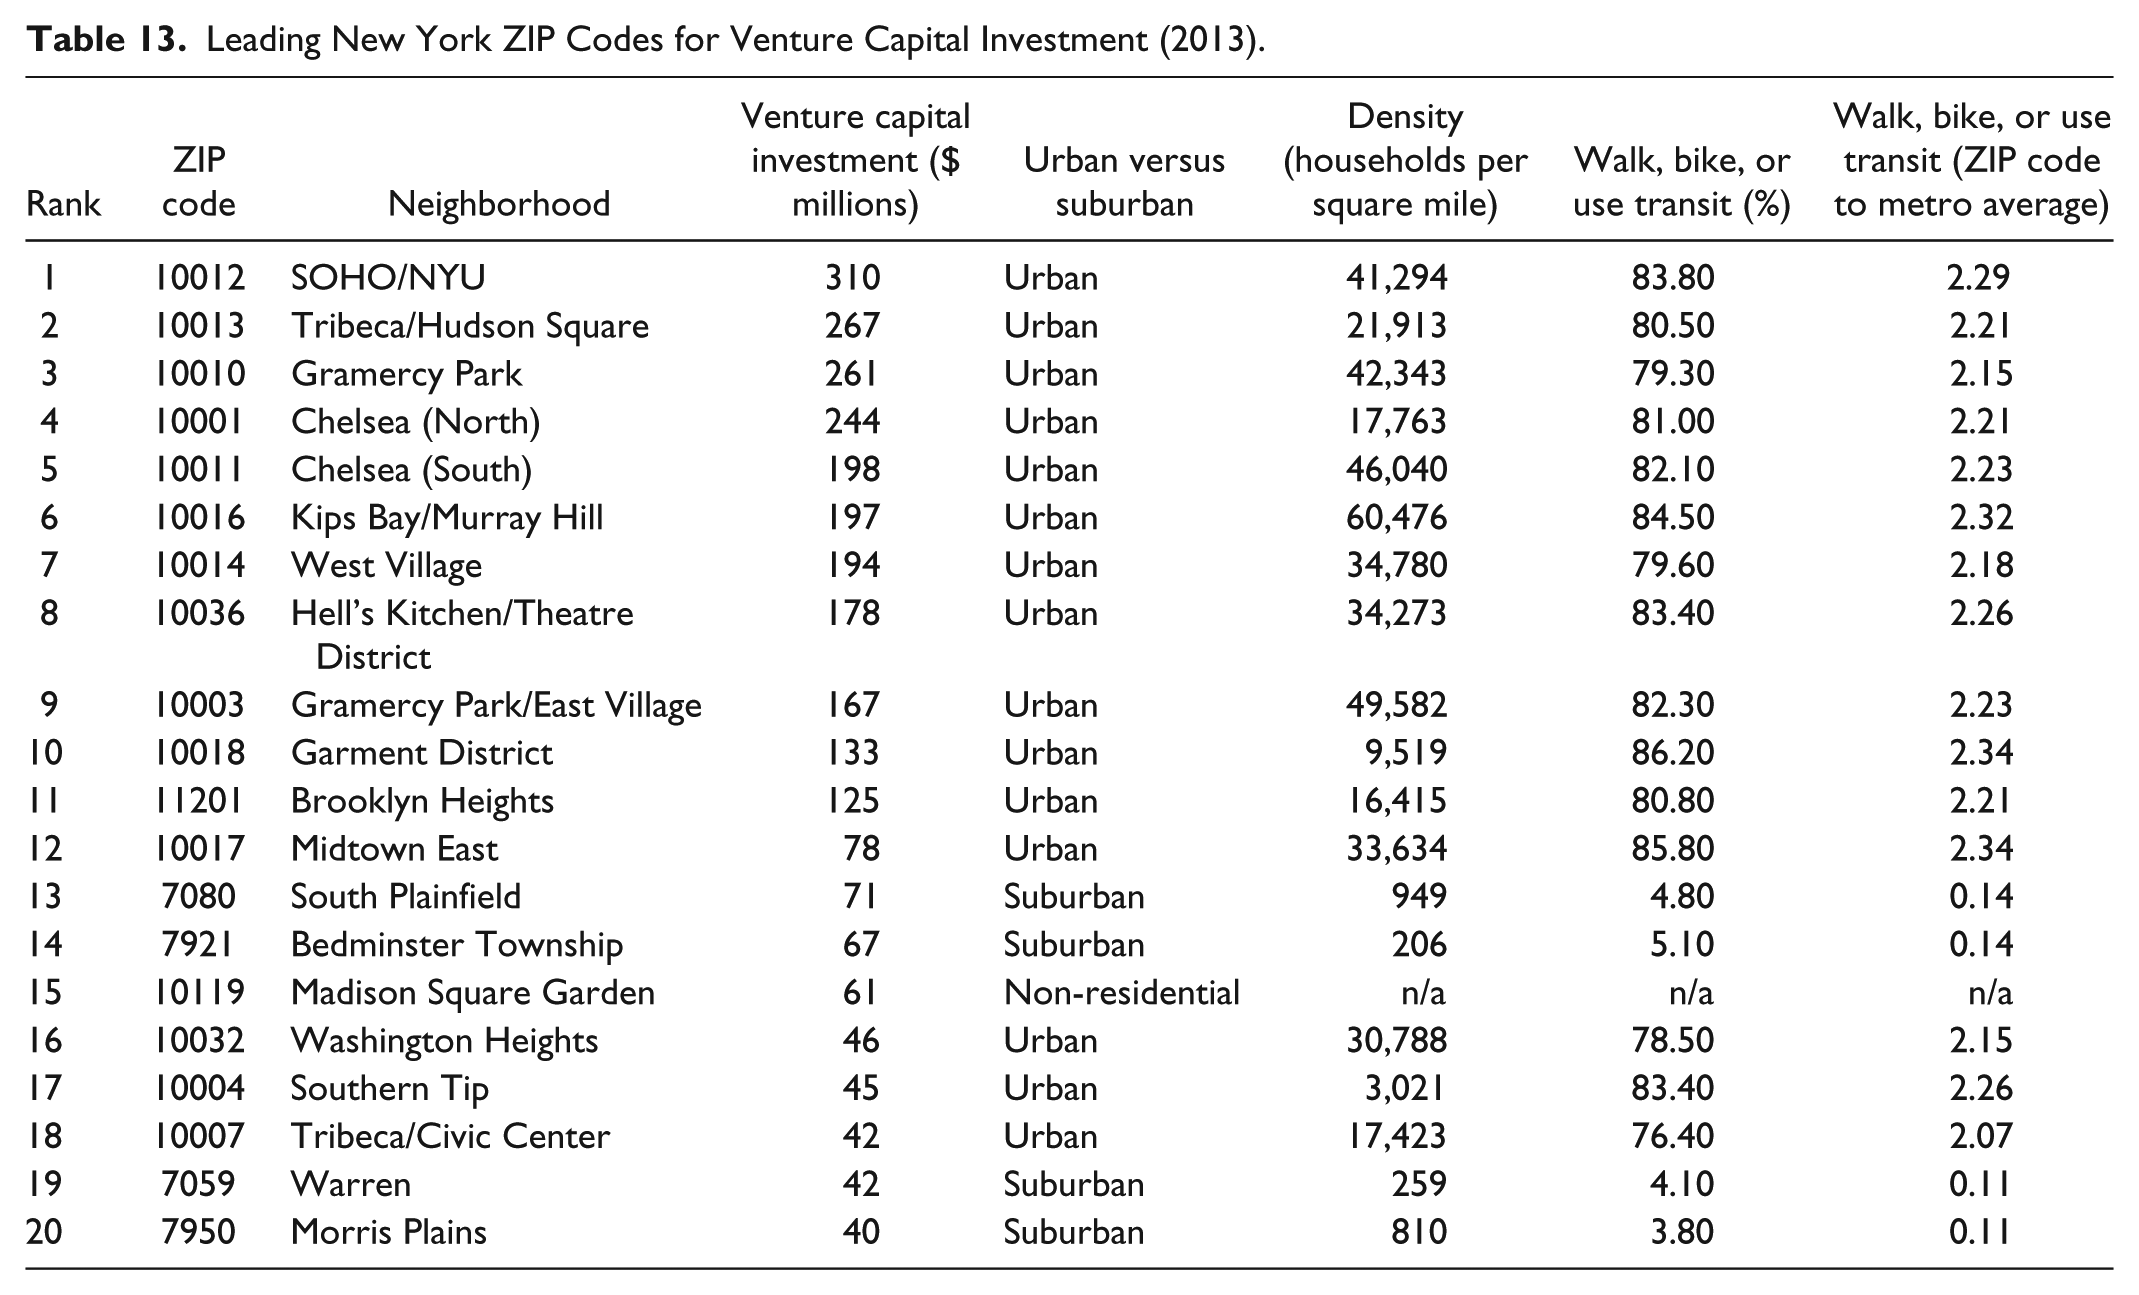
Figure 4 reinforces this, showing the enormous concentration of venture capital investment and start-up activity in walkable and transit-served areas of lower Manhattan. More than half (56.9%) of commuters in ZIP codes that receive venture capital investment walk, bike, or take transit to work, as compared with 36.7% of commuters in the New York metro area and just 8.4% across the nation. Here, it is worth noting that venture capital investment in New York is in several downtown ZIP codes where commute-to-work data are not available as the ZIP codes are entirely nonresidential. More than 80% of all venture capital investment in greater New York is in ZIP codes where more than half of commuters walk, bike, or take transit to work. A few smaller, suburban clusters of venture capital investment are found mainly in suburbs that are connected to the city by rail transit: South Plainfield, New Jersey, Bedminster Township, Morris Plains, and Scarsdale, New York.
Table 13 shows how the top 20 ZIP codes for venture capital investment in greater New York stack up on both measures: the degree to which they are urban or suburban and the share of commuters who walk, bike, or use transit to get to work. It also compares their household density. Three quarters of the top 20 New York ZIP codes that received venture capital are classified as urban. Furthermore, the entire top 10 is made up of ZIP codes in lower Manhattan—one of the densest areas in the metro and in the United States. Approximately 82% or so of commuters in this area of the city walk, bike, or use transit to get to work, compared with 37% for the metro and just 8.4% for the nation. Furthermore, 13 of the top 20 ZIP codes for venture capital investment have densities greater than 10,000 households per square mile and 9 of them have densities greater than 30,000 people per square mile.
Leading New York ZIP Codes for Venture Capital Investment (2013).
We now compare the leading ZIP codes for venture capital investment in the New York metro with all ZIP codes in the region (see Table 11). Venture-capital-backed start-ups in New York are in much denser ZIP codes across the board. This reflects the basic fact that New York is a very dense city and it provides additional evidence for the urban location of venture-capital-backed start-ups. The top 10 ZIP codes for venture-capital-backed start-ups in New York average density of 35,798 households per square mile—far denser than in San Francisco or Boston–Cambridge. We also do not see any bifurcation in the location of venture-capital-backed start-up locations in New York. Across all venture capital investment ZIP codes in the region, the average density is 15,377 households per square mile, considerably more than the density of all ZIP codes (5,049 households per square mile) and of ZIP codes without venture capital investment (3,887 households per square mile).
The same pattern can be seen in how people commute to work. In the top 5 and 10 venture capital investment ZIP codes, more than 80% of commuters walk, bike, or take transit to work, and in all venture capital investment ZIP codes more than half do so, compared with roughly 37% for all ZIP codes and 21.6% for those without venture capital investment.
Conclusion
This research has examined the geography of venture capital investment at the ZIP code level. It goes beyond previous research, which due to data limitations has focused on broad metro-level clusters of venture capital investment and start-up activity. It tested three hypotheses informed by urban theory in the manner of Marshall (1890), Jacobs (1970), and others (Feldman & Audretsch, 1999; Feldman & Florida, 1994; Florida, 2002; Glaeser, 2011; Porter, 1990; 2006; Saxenian, 1994):
that venture-capital-backed start-up activity will be concentrated in tight neighborhood-level microclusters
that venture-capital-backed start-up activity will gravitate to denser, more urban, transit-served locations, and
that the location of venture-capital–backed start-ups will vary by industry with start-ups in fields like biotechnology being more closely located to university sources of knowledge and talent, while start-ups in fields like media and entertainment would be more likely to locate in urban centers around established companies, end users, and talent in those fields.
Using new detailed ZIP code data on venture capital investment in start-ups, we find considerable evidence in support of all three.
On the first hypothesis, we find venture-capital-backed start-ups to be concentrated in distinct ZIP-code-level microclusters. Overall, the top 20 ZIP codes for venture-capital-backed start-ups account for nearly one third of the total, while just the top 10 accounts for one fifth of the total. Furthermore, less than 1% of ZIP codes attracted more than $100 million in venture capital investment, and these ZIP codes account for more than 60% of all venture capital investment. Conversely, less than 4% of all ZIP codes received any venture capital investment; of these, roughly half attracted less than $5 million each.
Regarding the second hypothesis, we find considerable evidence that these microclusters of venture-capital-backed start-ups are in the denser urban ZIP codes. While previous research identified a preponderance of venture capital investment in suburban areas like California’s Silicon Valley, the Route 128 suburbs outside Boston, and other similar areas (Florida & Kenney, 1988a, 1988b), our research finds the majority of venture capital investment and start-up activity to be in urban ZIP codes. Across the nation, more than half of all venture capital investment is in urban ZIP codes. In New York, more than 80% of venture investment is located in urban ZIP codes; in the San Francisco Bay area it is roughly 60% and in the Boston–Cambridge area more than half is in urban ZIP codes.
We also find substantial microclusters of venture-capital-backed start-ups in ZIP codes where a large share of commuters walk, bike, or take transit to work—another key indicator of urbanity. Across all ZIP codes receiving venture capital investment, nearly twice as large a share of commuters walk, bike, or use transit to get to work, as compared with the national average. More than a quarter of venture capital investment is concentrated in ZIP codes where more than half of all commuters walk, bike, or take transit, and one third is in ZIP codes where more than 30% do. In the San Francisco Bay area, New York, and greater Boston, more than 45% of venture capital investment is in ZIP codes where more than 30% of commuters walk, bike, or use transit to get to work; nearly 40% is in ZIP codes where more than 50% of commuters do so.
On the third hypothesis, we find evidence that the clustering of venture-capital-backed start-ups varies by industry or type of technology. In particular, we find that venture-capital-backed start-ups in fields such as media and entertainment are more likely to cluster in urban areas that provide access to both talent and end users, while biotech and related start-ups and venture capital investment tend to cluster near universities and laboratories, which are key source of knowledge and talent in these technology fields.
This urban orientation of venture-capital-backed start-ups does not necessarily mean the end of suburban-oriented high-technology industry. What appears to be emerging is a new and more refined spatial division of labor where, on one hand, new venture-capital-backed start-ups are launched and incubated in cities, while on the other hand, large established companies with large numbers of employees and large footprints (e.g., Apple, Google, or Facebook) operate in suburban areas where larger plots of land are available.
Our research has several implications for urban economic development policy. First, it suggests that cities and urban areas are increasingly attractive locations for venture capital investment and high-tech start-ups. There is little reason for urban centers that are attracting venture-capital-backed start-ups to provide incentives to tech companies, as the market for these locations appears to be working well enough on its own. In fact, in the top three locations for venture-capital-backed start-ups that we have examined here—the San Francisco Bay area, Boston–Cambridge, and New York City—it is increasingly the case that venture-capital-backed start-ups and high-tech industry and the talented, skilled, and educated individuals who work for them are being blamed for at least some part of the rising housing prices, decreasing housing affordability, increasing gentrification, and growing inequality of these places (Florida, 2017). Local residents have launched protests against the company-run shuttle busses that move high-tech workers between the urban areas of San Francisco to Silicon Valley; there was even an unsuccessful ballot measure in San Francisco to limit or ban start-ups and tech companies from locating in certain urban areas. In these leading high-tech locations, it may make sense for high tech companies to work together with local governments to find solutions to affordable and workforce housing, to upgrade low-paid service jobs, particularly those in high-tech companies such as cafeteria workers or workers in on-site day care or health care centers, and also for high-tech companies to consider how to invest in broader public strategies for improving transit for all residents as opposed to operating their own shuttle busses.
Second, our findings on the urban orientation of venture-capital-backed start-ups suggests that traditional suburban high-tech regions may find growing pressure to become more urban themselves. Google, for example, is currently working with the city of San Jose to create a new, more urbanized corporate complex on 20-plus acres near a transit hub in downtown San Jose. More suburban high-tech locations may be well served to consider increasing density and encourage mixed-used development, and where and when possible, to add or extend transit to these more suburban corporate complexes.
Our research further suggests that the gap in terms of geographic inequality across the “have” and “have-not” regions for high-tech development and venture-capital-backed investment is quite large. Despite claims of the so-called “rise of the rest” - the spreading of start-ups and high-tech clusters to new locations in the Rust Belt or Sun Belt - the location of venture-capital-backed start-ups remains incredibly concentrated and uneven. As we have seen, less than 4% of all ZIP codes receive any venture capital investment; the top 20 ZIP codes for venture investment—mainly in the Bay area, Boston–Cambridge, and New York City—account for nearly one third of the total, while just the top 10 accounts for roughly one fifth. The locations outside these areas that are generating venture-capital-backed start-ups tend to do so either because they have developed capabilities and talent in particular high-tech niches, or because they have leading research universities or knowledge institutions that are important to key high-tech fields. A case in point would be Pittsburgh’s capabilities in self-driving cars that stems from long-running investment in computer science, software engineering, robotics, and self-driving vehicles at Carnegie Mellon University. Here it is important to note that it is very hard to predict the rise of such commercial industry sectors and niches in advance. Few would have predicted that Carnegie Mellon’s investments in robotics and self-driving vehicles mainly for military use back in the 1970s and 1980s would ultimately emerge in two or three future decades. For cities and regions, it makes much more sense to invest in broad-based capabilities in their universities, and to make the relatively small-scale investments in quality of place that can improve their capacities to attract and retain talent than to waste money on attracting corporation relocations or creating venture capital funds of their own.
Our research is just a start; much more research on the locational concentration and clustering of high-tech industries and venture-capital–backed start-ups is needed. For one, better time series data are needed to tease out the broader trends in the location of high-tech start-ups over time and space. We could benefit from more detailed research on the stage of venture capital investment, and by looking more deeply into the different locational patterns of such investment by industry and technology field. In addition, more detailed statistical research could be done on the factors that influence and shape the geography of venture capital investment that can better parse the effects of density, university, talent, and other factors.
Our research has focused on venture-capital-backed start-ups in the United States, but venture capital investment is growing around the world, especially in cities and urban centers like London, Paris, Tel Aviv, Toronto, Amsterdam, Berlin, Bangalore, and Shanghai, to name just a few global centers of venture-capital-backed start-ups (Florida & King, 2016b). Future research should focus on the global geography of venture capital investment, looking at which places are becoming significant global centers for venture capital and high-tech development and why, and also the extent to which this global pattern reflects the kind of urban orientation we have examined here. This is especially useful given the recent policy posture of the Trump Administration to limit and restrict immigration, including of the high-tech scientific talent that has played such a significant role in U.S. high-tech industry and venture-capital-backed start-ups. Could it be that these restrictions may lead to the further development of high-tech clusters in global cities and regions outside the United States, undercutting a key source of U.S. innovation and competitive advantage? Could it be that the “next Silicon Valley” may more likely reside outside the United States than within it? These are important questions for both research and public policy.
Part of the problem in answering these questions and conducting research in this area is the availability of data. The data on venture-capital-backed start-ups are in the hands of several private providers who charge relatively high fees to access it. We were fortunate to have institutional funding to purchase access to these data, but the costs of access to venture capital data may limit the ability of other researchers to access these data. The entire research area could benefit immensely if private providers would make their data freely available to academic researchers to be used for the purposes of academic research (as opposed to commercial use).
Ultimately, we hope that our research and findings on the geographic clustering and urban orientation of start-up activity and venture capital investment spurs further research on these patterns and their implications for economic development and local, state, and national public policy.
Footnotes
Acknowledgements
We thank Isabel Ritchie, Ian Gormely, and Taylor Blake for research assistance.
Declaration of Conflicting Interests
The authors declared no potential conflicts of interest with respect to the research, authorship, and/or publication of this article.
Funding
The authors disclosed receipt of the following financial support for the research, authorship, and/or publication of this article: The authors thank the Martin Prosperity Institute and funding from the Rotman family for supporting this research.