
Abstract
Economic developers are well aware of the live-work-play dynamic affecting downtowns and many other major employment centers across the country. This study of 90 employment centers, including 48 central business districts, offers a rigorous analysis of this dynamic. The authors first present a definition of vibrancy and show its connections to the fields of urban economics, economic geography, and urban design. Second, the authors offer face-valid measures of vibrancy that practitioners can replicate in their jurisdictions. Most important, the authors show that vibrancy is an important factor influencing economic development. The vibrancy index measured with 2010 data is positively associated with subsequent employment growth, property inventory expansion (tax base), and income growth. Economic developers should consider becoming more involved in downtown redevelopment by finding effective ways to serve economic-base companies and emerging entrepreneurial firms. As a result, major employment centers could become more productive and innovative places.
Although suburban growth continues, many central cities in the United States have made strong comebacks, especially since the start of the New Millennium. Mixed-use and multiuse projects adapting existing buildings or reusing infill sites have redeveloped formerly stagnant places (e.g., see the discussion of Seattle in DeLisle and Grissom [2011]). Furthermore, recent suburban growth has not been ubiquitous; new investment appears to favor suburban employment centers that offer urban amenities (Malizia, 2014, 2016).
Vibrancy is the term used here to characterize places that are becoming increasingly urban. Specifically, vibrancy increases as the place becomes denser, more compact, more diverse, more connected, and more walkable. Residential areas become more vibrant when they add employment and urban amenities, but the focus here is on major employment nodes. Vibrant centers are employment nodes that are functioning effectively as work-play-live locations (Kapp & Malizia, 2015).
This study explores the features of vibrancy in detail and presents the typology used to categorize 90 major employment centers across the United States. Each center receives a vibrancy score based on urban form-related measures of density, compactness, diversity, connectivity, and walkable urban design. Measures of employment, investment, and income (and poverty) indicate the economic outcomes of these centers. 1 The empirical analysis relates vibrancy measured in 2010 to subsequent growth and development after 2010. The basic hypothesis is that higher levels of vibrancy are associated with stronger subsequent economic outcomes ceteris paribus.
The next section summarizes relevant literature, followed by the conceptual framework. We then introduce the physical characteristics of vibrant centers, the selected measures, and data sources, followed by a discussion of downtowns and the other types of employment centers under study. We close with our specific hypotheses about anticipated economic outcomes and the results of the empirical tests, and then suggest how economic developers can use the findings in practice.
Relevant Literature
Beginning in the 1920s and accelerating after World War II, development primarily occurred in the suburbs. From the 1970s through the 1990s, most central cities languished, declining relatively or absolutely, as their suburbs prospered. Could suburban areas continue to grow independent of the central city? Some claimed that suburbs and exurbs no longer relied on their central city in meaningful ways (Fishman, 1987; Garreau, 1991; Hartschorn & Muller, 1989; Hicks, 1987). Downtowns were becoming just one of several employment nodes in the regional economy competing with suburban nodes for jobs and investment (Bingham & Kimble, 1995). Other research pointed to continued interdependence between central cities and their suburbs (Persky, Sclar, & Wiewel, 1991; Voith, 1993). Wolman, Cook, and Hill (1994) examined the evidence used in this debate and pointed out that it was more associational than causal. In a review of the arguments and the evidence, Ihlanfeldt (1995) concluded that downtowns continue to be important, although noting the lack of strong empirical findings that central cities remain the engines of growth in the metropolitan economy.
Hill, Wolman, and Ford (1995) conducted careful analyses of this interdependence by examining what they called the suburban dependence hypothesis. They reviewed work that found positive associations between changes in suburban and central city income, which had concluded that larger income disparities caused greater decline in overall metro-area growth (Blair & Zhang, 1994; Ledebur & Barnes, 1992, 1993; Savitch, Collins, Sanders, & Markum, 1993; Voith, 1992). Hill et al. (1995) argued that the direction of causality was more likely to run from metro areas to their constituent central cities and suburbs since each metro area approximates a coherent labor market area. Subsequent articles examined in more detail the central city revival (Furdell, Wolman, & Hill, 2005; Hill & Brennan, 2005).
The foundation for the central city and downtown comeback that began in the mid-1990s consisted of three factors. Better public safety and declining crime rates established the potential for change (Sharkey, 2018). Second, major public infrastructure improvements made private investment more attractive. Third, public–private partnerships flourished, which led to redevelopment projects across the country, first in Gateway cities and then in secondary cities. Although demographic factors like millennial preferences for live-work-play and affluent empty nesters received most of the press, the economic factors were more important. These included the long-term decline in goods production (manufacturing), the rise of business services (professional, informational, technical, medical, and educational) as export sectors, and the growing importance of research-driven, knowledge-based, and talent-dependent businesses. These economic factors elevated the importance of agglomeration economies only available in urban areas. Furthermore, minimal technical requirements made it feasible to redevelop older buildings in cities. To operate profitably, all many companies needed was a dry box with electrical outlets.
Generally, inner cities have gained employment as well as residences since 2000 (Hartley, Kaza, & Lester, 2016). As a result, many urban centers have become very valuable and therefore more expensive. Cheap housing and commercial space are in short supply. Many cities are becoming less diverse and more unequal (Florida, 2017).
Conceptual Framework
For at least the past 40 years, critics of low-density suburbanization in the United States, labeled “urban sprawl,” have documented the substantial social, environmental, fiscal, and public health costs. What has received less attention are the negative economic impacts of low-density suburban development. This departure from historic patterns of compact grid-oriented urban form have dramatically increased spatial transaction costs (Brown, 2016). Relatedly, urban sprawl is negatively associated with labor productivity. The negative relationship remains strong after accounting for differences in metro area size as well as variation within industries and occupations (Fallah, Partridge, & Olfert, 2011). Equally important has been the decline in entrepreneurship and innovation in the United States since the late 1970s (Decker, Haltiwanger, Jarmin, & Miranda, 2015). For example, the U.S. Census Bureau reports that the ratio of new firms to all firms dropped from 1 in 8 in 1980 to 1 in 12 in 2015. Although many factors are responsible for the decline in entrepreneurship, single use, autodependent suburbia appears to be one of the culprits. Face-to-face interaction and informal “collisions” that build tacit knowledge and generate knowledge spillovers in viable innovation ecosystems are much harder to realize in suburban autodominated employment centers (Audretsch & Feldman, 2004; Audretsch, Hulsbeck, & Lehmann, 2012; Fritsch, 2002).
The most straightforward way to inform the analysis at hand is to recall the city’s most basic economic function. Firms experiencing internal economies of scale co-locate in cities to exploit external economies available there, namely agglomeration economies. These cost-reducing economies are primarily realized in production, complementary labor supply, and larger market size. Alfred Marshall (1898) presented the benefits of co-location as sharing pools of highly skilled labor, customers, specialized suppliers, and ancillary services as well as exploiting larger markets. Other work discussed aspects of localization and urbanization economies in detail (Duranton & Kerr, 2015; Hindle, 2010; Puga, 2010; Sedgley & Elmslie, 2004). Niu, Ding, and Knaap (2015), for example, found that localization and urbanization economies have positive impacts on the Baltimore–Washington regional economy. In general, agglomeration economies are expected to induce lower costs, higher productivity, and more innovation (Acs & Armington, 2006; Kaldor, 1970; Mills, 1980).
The physical form of the city supports agglomeration economies in many ways. Density is so fundamental that it is incorporated in the very definition of an urban area. Density is augmented by compact urban form achieved by clustering development in the downtown core. Diversity of buildings and land uses support different economic activities, some basic/export, and others locally oriented. Diversity of activities exists even in cities with one narrow specialization because of differences in the mix of occupations and types of work done there. Density and diversity are necessary conditions for problem solving and knowledge spillovers, but connectivity is the sufficient condition that enables high levels of interaction in dense urban space. Connectivity is enhanced when walking and public transit are the dominant transportation modes (see Ewing, Meakins, Bjarnson, & Hilton, 2011; J. Jacobs, 1961; Malizia & Song, 2015; Speck, 2012; Talen, 2012; Zyscovich, 2008).
Although these spatial economic relationships are rather obvious, the urban economics literature and the literature on urban form, urban design, and place making are not well connected. The spatial focus of urban economics is on transport costs and rents, land use allocation, real property development, and such (McDonald, 1997). Considerations of urban form traditionally emphasize livability, enjoyment, safety, and “the look of cities” (Carmona, Heath, Oc, & Tiesdell, 2010; A. Jacobs, 1993; Lynch, 1960).
One notable exception is the work of Jane Jacobs. J. Jacobs (1961, p. 151) discussed “city districts,” where work is the prominent activity. She sets out four conditions required for viable city life. She emphasized the diversity of functions that generate activity over many hours of the day, the mixing of workplaces and residences, buildings of different ages affording different levels of economic productivity, and short blocks that foster access for greater interaction.
J. Jacobs (1969) presented her theory of urban economic development based on the creation of new work that leads to import replacement. She contrasted orderly Manchester to messy Birmingham, England to distinguish clearly an efficient urban economy from an innovative one. The urban form championed by her nemesis, Robert Moses, and most urban planners and architects in the 1950s and 1960s, advocated superblocks, high-rise towers, multilane highways, and such. These features created an urban form that reflected the image of efficient Manchester. The function of the city was to accommodate physical expansion and economic growth. On the other hand, Jacob’s image of the city was to nurture an innovative urban economy, one that generated self-sustaining economic development. This innovative economy would flourish in dense, diverse, connected urban places like Birmingham. Clearly, the combination of market forces and public policy that generated the suburban pattern of development in the United States during the post-World War II period supported economic growth far more than economic development.
Since publication of his influential book, The Rise of the Creative Class, Richard Florida (2002) has encouraged local economic developers to broaden their focus beyond employment and industrial clusters to people and place. He calls for considering the “people climate” as well as the business climate. In his Economic Development Quarterly research commentary, he summarized creative class theory and discussed the major debates and policy implications (Florida, 2014). His original explanatory framework of talent, technology, and tolerance did not offer specific place-oriented insights. More recently, Florida has added a “fourth T—Territorial Assets” that underscores the importance of place. Our concept of vibrancy is consistent with Florida’s notions of place, and the measures of vibrancy examined in this article flesh out specific territorial assets of employment centers. Employment centers with high-vibrancy scores should have members of the super creative class over represented.
Duranton and Puga’s (2004) microlevel examination of agglomeration economies is very helpful because their framework connects easily to urban form and the built environment. In essence, agglomeration economies involve sharing, matching, and learning. Physical density enables sharing in many different spheres. One example is the sharing of public infrastructure, facilities, and services. Compact development fosters greater efficiency in the provision of local public goods. Matching occurs between producers and consumers, employers and employees, buyers and suppliers, entrepreneurs and angel investors. The diversity and size of the urban area increase the quantity and quality of matching opportunities. For example, as labor markets become “thick,” more efficient and timely matching is likely. Employers, in a timely manner, can find qualified employees, replace them when they leave, and, as technology changes, attract employees with different skill sets. Although formal learning occurs in urban educational institutions, more important is the informal learning that arises every day from work experience (tacit knowledge). Urban connectivity enables productive “collisions” and interactions among workers that give rise to innovative ideas.
Sharing, matching, and learning occur in cities where productive space, social space, and space for circulation comprise what Duranton and Puga (2004) called the “urban land nexus.” Given the limited supply of land, conflicting and competing activities generate negative externalities. Trade-offs between agglomeration economies and urban crowding arise. In general, the physical form of employment centers enhances or erodes the strength of the city’s economic base. We contend that as vibrancy increases, agglomeration economies are more likely to be realized and diseconomies are more likely to be mitigated.
For the past 30 years, New Urbanism and Smart Growth have offered alternative urban design ideas to accommodate development projects that would have more positive environmental, fiscal, equity, and public health outcomes (Calthorpe, 2001; Clifton, Ewing, Knaap, & Song, 2008; Katz, 1994; Song & Knaap, 2004; Talen, 2005). One major focus has been on the urban form–transportation relationship. Clustered mixed-use and multiuse development tends to reduce vehicle miles traveled and the associated negative environmental impacts (Ewing & Cervero, 2010). The degree of social attachment and level of activity occurring in the public realm are the most important concerns. Gerrit Knaap and Emily Talen (2005) offer a concise explanation distinguishing Smart Growth from New Urbanism in a special issue of the International Regional Science Review devoted to this topic.
This analysis of vibrant centers is different from the focus of New Urbanism and Smart Growth in three ways. First, the activities of greatest importance in employment nodes are work, learning, and convening (vs. live or play). Second, the relevant aspect of social attachment is job satisfaction because it can increase productivity and reduce employee turnover. Third, instead of livability, the most important concerns are the positive associations between vibrant centers and agglomeration economies, economic growth, and economic development.
Vibrancy Measures
The urban design literature informs the measures of the vibrancy incorporated in this analysis (e.g., Bohl, 2002; Crankshaw, 2009; Ewing & Clemente, 2013; Paumier, 2004). In 2014, the U.S. Environmental Protection Agency (EPA) made available its Smart Location Database (SLD) to encourage research on urban form (Ramsey & Bell, 2014). The EPA embraced Cevero and Ewing’s “five Ds”—density, diversity, destination accessibility, distance to transit, and design as the framework for the SLD. The SLD has over 60 measures at the census block-group level for all U.S. urban areas.
The framework used here is primarily oriented to vibrancy in workplaces (employment centers). The three dimensions of vibrancy are density, diversity, and connectivity. Compactness is an enhancer of density, whereas walkable urban form is the most viable way to foster connectivity in dense urban space. After experimenting with many alternative measures, the ones that appear to be face valid, available at no cost, and distinct are shown in Table 1.
Vibrant Center Dimensions, Measures, and Data Sources.

Levy and Gilchrist (2014) studied employment centers in the largest 150 cities with the goal of improving the definition of downtowns. They used longitudinal employer–household dynamics (LEHD) data to specify 231 mutually exclusive employment nodes that are combinations of census tracts. They defined the core of the employment center plus two zones of adjacent census tracts—tracts within a ½ mile of the core tracts and tracts within 1 mile. They measured jobs per acre in the core area as well as jobs per acre in the ½-mile and mile adjacent zones. To approximate a density gradient, the job density measure in this analysis incorporates all three measures in the following way: to job density in the core is added job density in the ½-mile zone divided by 2 and job density in the 1-mile zone divided by 4.
Floor-area ratio (FAR) is the measure of compactness that uses CoStar data, which is a proprietary database available to researchers through its university program (see www.costar.com). First, a circle with a radius of a ½ mile is drawn from the center of the employment node. Then, all existing development within this circle is aggregated and divided by the area of the circle to find the FAR. This circle contains almost 22 million square feet. FARs are greater than 1 in centers with vertical development of all types that exceeds this threshold, which is the case for most central business districts (CBDs) of large cities. By comparison, FARs for commercial development in autodominated suburbs rarely exceed 0.30.
Levy and Gilchrist (2014) offered another very useful measure based on LEHD data: the percentage of population living in the core, ½-mile zone, and mile zone that work within this geography. After experimentation with alternative measures, it turns out that this measure is a better indicator of diversity than the entropy measures of diversity in the SLD.
The second diversity indicator is the Walk Score for the employment center (see www.walkscore.com). Walk Scores range from 0 to 100. Each of 10 common destinations, such as banks, grocery stores, other businesses, theatres, and parks, within a ¼ mile receive the maximum score of 10; if these destinations are farther than 1 mile away, the score is 0. The score also incorporates data on population density and topography. Although the Walk Score serves as an indicator of internal connectivity, the score increases when access to common urban amenities exist, which indicates greater land use diversity. Relatedly, Peach and Petach (2016) used Walk Scores to construct their metropolitan development index.
The Walk Scores compiled for this analysis are the average score at the centroids of all census tracts in each center. When they were aggregated for all census tracts in the employment center, each tract was given equal weight.
The SLD provides 12 interesting measures of destination accessibility and connectivity. The two complementary measures included here are the size of the workforce that can commute to the core area of the employment center within 45 minutes either by transit or by auto.
Walkable urban design is primarily a function of the street pattern. The first measure indicates how closely the pattern reflects a perfect grid. This measure is highly correlated with intersection density but is more accurate than intersection density measures when considering dense urban areas. The second walkability measure is average block size. Unlike all other measures that positively associate with vibrancy, smaller blocks are better, consistent with J. Jacobs (1961).
The final walkable design measure is based on a qualitative assessment of the physical features of each center with scores ranging from 0 to 11. Parks (scored 0-4) offer open space and enhance the public realm, which is very important to create a sense of place and encourage walking. Water (scored 0-4) and mountains (scored 0-3) provide boundaries and edges and add physical beauty. Water bodies also offer vistas, whereas mountains offer orientation. Centers receiving low scores have few parks and neither bodies of water nor mountains in close proximity. Centers with high scores have ample public open space and at least one large body of water or several rivers near the center. Visible mountain ranges further increase the score.
All vibrancy measures are standardized and aggregated giving density/compactness, diversity, connectivity, and walkable design equal weight (0.25). The resulting standard scores are then transformed such that the average score is 100 instead of 0. One standard deviation unit is assigned the value of plus or minus 25. Rather than having a set of small positive and negative numbers, most of the resulting vibrancy scores for a study of downtowns ranged from about 80 to 130 (e.g., see the vibrancy scores for 42 downtowns in Kelly and Malizia [2016]).
Typology of Vibrant Centers
Within metro areas, different types of large employment nodes exist. For most metro areas, the largest one is the CBD of the central city. In addition to the primary downtown, many large cities have secondary downtowns that often house universities, medical centers, or other anchor institutions. The metro regions of the largest cities also contain the employment centers of nearby cities, some of which have strong transit connections to the central city. Finally, metro areas contain traditional suburban commercial areas.
The 90 employment centers that we analyzed are drawn from the 231 in the Levy and Gilchrist (2014) report. In addition to the primary downtown (CBDs) of the 150 largest cities, they identified 81 secondary downtowns and other major centers of employment, all delineated as mutually exclusive areas following census tract boundaries. We selected 48 downtowns, 18 secondary downtowns, 12 downtowns in secondary cities, and 12 suburban office parks for this analysis. The 18 secondary downtowns include adjacent midtowns (e.g., Midtown Atlanta) and others anchored by “eds and meds” (e.g., University Circle in Cleveland, OH associated with Case Western Reserve University). These two categories are not mutually exclusive. For several areas adjacent to the CBD, universities or medical centers anchor the employment center. The 12 downtown employment centers in secondary cities are near larger central cities such as Pasadena in the Los Angeles region, or Jersey City, which is close to New York City. The 15 suburban office parks are usually dominated by a major employer such as Microsoft, Sprint, or Texas Instruments and therefore are stronger employment centers than typical suburban office parks. Examples of transit-oriented development cut across the typology. In the appendix, Table A1 lists the 90 centers with their total jobs and population counts in 2010.
Hypotheses, Empirical Tests, and Results
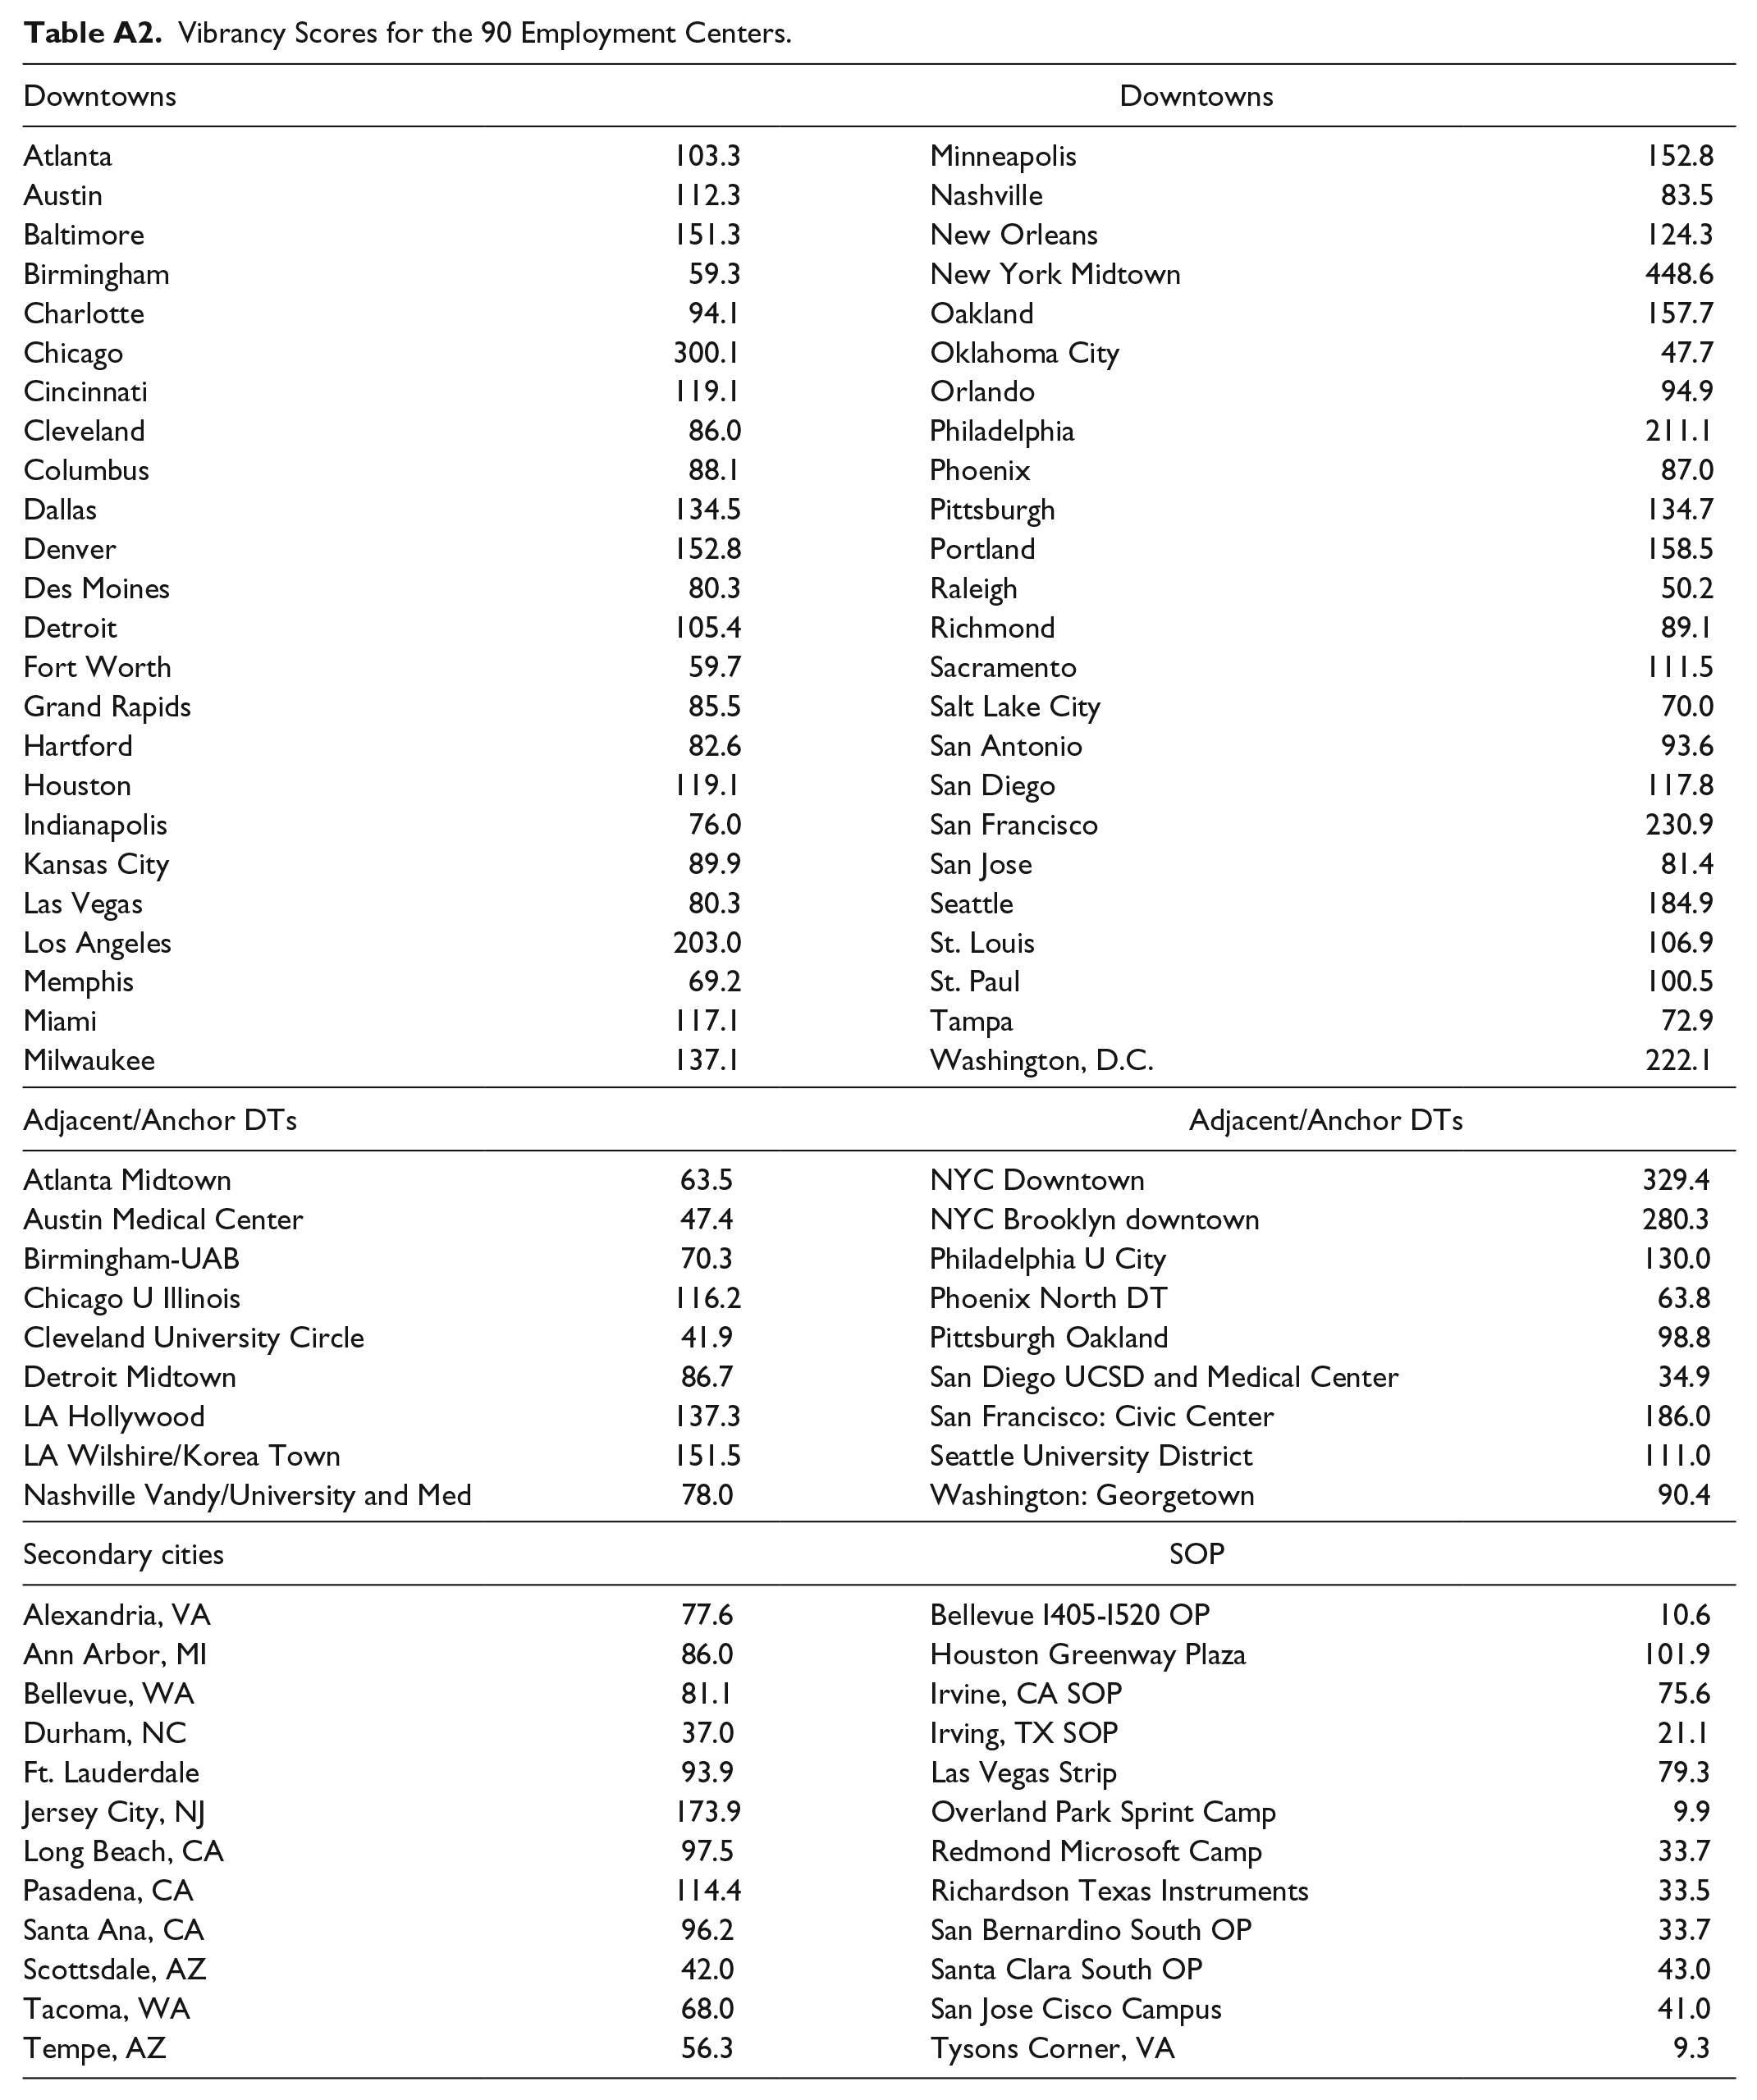
We received the shape files from Gilchrist enabling us to use her census-tract definitions to analyze the 90 centers under study. We generated the vibrancy scores for these employment centers using the indicators in Table 1. The scores cover a wide range; only 44 of the 90 center scores are within 1 standard deviation of the mean (75-125). In the appendix, Table A2 presents the scores for the 90 employment centers.
The economic impacts of spatial vibrancy extend beyond the boundaries of the employment centers; however, many of the centers are adjacent or in close proximity. To avoid double counting, we compiled the dependent variable measures only for the census tracts in each center or within 1 mile of the core area. The employment and inventory measures came from the CoStar database; the income [and poverty] measure was sourced from census data. Interestingly, Fodor (2012) found inverse relationships between metropolitan growth and measures of income, unemployment, and poverty for the 100 largest metropolitan areas in the United States.
For this analysis, we generated two measures of economic growth and one measure of economic development. The growth measures are employment growth and property inventory expansion. We used CoStar daytime employment data for the 1-mile radius around the employment center’s central address. We computed the compound annual growth rate for the 2011 to 2017 period.
The increase in the commercial real estate inventory from 2010 to 2017 serves as a proxy for tax base expansion. Real Capital Analytics has data on the amount of investment over time in current dollars for metro area properties; however, these data are not available for subareas. Instead, we used the CoStar database to find the total rentable building area available in each center for 2017 and 2010. This inventory includes office, warehouse, flex, retail, hospitality, health care, and multifamily properties. Inventory expansion is the square footage in 2017 less the square footage in 2010, which captures tax base growth over this 7-year period.
The economic development measure is the compound annual growth rate of median household income from 2010 to 2015. We weighted median household income for each center by percentage of all households in each tract and then aggregated.
The hypotheses we tested are very straightforward. We expected vibrancy to associate with better economic growth and development outcomes. Specifically, higher vibrancy scores for the 90 centers in 2010 should be significantly related to subsequent positive changes in the economic growth and development indicators. Although the model is cross-sectional and the results are associational, we have a before–after research design where the measurement of vibrancy precedes the economic outcomes that we expect vibrancy to positively influence.
For proper model specification, we introduced control variables. The first set are indicators of urban agglomeration economies and diseconomies that could influence economic outcomes. We used city-level or metro-level measures to reduce potential endogeneity. We expect larger size, greater educational attainment, and more innovation to associate with the economic outcomes positively. For size, we used critical mass instead of total employment, which we define as the sum of population and employment in each center (see Table A1). We purposely double count people who both live and work in the center to define critical mass because they spend more time and money there.
We measured the other two factors at the metro level: the 2010 percentage of the adult population with college education or more and the number of high-growth firms per 100,000 people. INC magazine publishes a listing of privately held firms with over $2.0 million in revenue that grew for the previous 3 years. We culled out the very high-growth segment (20% annual growth rate or over 70% compounded for 3 years) that appeared in the publication from 2007 to 2012. We used their street address to aggregate them by metro area. Since most of the firms were more than 10 years old, we assumed they represent innovative firms more frequently than “gazelles,” which typically are 5 to 10 years old.
To reflect agglomeration diseconomies, we measured pollution and crime. We have metro-level carbon emissions per capita in 2005 as the pollution measure. We introduced the murder rate per 100,000 population at the city level in 2010 as a measure of crime. Area-specific police behavior and administrative procedures are less likely to influence this rate than the overall crime rate. We expected these two control variables to associate negatively with economic outcomes.
The other controls are two sets of dummy variables. The first indicates the regional location of the 90 centers, either Northeast (10), Southeast (20), Southwest (16), or West (26) with Midwest (18) as the base case. The second indicates type of employment center. We have dummy variables for adjacent/anchored centers (18), secondary-city centers (12), and suburban centers (12) with CBDs (48) as the base case.
Table 2 shows descriptive statistics for vibrancy and the five control variables for the 90 employment centers excluding the dummy variables. We standardized the independent variables (excluding dummy variables) so that the coefficients would be comparable and ran the three models in linear form employing robust standard errors to address heteroscedasticity. We encountered no collinearity problems based on the variance inflation test.
Descriptive Statistics.
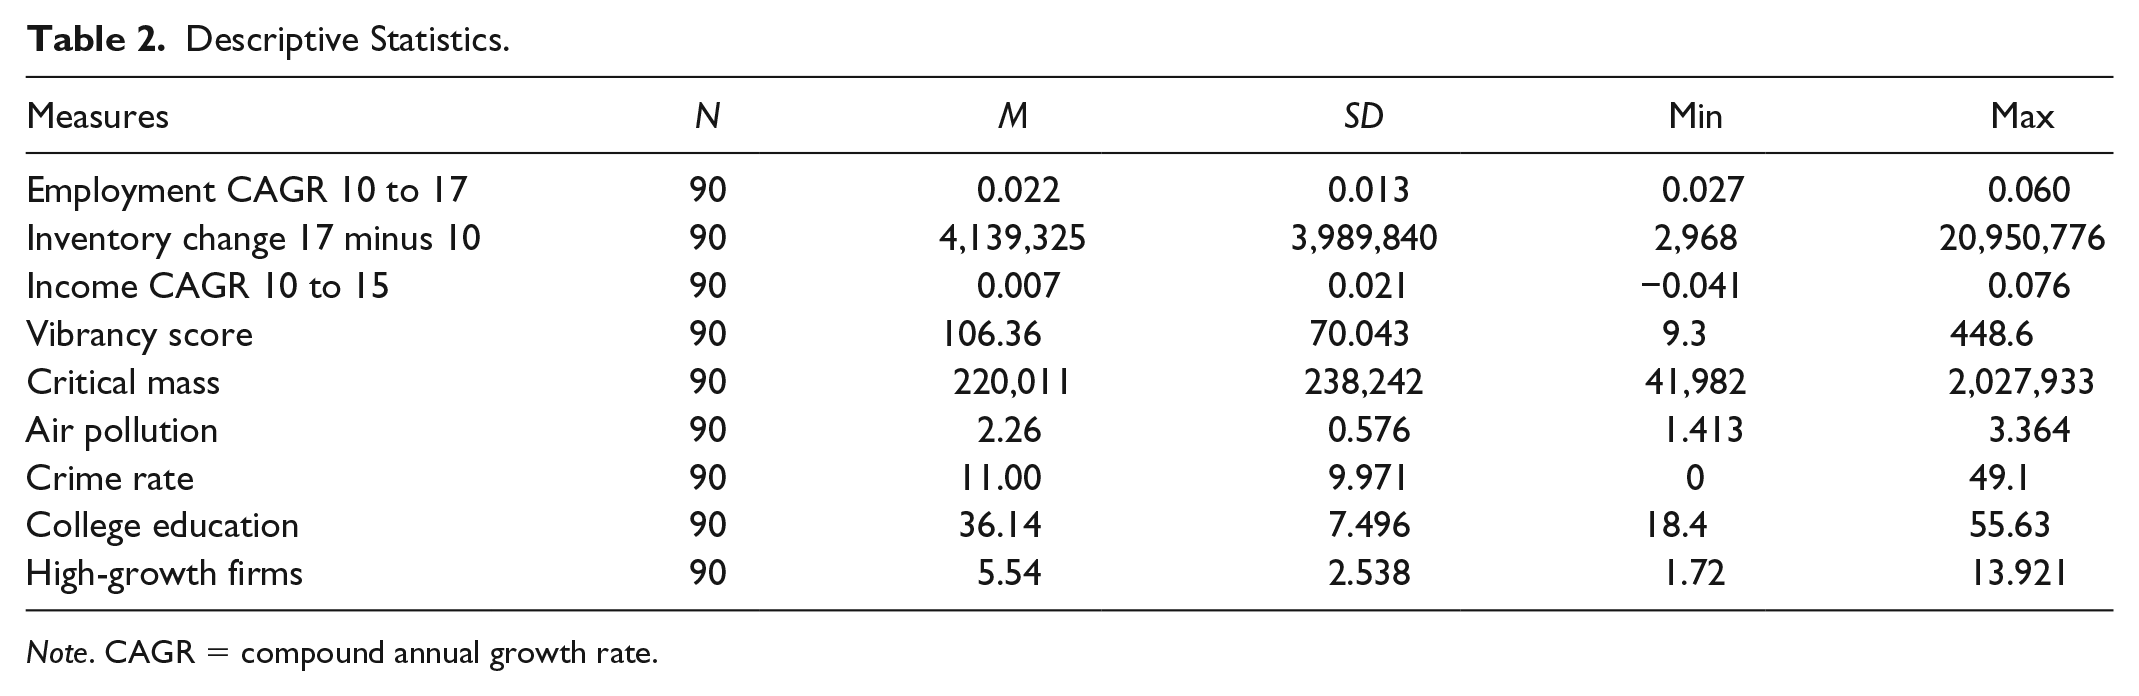
Note. CAGR = compound annual growth rate.
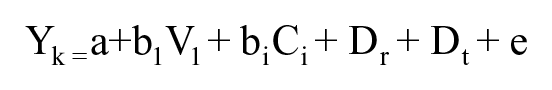
Where Y = dependent variables measuring economic growth or development, V = vibrancy score, C = control variables for agglomeration economies or diseconomies, and D = dummy variables for region or type of center, Subscripts: k = either employment growth rate, inventory expansion, or median income growth rate (or change in the poverty rate); i = coefficients for size, education, innovation, pollution, or crime; r = regional dummies for four regions with Midwest as the base case; and t = dummies for the three types of employment center with CBDs as the base case.
Table 3 presents the results for the three models. We first examined the coefficient values for vibrancy compared with the coefficients for the other five interval variables. In all three models, the vibrancy index has the largest absolute coefficient value, which indicates that vibrancy is the most important variable in the models. As for statistical significance, vibrancy achieves the 1% level in the employment growth and inventory expansion models and the 5% level in the employment growth model and in the income growth model. The results support the hypotheses; vibrancy has a positive influence on employment growth, inventory (tax base) expansion, and median household income growth.
Model Results.
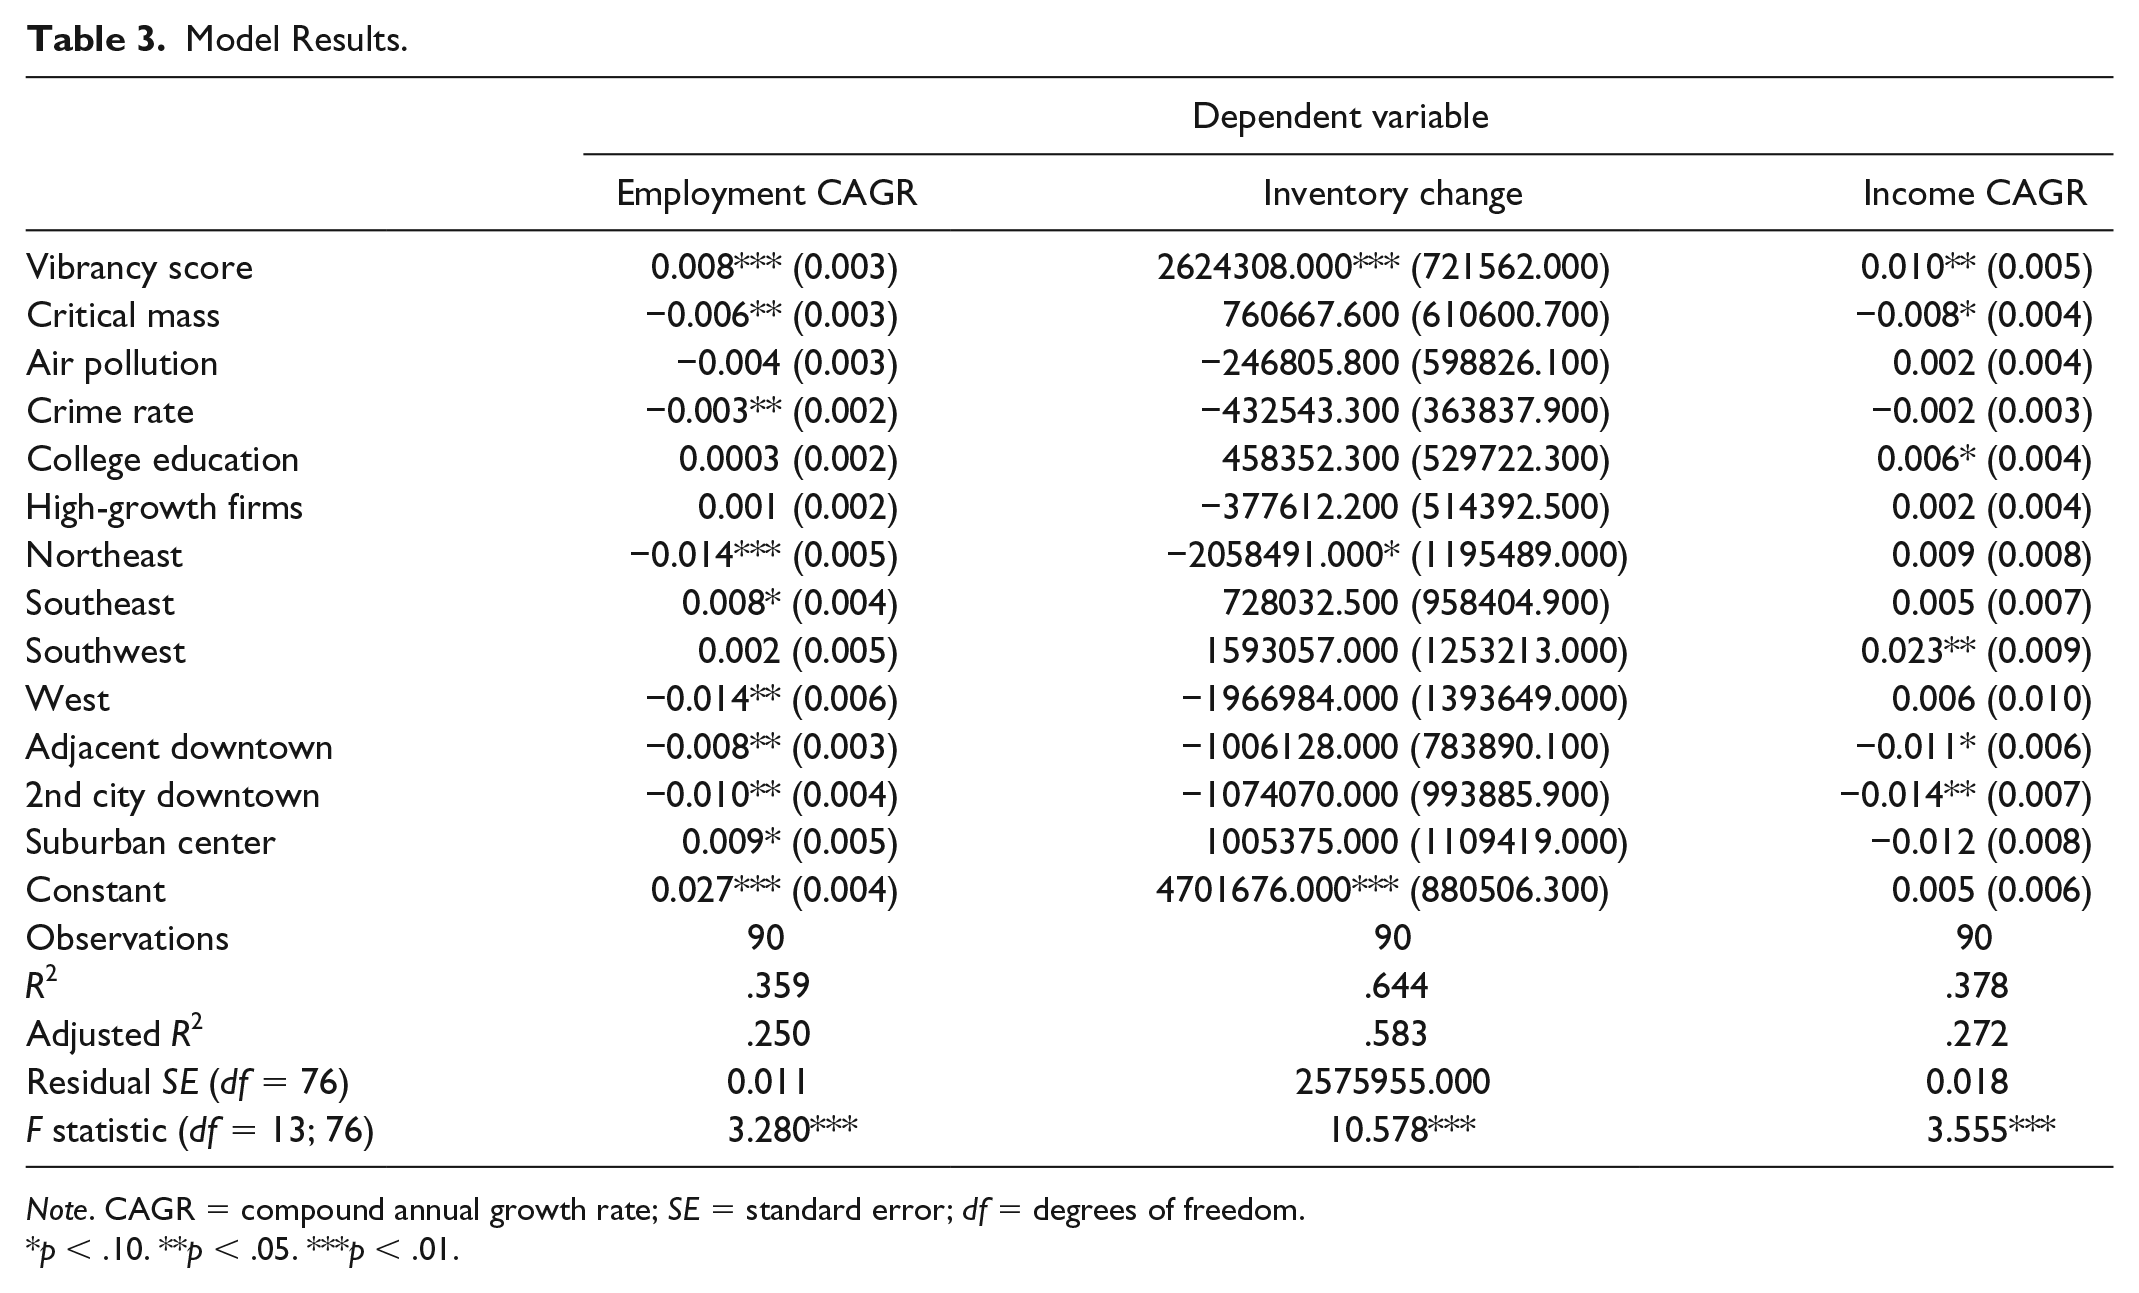
Note. CAGR = compound annual growth rate; SE = standard error; df = degrees of freedom.
p < .10. **p < .05. ***p < .01.
As for the control variables, critical mass has significant negative relationships in the employment growth model and the median income growth model despite its positive pairwise correlations with these dependent variables. Such negative relationships can occur when a strong positive correlation exists between two independent variables. The pairwise correlation between the vibrancy index and critical mass is very high at +0.83. The other four control variables have the expected coefficient sign in 10 of the 12 cases but are not often significant. Crime is negatively associated with employment growth (5% significance level). College education achieves the 10% significance level in the income growth model but is not significant in the other two models. The high-growth firms measure is not significant in the models.
The regional dummy variables are significant more frequently than the control variables. In the employment growth model, the Southeast has a significant positive shift parameter, but the Northeast and West have significant negative parameters, which is surprising given that the Midwest is the base case. The Northeast also has a negative shift parameter in the inventory expansion model. The Southwest dummy variable is positively associated with median income growth.
The dummy variables for type of center are not significant in the inventory expansion model but have significant results in the other two models. Anchored or adjacent secondary downtowns and the downtowns of secondary cities have slower employment growth and less income growth compared with CBDs. Suburban office centers have higher employment growth than CBDs (10% significance level).
Implications for Economic Development Practice
Local economic developers primarily focus on business development in their jurisdiction. The tools of the trade have expanded over the years from attraction strategies to additional ones captured by the attraction, creation, retention, and expansion (ACRE) acronym. Most jurisdictions also have downtown development associations usually organized as business improvement districts (Mitchell, 2001). Economic developers usually consider association executives as allies who are promoting sound redevelopment to improve livability.
This study provides evidence that the live-work-play dynamic in major employment centers appears to have positive economic growth and development outcomes. Employment centers with greater vibrancy experienced higher employment growth, greater tax base expansion, and higher income growth than less vibrant centers. This evidence suggests that economic developers should become more directly involved in downtown/employment center redevelopment. What is their potential role?
Economic developers should begin by assessing how well downtown is serving firms located within the region. The most important ones are major employers that comprise the area’s economic base and emerging growth companies. Developers should survey top executives running these firms to gather hard evidence that addresses this question. In an era of virtual connectivity, we should not assume that the assets promoting productivity and innovation are locally based. Developers could use the framework of sharing, matching, and learning applied in the Conceptual Framework section of this study to generate the survey questions. The answers should suggest specific downtown policies and strategies to guide local practice.
Although clearly one size does not fit all situations, the four dimensions of vibrancy can help suggest potential strategies to make working, convening, and learning among workers, executives, and entrepreneurs more successful downtown. Adding density on infill sites will generally increase vibrancy, but in some instances greater density can do more harm than good. We need context–sensitive design to add density and compactness without damaging downtown functionality, authenticity, or uniqueness (Montgomery, 1998).
The greatest challenge is to increase or at least maintain downtown diversity. The tendency to ramp up development regulation to slow the pace of redevelopment usually results in less supply and even sharper increases in rents. Form-based zoning is one method to encourage mixed-use and multiuse development. Special-purpose historic or cultural districts is another tool that can maintain land-use diversity and social diversity, to some extent. Socially oriented investment funds can purchase or master lease commercial property that are offered at affordable rents. Cities can repurpose certain downtown properties they own to accommodate commercial tenants who cannot afford market rents. Local economic developers should think about ways to protect some older commercial buildings from redevelopment. Otherwise, the disappearance of C-class office and industrial properties could disadvantage service-sector companies as well as budding entrepreneurs.
The greater challenge is to maintain economic diversity as land values escalate. Tight labor markets may afford the opportunity to upgrade the skills of low-income persons. Workforce development programs and apprenticeship training can expand the local talent pool. Workforce housing offered as micro units is a way to keep service-sector workers downtown.
Improving connectivity and access can mitigate the effects of rising rents, to some extent. For example, high-growth firms may be able to secure affordable space with expansion potential outside of downtown as long as needed access to downtown is convenient. Workforce housing can be located on sites with good public transit access to the core instead of competing for downtown sites better devoted to commercial purposes.
The fourth dimension of walkable design focuses on street patterns and physical features of urban form that are not easily changed. Still new streets or alley links that strengthen the street grid should be helpful. Parks can be developed that enhance the public realm and offer places to convene. Linear designs that repurposed abandoned railroad lines have been very successful (e.g., The High Line in New York City and Railroad Park in Birmingham, AL).
Local economic development practice is often focused on individual firms seeking incentives or on individual development projects seeking subsidies such as tax increment financing. The strategies proposed here emphasize downtown improvements designed to serve many firms and downstream projects. They have better odds of success in places advantaged by good local leadership and the professional management of public assets (Detter & Folster, 2017). Although the threat of “gentrification” has received considerable attention, the more dramatic change in central cities across the country has been the increase in property tax and sales tax revenues generated from downtown revitalization and properties that have greatly appreciated in value. 2 Cities now have more resources they can use to enhance the positive externalities associated with economic development and mitigate the negative externalities associated with growth.
Footnotes
Appendix
Vibrancy Scores for the 90 Employment Centers.
| Downtowns | Downtowns | ||
|---|---|---|---|
| Atlanta | 103.3 | Minneapolis | 152.8 |
| Austin | 112.3 | Nashville | 83.5 |
| Baltimore | 151.3 | New Orleans | 124.3 |
| Birmingham | 59.3 | New York Midtown | 448.6 |
| Charlotte | 94.1 | Oakland | 157.7 |
| Chicago | 300.1 | Oklahoma City | 47.7 |
| Cincinnati | 119.1 | Orlando | 94.9 |
| Cleveland | 86.0 | Philadelphia | 211.1 |
| Columbus | 88.1 | Phoenix | 87.0 |
| Dallas | 134.5 | Pittsburgh | 134.7 |
| Denver | 152.8 | Portland | 158.5 |
| Des Moines | 80.3 | Raleigh | 50.2 |
| Detroit | 105.4 | Richmond | 89.1 |
| Fort Worth | 59.7 | Sacramento | 111.5 |
| Grand Rapids | 85.5 | Salt Lake City | 70.0 |
| Hartford | 82.6 | San Antonio | 93.6 |
| Houston | 119.1 | San Diego | 117.8 |
| Indianapolis | 76.0 | San Francisco | 230.9 |
| Kansas City | 89.9 | San Jose | 81.4 |
| Las Vegas | 80.3 | Seattle | 184.9 |
| Los Angeles | 203.0 | St. Louis | 106.9 |
| Memphis | 69.2 | St. Paul | 100.5 |
| Miami | 117.1 | Tampa | 72.9 |
| Milwaukee | 137.1 | Washington, D.C. | 222.1 |
| Adjacent/Anchor DTs | Adjacent/Anchor DTs | ||
| Atlanta Midtown | 63.5 | NYC Downtown | 329.4 |
| Austin Medical Center | 47.4 | NYC Brooklyn downtown | 280.3 |
| Birmingham-UAB | 70.3 | Philadelphia U City | 130.0 |
| Chicago U Illinois | 116.2 | Phoenix North DT | 63.8 |
| Cleveland University Circle | 41.9 | Pittsburgh Oakland | 98.8 |
| Detroit Midtown | 86.7 | San Diego UCSD and Medical Center | 34.9 |
| LA Hollywood | 137.3 | San Francisco: Civic Center | 186.0 |
| LA Wilshire/Korea Town | 151.5 | Seattle University District | 111.0 |
| Nashville Vandy/University and Med | 78.0 | Washington: Georgetown | 90.4 |
| Secondary cities | SOP | ||
| Alexandria, VA | 77.6 | Bellevue I405-I520 OP | 10.6 |
| Ann Arbor, MI | 86.0 | Houston Greenway Plaza | 101.9 |
| Bellevue, WA | 81.1 | Irvine, CA SOP | 75.6 |
| Durham, NC | 37.0 | Irving, TX SOP | 21.1 |
| Ft. Lauderdale | 93.9 | Las Vegas Strip | 79.3 |
| Jersey City, NJ | 173.9 | Overland Park Sprint Camp | 9.9 |
| Long Beach, CA | 97.5 | Redmond Microsoft Camp | 33.7 |
| Pasadena, CA | 114.4 | Richardson Texas Instruments | 33.5 |
| Santa Ana, CA | 96.2 | San Bernardino South OP | 33.7 |
| Scottsdale, AZ | 42.0 | Santa Clara South OP | 43.0 |
| Tacoma, WA | 68.0 | San Jose Cisco Campus | 41.0 |
| Tempe, AZ | 56.3 | Tysons Corner, VA | 9.3 |
Declaration of Conflicting Interests
The author(s) declared no potential conflicts of interest with respect to the research, authorship, and/or publication of this article.
Funding
The author(s) received no financial support for the research, authorship, and/or publication of this article.