



Abstract
While the concept of rurality has been debated in academic and professional literature for decades, less research has been done on a practical typology that can guide localized economic development strategies. This paper adds to the growing body of literature in search of a more nuanced definition of rural by applying unsupervised machine learning (ML) to the abundance of existing county-level data in the United States. The authors illustrate how this method can lead to a new county typology, named after economic development strategies, that accounts for idiosyncrasies in resources, opportunities, and challenges. This research serves as a practical step toward tractable, heterogeneous classifications that can inform the work of federal, state, and local policy makers, economic development practitioners, and many others.
The geographic term “rural” remains a relatively inexact concept with a nonuniform definition in the United States, particularly given the country's varied demographics and geography, among other manifold characteristics (Deavers, 1992; Hawley et al., 2016; Isserman, 2005; U.S. Department of Agriculture, 2019b). While the definition of rural has been deliberated and established by U.S. agencies (e.g., the Office of Management and Budget [OMB], the U.S. Census Bureau, and the U.S. Department of Agriculture-Economic Research Services (USDA-ERS)), the lack of a systematic definition has created challenges for service providers, grant funders, economic developers, and many others (Rural Health Information Hub, 2019).
Rural has mainly been characterized by scarce population and remoteness, as well as land use and economic function (Waldorf & Kim, 2018). Currently, the most common definitions of rural rely on population size and contiguity to delineate urban areas, while the remaining geographies are thought of as rural. The U.S. Census Bureau simply defines rural as all population, housing, and territory not included within an urban area (U.S. Census Bureau, 2019). OMB defines metropolitan and nonmetropolitan areas, which are often used as a proxy to the rural/urban classification (U.S. Department of Agriculture, 2019b; Waldorf & Kim, 2018). Nonmetropolitan counties are defined by OMB as counties with less than 50,000 people with limited commuting flows. The commuter flow information used in the OMB classification contributes to the differences between the Census’ rural/urban definition and the OMB's metro/nonmetro definition. For instance, in 2010, 25% of residents living in nonmetropolitan OMB counties were classified as “urban” according to the U.S. Census Bureau (Waldorf & Kim, 2018).
From a researcher's perspective, prior papers have shown the sensitivity of findings to the rural coding scheme used (Atav & Darling, 2012; McAndrews et al., 2016). To illustrate, recent work used the constantly changing National Center for Education Statistics’ definition of rural to demonstrate that the definition affects findings on college completion (Manly et al., 2020). In other work, using the Census’ rural definition, the poverty rate was estimated at about 13% in rural areas, compared to 15% for urban areas using the OMB classification; with metro proxying for urban, the same rate was estimated at over 17% in rural areas and 14% in urban areas (Randolph et al., 2019). These examples illustrate how regional delineations can cause differences in calculating outcomes of interest, which, in turn, can have direct policy implications.
From a practitioner's perspective, having a mischaracterized county, or a lack of knowledge of which rural coding scheme better illustrates disparity in an outcome of interest, can limit access to needed funding. Effectively, we often observe state or regional efforts for county classifications by which funding can be allocated. As an example, the Appalachian Regional Commission (ARC) annually applies a classification system that groups Appalachia's 420 counties into one of five economic status designations. The designations are then used to determine the match requirements for ARC grants, as well as strategies to target resources to the region's most distressed counties (Appalachian Regional Commission, 2021). Similarly, the North Carolina Department of Commerce annually ranks the state's 100 counties and assigns each a tier designation, which is then incorporated into state programs to encourage economic activity in the less prosperous areas (North Carolina Department of Commerce, 2021). Companies making qualified investments in distressed counties also receive larger tax credits (Lane & Jolley, 2009).
While researchers and practitioners have debated the definition of rural across time and geography (e.g., Cloke, 1977; du Plessis et al., 2002; Goldsmith et al., 1993; Halfacree, 1993; Health Resources and Service Administration, 2018; Miller, 2013; Schaeffer et al., 2013; Skillman et al., 2013; Waldorf & Kim, 2018; Williams & Cutchin, 2002), from a broader perspective, current national definitions of the term remain too aggregate and simple to successfully guide localized economic development strategies (Isserman et al., 2009). Moreover, the differences between urban and rural have diminished over time, as economic bases and core industries have shifted (Schaeffer et al., 2013).
Given these definitions, changes, and challenges, there remains a need for a typology of rural that accounts for these areas’ more granular characteristics and idiosyncratic challenges. This paper suggests a continuous categorization of counties that can be aggregated into one broader category known as rural. It builds on existing research examining rurality (Cloke, 1977; Miller, 2013; Waldorf & Kim, 2018) and agency definitions, particularly the USDA-ERS county typology, which classifies all U.S. counties according to six mutually exclusive categories of economic dependence: farming, mining, manufacturing, government, recreation, and nonspecialized. Here, we aim to extend the factors considered by including data within three thematic areas: (1) natural resources production (e.g., agriculture, fossil fuels); (2) the presence of opportunities in the form of assets and attractions, including renewable energy potential; and (3) challenges in the form of lower Internet connectivity, among other variables. While this is not a comprehensive list of the rural attributes of U.S. counties, our work provides a rural classification framework that incorporates nuance and variable diversity on the quest for a definition that can guide economic development policy and strategy.
We first operationalize geographic data and then use clustering, an unsupervised machine learning (ML) technique, to produce groups of counties facing similar challenges and opportunities. Clustering is a tool that can detect patterns in data and group observations with similar characteristics. The tremendous amount of available geospatial data and advances in computational methods have created an opportunity to inform regional science (Miller, 2010; Vaz, 2021). Notably, the regional science literature has been applying ML techniques to delineation issues (e.g., a network portioning approach has been applied to commuting data to define regions in Scotland; Hamiltion & Rae, 2020) and megaregions in the United States (Rae & Nelson, 2017).
In this paper, we present a typology of U.S. counties, with a deeper understanding of anchor institutions, natural resources, and infrastructure needs, among other dimensions. This can provide economic development practitioners with the immediate identification of comparable communities which can, in turn, inform place-based economic development strategies to support their regions. Central to the application of regional economic development policies is the definition of a region, which we address in this paper. A regional approach to economic development allows communities to achieve more prosperity by pooling resources. This is the impetus behind the federal economic development district (EDD) designations, which are employed to foster economic growth. In fact, EDDs have been shown to play a more dominant role in rural areas (Erickcek et al., 2011). Additionally, grouping counties facing similar challenges, or in the pursuit of similar opportunities, will likely be more successful regarding engaging federal agencies. Our paper closes with two case studies. In Maine, we find that investing in anchor institutions in both Aroostook and Franklin counties is a pertinent economic development strategy, while also observing that Franklin would benefit from investment in physical capital. In Ohio, we found that Adams County is in great need of both human and physical capital investments, having low broadband connectivity and a high share of adults without a college degree. We conclude with broader implications and suggestions for future research.
What is the Current Definition of Rural?
Defining the term rural remains a challenging endeavor from both a static and dynamic perspective. Statically, the United States covers roughly 3.8 million square miles of diverse geography, which includes varied climates and terrain (Hersey & Steinberg, 2019). Dynamically, U.S. urban areas in the have been rapidly transforming and evolving in recent years (Badger & Bui, 2019; McDonald, 2013). For most of its history, the United States has been a predominately rural country; it was not until the mid-1800s to the early 20th century that settlement patterns started to shift in response to an increasingly urban-oriented economy (Housing Assistance Council, 2011; Vacchiani-Marcuzzo et al., 2018). From there, the trend toward urbanization remained persistent, with continued industrialization, an enhanced transportation network, and advancements in finance and real estate (Boustan et al., 2013).
Roughly 95% of the land area in the United States (and 19% of the country's population, or nearly 60 million people) is classified as rural by the U.S. Census Bureau (2017). Though difficult to operationalize and delineate, a more precise definition of the term remains important for policy makers, economic development practitioners, and many others. Beyond the need for a definition itself, there is an additional need for consensus on a common definition. For instance, Randolph et al. (2019) demonstrated how the multiple definitions of “rurality” may cause the degree of disparity in a given outcome to vary depending on the definition used. Though many definitions exist, as seen in Table A.1, we restrict our attention in this section to the two most common, as developed by the U.S. Census Bureau and the USDA-ERS.
The U.S. Census Bureau identifies two types of urban areas: “Urbanized Areas” (UAs) with populations greater than 50,000, and “Urban Clusters” (UCs) with populations between 2,500 and 50,000. In turn, “rural” encompasses all populations, housing, and territories not included within a UA or UC. Figure 1 illustrates this U.S. Census Bureau definition, in which the unit of observation is the census tract, an area approximately equivalent to what is commonly referred to as a neighborhood. Here, it is clear from the abundance of white space not covered by UAs or UCs, that this definition of rural is much too aggregate, broad, and dichotomous for any meaningful analysis or practical/localized strategic economic development planning.
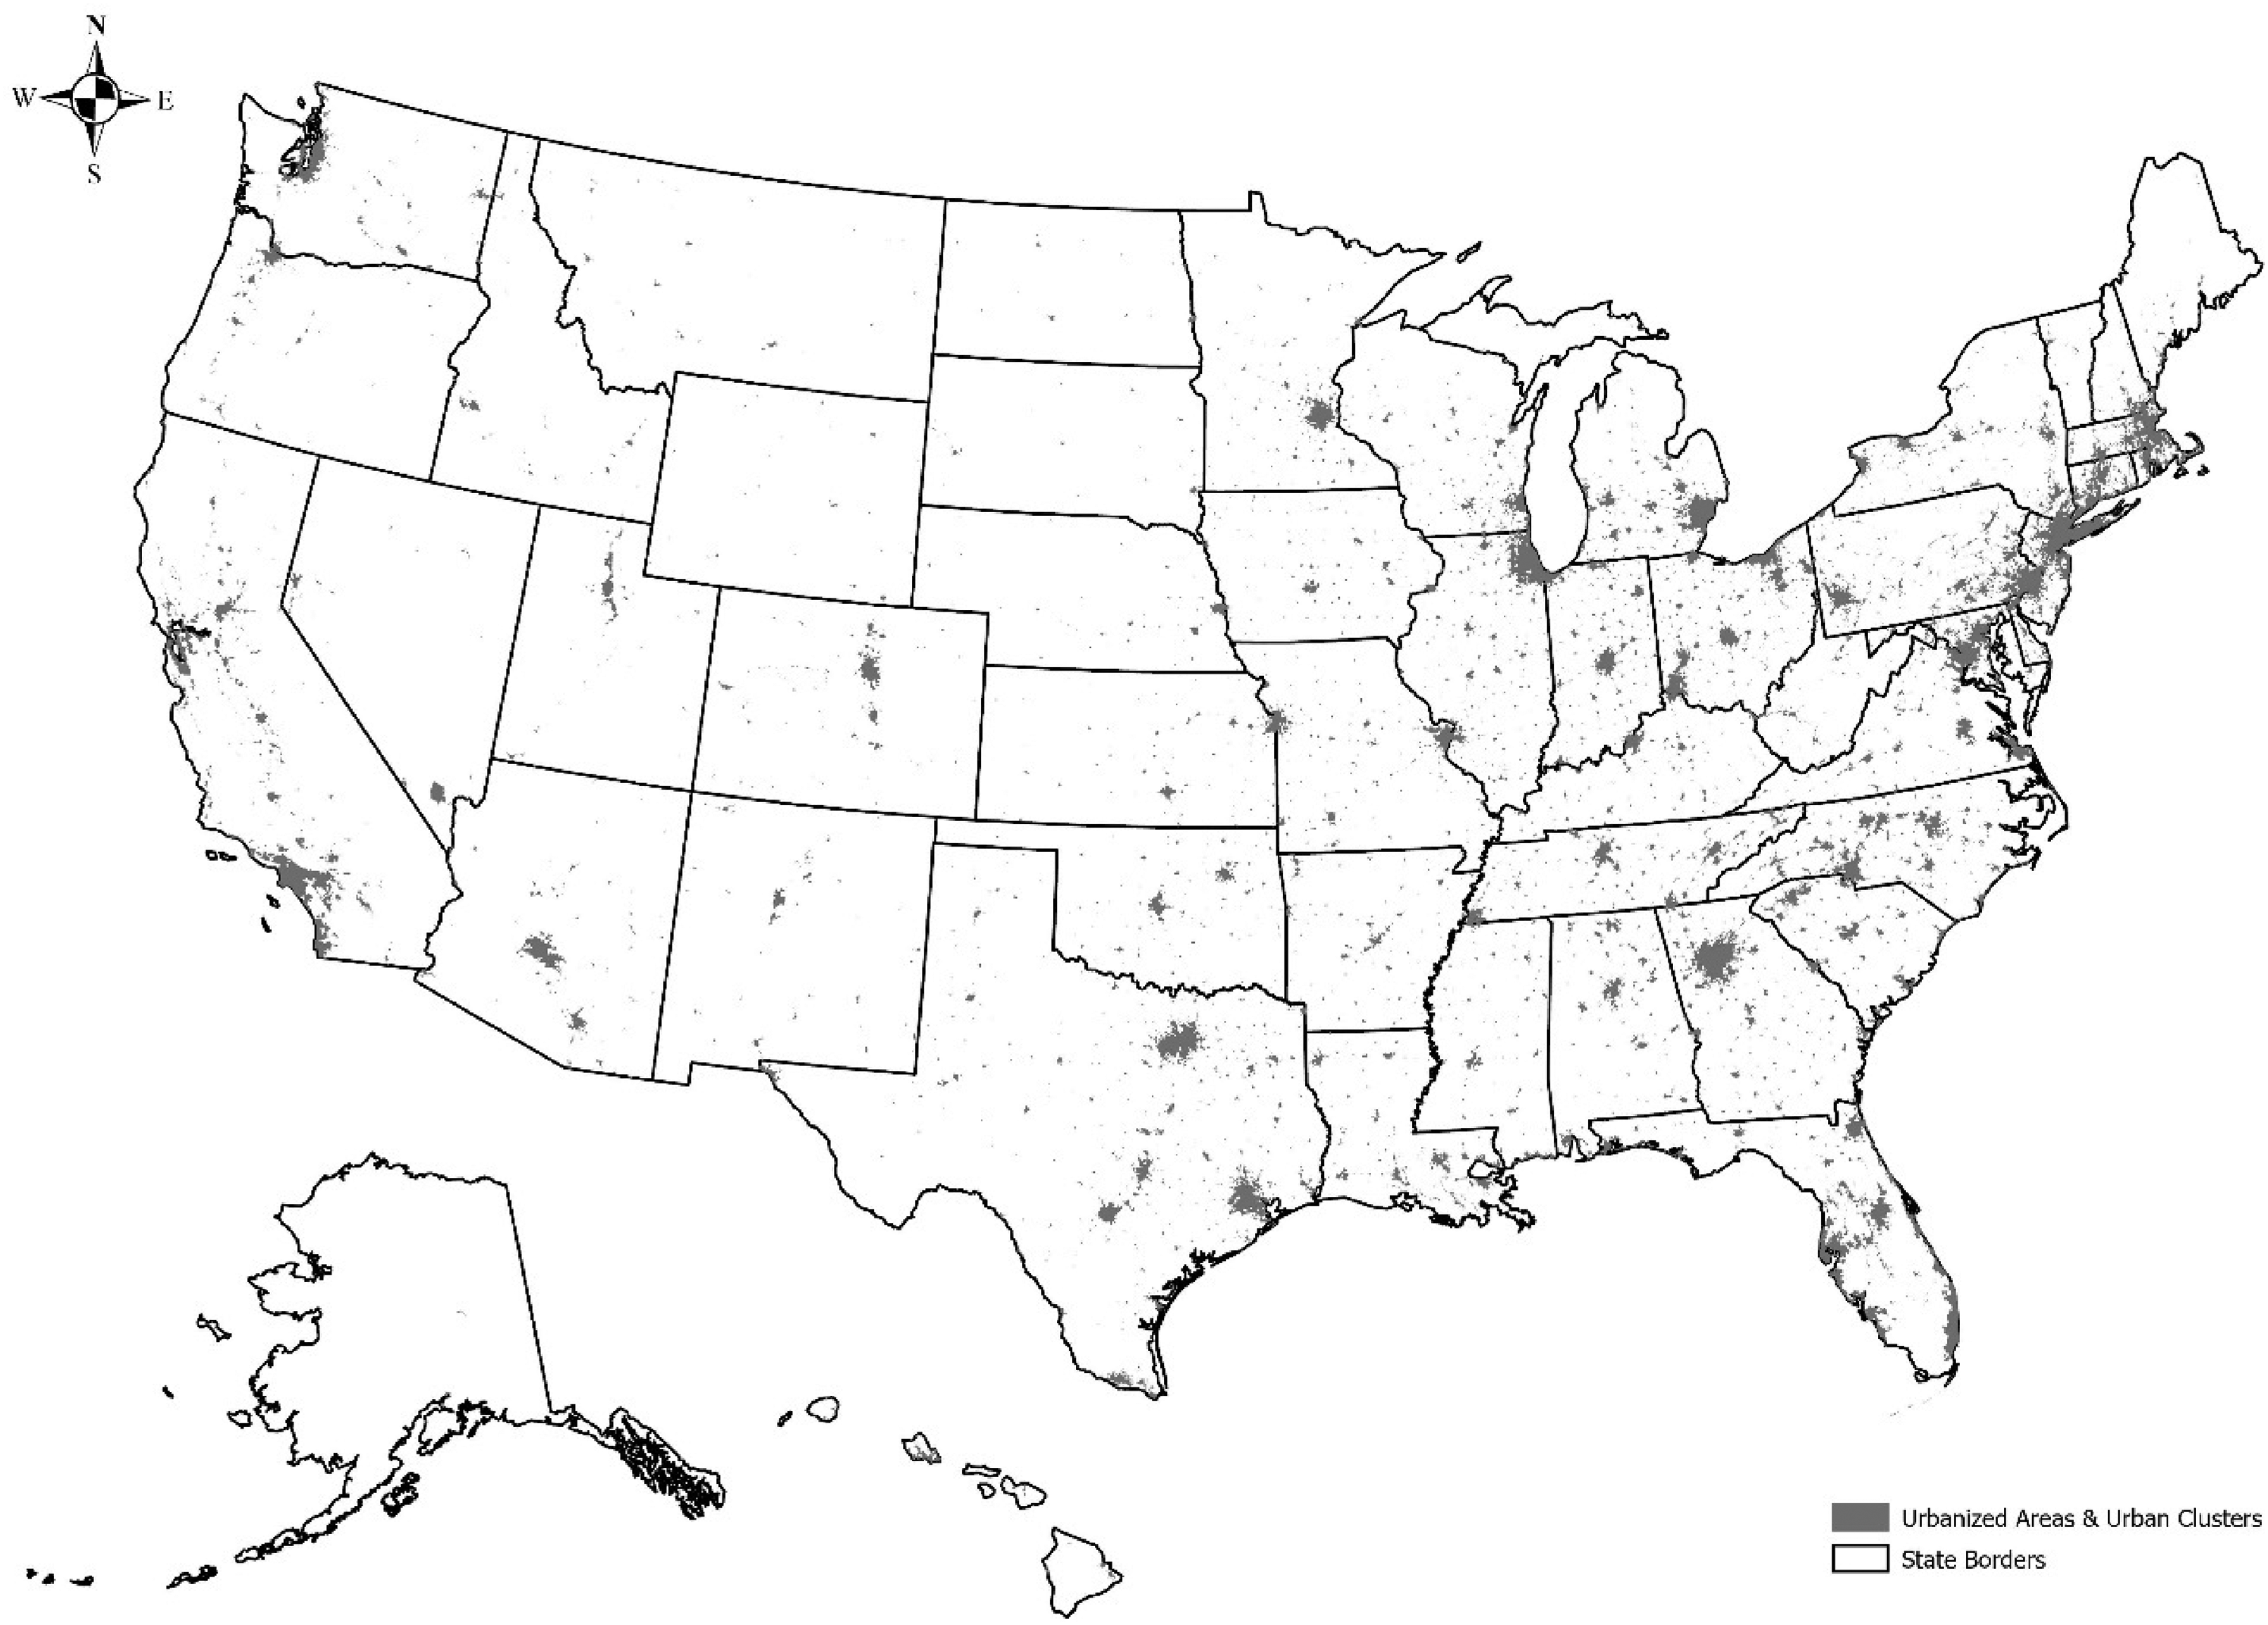
U.S. Census Bureau definition of rural. Note. Figure 1 illustrates the U.S. Census Bureau definition of rural, in which the unit of observation is the census tract. Developed by authors using ArcGIS Pro.
The USDA-ERS, acknowledging that an area's economic and social characteristics have significant effects on its development and need for various types of public programs, provides a county typology that classifies all U.S. counties according to six mutually exclusive categories of economic dependence, as well as six overlapping categories of policy-relevant themes. The economic dependence types include farming, mining, manufacturing, federal/state government, recreation, and nonspecialized counties. The policy-relevant types include low education, low employment, persistent poverty, persistent child poverty, population loss, and retirement destination. Figure 2 illustrates the USDA-ERS mutually exclusive economic dependence categories, in which the unit of observation is the county.

USDA-ERS non-overlapping types. Note. Figure 2 illustrates the USDA-ERS mutually exclusive economic dependence categories, in which the unit of observation is the county. Developed by authors using ArcGIS Pro.
To illustrate the need for a more nuanced definition of rural than even the USDA-ERS county typology provides, we provide an example focused on the state of Ohio (see Figure 3). Here, we note that Adams, Muskingum, and Washington counties are all classified as rural, nonspecialized Ohio counties, yet, from our knowledge of the region, we know that they differ in the opportunities and challenges they face. To illustrate, Adams County has seen closures of two coal-fired power plants (Jolley et al., 2019). While Washington County is also dealing with a power plant closure, it benefits from the existence of a hospital, as well as a private college that attracts students from neighboring counties and outside of the state. Thus, opportunities and challenges, not only resources or industry dependency, should be added to any classification system that aims to accurately characterize rural communities. Having a better understanding of the unique attributes of counties can help practitioners hone in on existing strengths, or perhaps pivot and develop new, underutilized assets.

Ohio as an illustrative example. Note. Figure 3 illustrates the USDA-ERS mutually exclusive economic dependence categories for Ohio, in which the unit of observation is the county. Developed by authors using ArcGIS Pro.
While the definition of rural has been debated in various disciplines for decades (e.g., Bennett et al., 2019; Hall et al., 2006; Hart et al., 2005; Hedlund, 2016; Hoggart, 1988; Smith et al., 2013; van Eupen et al., 2012; Wallin, 2003), less research has been done on a comprehensive definition that can be useful for economic development purposes. Our paper adds to the existing literature by providing a classification of counties that accounts for local idiosyncrasies. These significant local variations are well documented, not just in terms of characteristics of localities, but also in the impact of these characteristics on growth dynamics (e.g., college attainment was found more likely to spur growth in the western United States than in the east [Deller, 2010; Partridge et al., 2008]). The classification discussed in this paper can facilitate the application of a regional economic development approach by allowing similar communities to join forces to achieve their common goals (e.g., Appalachian Regional Commission, 2013). This can potentially extend to communities that are not contiguous or in close proximity, but share overlapping attributes. For example, parallels are often drawn between Appalachia and Wyoming, both of which are facing fossil fuel energy transitions (Adams & Bleizeffer, 2020).
A New Typology of Rural
In this paper, we draw inspiration from the USDA-ERS county typology, as well as prior economic development literature, by leveraging the abundance of publicly available county-level data and unsupervised ML techniques (i.e., clustering) to create a continuous nomenclature that encompasses the entirety of the United States and accounts for idiosyncrasies in resources, opportunities, and challenges. Our approach produces a continuous grouping that better reflects regional characteristics than a dichotomous one. The result is a cluster-based nomenclature reflecting potential economic development strategies.
A refined typology that focuses on areas’ characteristics, coupled with an understanding of anchor institutions, core industries, renewable energy potential, and infrastructure needs, can lead to better-informed strategic planning and the application of place-based economic development strategies/policies. For instance, when practitioners can use such a typology, they can execute advanced methods of smart specialization, workforce development programs, talent attraction, technology, and transit investments, very specifically tied to the needs of existing local industries (Varga et al., 2020). Such knowledge and engagement not only better target regional needs, they can also spur innovation in historically underutilized sectors/assets that can promote more inclusive economic development through specialized investments that mitigate the rise in spatial inequality. It has been well documented that approaches to economic development are driven by regional needs (Olberding, 2002), and that more granular data on rural resources, opportunities, and challenges helped advance cluster-based approaches and specializations as part of a broader regional approach (Porter, 1996).
This paper uses the county as its unit of observation. We build the county-level data set by collecting characteristics grouped into three thematic areas: resources, opportunities, and challenges. The characteristics included in this analysis are based on the literature-documented links to economic development, as well as on the existence of programs that communities can leverage toward attaining economic growth. In the following sections, we explain the link between these characteristics and economic development and provide information on existing programs that have the potential to address challenges or facilitate opportunities.
Natural Resources
First, we examine the link between economic development and natural resources, which include farming, forestry, and nonrenewable energy resources (i.e., coal, oil, and natural gas). Rural residents expect resource extraction to lead to local prosperity (Fisher, 2001). However, natural resource dependency is often associated with less economic growth (Betz et al., 2015; Partridge et al., 2013; van der Ploeg, 2011) and vulnerability to boom and bust cycles (Buscher, 2012; Michaud, 2018).
Farming has seen profound changes in the past century, which is evident through the decrease in the farm population and the increase in market concentration (Lobao & Meyer, 2001). Farmers not only face competition from corporate farming, but they also must deal with the sudden onset of diseases, severe weather conditions, and volatile international trade relations. As of 2017, more than 40% of midsize farms were at high risk of financial problems, according to the U.S. Department of Agriculture (2018). However, affection for agrarian livelihoods and rural environments has remained appealing to many urban residents and created opportunities for rural and agricultural tourism (Harrington, 2018). In addition, the emergence of precision agriculture has helped to promote regional economic development, job growth, and infrastructure improvements (Gebbers & Adamchuk, 2010). The U.S. Department of Agriculture (2019a) estimated that connected technologies, through Internet infrastructure (i.e., broadband), can create a potential $47 to $65 billion in annual gross benefit for the country. USDA administers the Broadband ReConnect Program, which furnishes loans and grants for the construction and improvement of broadband service in eligible rural areas (U.S. Department of Agriculture, 2020b). The USDA also administers many other programs aimed at small and midsized farmers (e.g., programs that facilitate access to capital or buyers; U.S. Department of Agriculture, 2020c). Given these links between farming and economic development, we include information on number of farms, total agricultural sales, sales from agritourism, and number of farms with Internet access. Table A.2 lists all variables used in this analysis, as well as the data source. Table A.5 includes the programs mentioned in the previous section designed to help address challenges or facilitate opportunities.
Forest products have also contributed significantly to regional economies (Jolley et al., 2020). They have been shown to have the potential to reduce poverty while also contributing to climate change mitigation (Arnold, 2002; Nambiar, 2015). Forestry contributes directly to a rural economy because it produces a range of outputs and provides a desirable location for nonforestry-related business and an attractive living environment (Slee et al., 2004). The U.S. Forest Service administers programs to enhance/maintain forests, such as the forest legacy program that provides grants to state agencies to conserve lands that support strong markets for forest products (U.S. Forest Service, 2020). Given these links between forestry and economic development, we include information on forest products income.
Coal mining has a legacy of providing needed jobs in isolated communities, although it often operates in regions that suffer from high poverty and weaker long-term economic growth (Betz et al., 2015). There is a large body of literature arguing that the Appalachian region's dependence on coal mining has contributed to its deep poverty through weaker local governance, lower levels of entrepreneurship and educational attainment, environmental degradation, poor health outcomes, and limitations of other economic opportunities (Carley & Konisky, 2020; Deaton & Niman, 2012; James & Aadland, 2011). Given the generational challenges that coal-dependent regions already face, the industry's change in recent decades due to automation and increased regulation has left communities reeling. As an illustration, the closures of two coal-fired power plants in Adams County, Ohio resulted in significant job and tax revenue loss in the Appalachian region (Jolley et al., 2019). In response, the Partnerships for Opportunity and Workforce and Economic Revitalization (POWER) Initiative was launched in 2015 to ease the economic effects of energy transitions in coal-dependent U.S. communities, especially in the Appalachian region (Congressional Research Service, 2019b). Current programs under the POWER Initiative include the Assistance to Coal Communities program within the Economic Development Administration (EDA), the POWER Initiative under ARC, and a funding program for abandoned mine land reclamation.
Though natural oil and gas production is sensitive to market volatility, it still provides, at least in the short term, opportunities for regional economies. Oil and gas producing regions in the United States enjoy significant economic growth during boom times—increased investment, employment, and household income (Weinstein, 2014). However, when oil or gas prices drop, local and state economies face declines in income and tax revenue (Baffes et al., 2015). While the federal government has established programs to assist with long-term economic decline in some coal, military, and trade-impacted communities, no analogous program exists for supporting oil and gas communities experiencing economic volatility, though such programs would be instrumental in supporting long-term economic diversification and increasing resiliency of these communities (Raimi et al., 2019). Given these links between fossil fuel production and economic development, we include information on the number of coal mines and production, as well as natural gas and oil production. We also include abandoned mines as part of hazardous sites available through the U.S. Environmental Protection Agency (EPA) in the Challenges section.
Opportunities
Next, we examine the link between economic development and opportunities, which, in this paper, includes universities, hospitals, renewable energy (i.e., solar, wind, and geothermal), and recreational assets. Universities and hospitals have functioned as anchor institutions, especially in rural areas, where they are often a county's biggest employer, and attract spending from neighboring counties (Ehlenz, 2018; Vize, 2018). Universities provide educational opportunities, which, in turn, can raise the income of residents, as well as the income stream of graduates who stay to work in the area (Beck et al., 1995). Additional benefits include entrepreneurship, as well as university-industry collaboration and local and regional spillover effects on innovation, production, and others (Bagchi-Sen & Smith, 2012; Harper-Anderson & Lewis, 2018). Similarly, hospitals work to improve the physical, social, and economic environments in their regions. Research hospitals are a key component of the knowledge-based economy supporting an experienced and educated workforce, as well as local innovation (Nelson, 2009). These anchor institutions are often engaged in partnerships to strengthen or revitalize nearby neighborhoods, where funding is secured through a combination of resources and programs, such as the EDA's revolving loan fund program and federal historic and new market tax credits (U.S. Department of Housing and Urban Development, 2020). Moreover, the U.S. Department of Housing and Urban Development (HUD) administers programs that insures mortgages for hospitals to facilitate construction and programs for historically Black colleges and universities, tribal, and Hispanic institutions to address community development needs, as well as general programs like capacity building for sustainable communities (U.S. Department of Housing and Urban Development, 2016). Given these links between anchor institutions and economic development, we include information on the number of universities enrolling more than 1,000 students, the number of full-time students, and the number of critical-access hospitals and general acute hospitals.
Traditionally, U.S. electricity generation in the has relied on large, centralized assets, such as coal-fired or nuclear power plants, to achieve economies of scale and supply cheap, reliable power to consumers (Sovacool, 2009). However, supply-side factors, such as the relative price competitiveness of alternative energy sources, environmental/pollution regulations, and others (e.g., Jenner et al., 2012), have triggered decline in sectors like the coal industry (Carley & Konisky, 2020). Subsequent and rapid investments in new, lower-carbon energy resources have stemmed from state policy mandates and corporate sustainability desires, among other reasons, representing additional demand-side drivers of the contemporary energy transition (Essletzbichler, 2012; Michaud & Pitt, 2019). Large renewable energy facilities (e.g., solar and wind farms) are increasingly being deployed throughout the United States, with tens of thousands of projects currently in operation (e.g., Solar Energy Industries Association, 2020). These developments have helped create job opportunities, tax revenues, and other positive economic/environmental implications (Pitt & Michaud, 2015). Once more, USDA played a role by funding programs to complete energy audits, for renewable energy development assistance, and to make energy efficiency improvements (U.S. Department of Agriculture, 2020a). Other agencies, such as the U.S. Department of Energy (DOE), administer similar programs, though not specifically targeted at rural areas. Given these links between renewable energy and economic development, we include information on solar irradiation, onshore wind favorability, and deep enhanced geothermal favorability.
Finally, recreational spending contributes substantially to employment and value added in rural areas, making outdoor recreation a viable rural economic development strategy (Bergstrom et al., 1990). Moreover, recreation and tourism development contributes to rural well-being, increased local employment and wages, reduced poverty, and improved education and health (Reeder & Brown, 2005). Recreational assets can incentivize retirees to move into specific areas. Some states use an economic development tool, the Certified Retirement Community designation (CRC), to promote select communities within their state (Grassberger & Lillywhite, 2019). The communities are scored on local medical care, continuing education, broadband, and recreational areas, among other items (Texas Department of Agriculture, 2014). Similarly, the EPA administers the Economy for Rural Communities, a planning assistance program to help communities develop strategies to revitalize their “main streets” through outdoor recreation (U.S. Environmental Protection Agency, 2019). Given these links between tourism and economic development, we include information on the number of federal and state forests/parks, recreation employment share, and an indicator for coastal access.
Challenges
Finally, we examine the link between economic development and challenges such as industry dependency, deteriorating infrastructure, the availability of skilled labor, and access to capital. Promoting economic diversification has long been an economic development strategy aimed at decreasing dependence on one or two industries, and, consequently, the sensitivity to boom and bust cycles (Reeder, 2006). Manufacturing employment in the United States has dropped in the last decade due to trade policy and shifts to less labor-intensive production (Pierce & Schott, 2016). Thus, regions heavily reliant on manufacturing (e.g., the U.S. Rust Belt) have been hit the hardest. True to its mission of investing in economically distressed communities, the EDA provides funds to help support the growth of promising manufacturing businesses to promote diversification (U.S. Economic Development Administration, 2019). Given these links between manufacturing and the need for economic development, we include information on share of manufacturing employment. Also, we include a Herfindahl–Hirschman Index (HHI) as a measure of industry concentration, calculated using employment share in a given industry instead of firms’ market share.
Deteriorating infrastructure negatively impacts production and makes it more challenging for producers to meet domestic and global demand (Hallstead & Deller, 2009). According to the American Road & Transportation Builders Association (2020), over one-third of U.S. bridges need repair work or replacement. The U.S. Department of Transportation administers the Infrastructure for Rebuilding America discretionary grant program, which made more than $900 million in infrastructure investments available in 2020 (U.S. Department of Transportation, 2020). In addition, the USDA funds projects focused on improving rural America's infrastructure (U.S. Department of Agriculture, 2017).
Vacant and abandoned properties, including retired power plants, have created challenges for communities (Schilling & Logan, 2008). However, taking advantage of programs to convert such vacant properties to community assets can greatly benefit a region. As an example, after cleanups, property values can increase by an average of 5.0% to 11.5%, yielding positive and highly localized effects on housing prices (Haninger et al., 2017). Cleanups of hazardous sites, which includes retired mines and power plants, can also have positive ripple effects on nearby communities and lead to increased assessed property values that result in increased tax revenue (Kotval-K, 2016). In addition to the abandoned mine land reclamation program under the POWER Initiative, the EPA, in partnership with HUD and the Departments of Transportation and Energy, administer programs to redevelop hazardous sites (see U.S. Environmental Protection Agency, 2020).
Beyond the impact of broadband on agriculture, its expansion has increased households’ access to telehealth, K–12 remote education, and telecommuting, as well as access to online marketplaces (Raimi et al., 2021; U.S. Department of Agriculture, 2019a). In addition to the USDA funding, the Federal Communications Commission (2019) offers grants for broadband expansion. Given these links between infrastructure and economic development, we include data on quality of bridges, aging power plants, hazardous sites, and broadband.
Globalization and technology-induced changes, such as automation and digitization, have altered the U.S. industry and jobs landscape, and, consequently, the skills required to perform those jobs. According to a 2015 McKinsey Global Institute report on the impact of digitization on the U.S. economy, the speed of technology-induced skill displacement has been projected to double over the next decade (McKinsey & Company, 2015). Roughly 50% of workforce activities could be automated with existing technologies, but only 15% have been automated to date (Cheng et al., 2018). It has been projected that more than 30% of U.S. workers will need to change jobs or upgrade their skills significantly by 2030, and that 65% of today's primary school students will hold jobs that do not exist today (Cheng et al., 2018). Thus, the U.S. Department of Labor, in coordination with the U.S. Departments of Education and Health and Human Services, collaborated to enact the Workforce Innovation and Opportunity Act (WIOA; U.S. Department of Labor, 2020b). WIOA is designed to help job seekers access employment, education, training, and support services to succeed in the labor market, and to match employers with the skilled workers they need to compete in the global economy (U.S. Department of Labor, 2020a). Given these links between workers’ skills and economic development, we include information on educational attainment, average annual wage, and unemployment rates.
Finally, access to capital plays a direct role in small business growth (Rupasingha & Wang, 2017). Limited access to financing restricts the ability of businesses to generate new jobs and, consequently, to contribute to the economic development of the communities in which they operate (Bates & Robb, 2013; Burton, 2017). To address this need, the U.S. Small Business Administration administers several programs to support small businesses, including venture capital programs and technical assistance training programs (Congressional Research Service, 2019a). Given these links between access to capital and economic development, we include information on the number and dollar amount of loans.
Unsupervised Machine Learning
In this paper, our goal is to detect data patterns, using unsupervised ML, which allows for a better grouping of counties than the current dichotomous rural-urban classification. ML develops algorithms designed to be applied to data sets, with the main areas of focus being prediction, classification, and clustering (Goldfarb et al., 2019). ML can be divided into two central branches: unsupervised and supervised. Unsupervised ML involves finding clusters of observations that are dimensionally similar and identifying patterns too subtle to be detected by human observation (Luca et al., 2016). It has been used to study the impact of state fiscal centralization and intergovernmental aid on local government's efforts to raise revenue (Warner & Pratt, 2005), to automatically assign occupations to job titles (Ikudo et al., 2019), and to classify chief executive officer behavior (Bandiera et al., 2020), among other applications. In the regional science sphere, ML has been applied to study industry clusters, socioenvironmental resilience, and disaster impact analysis, among other topics (Schintler & Chen, 2017). The regional science literature has also applied ML techniques to questions of polarizations in urban areas (Morales et al., 2019) and delineation issues (Hamilton & Rae, 2020; Rae & Nelson, 2017).
Some clustering methods simply partition the data, while others are hierarchal. We opt to use agglomerative hierarchical clustering, which starts with every point in its own cluster. The algorithm then merges the closest pairs of clusters based on the distances between them. This is an iterative process that continues until all observations are merged into one cluster. The layered categorization of counties, possible through hierarchal clustering, allows us to have overlapping challenges and opportunities across counties, as well as idiosyncratic challenges and opportunities specific to a county (or a small number of counties). Clustering algorithms vary in how distance is measured between observations and between clusters. A measure of distance between observations measures the distance between different multidimensional points. The squared Euclidean distance used here is commonly used to measure distance between observations (Patel & Mehta, 2011). Distance between groups is measured in one of four ways: (1) single linkage, which minimizes the distance between the closest observations in distinct clusters; (2) complete linkage, which minimizes the distance between the farthest observations in distinct clusters; (3) average linkage, which minimizes the average of the distances of all observations between distinct clusters; and (4) Ward's linkage, which minimizes the sum of squared differences within clusters (Mullner, 2011). In this paper, we opt to use Ward's linkage, an agglomerative clustering algorithm, which first merges very similar observations, and then incrementally builds larger clusters out of smaller clusters. 1
To avoid a clustering driven by urban observations that overpower rural observations, we cluster metropolitan counties separately from nonmetropolitan counties. After examining both the Duda-Hart index ratio and Caliński and Harabasz pseudo-F index, we cut the dendrogram at 18 and 4 specific clusters for nonmetropolitan and metropolitan counties, respectively. 2 We chose a cutoff that provided a larger number of clusters for nonmetropolitan counties to fit with the rural focus of this paper. Note that this cluster cutoff is for the purpose of illustrating the geographical groupings that emerge, and the characteristics of those groupings, in a tractable manner. However, when populating an interactive tool with the goal of informing practitioners’ plans, we would opt to provide groupings that are more granular. Geovisualization approaches to big data analysis provide instantly useful information (Rae & Nelson, 2017). In the next section, we discuss the results from clustering the 3,141 U.S. counties, using information on county characteristics, operationalized into 34 variables that were normalized to ensure that they are on the same scale, a common preparatory approach prior to clustering.
Results
Here, we illustrate how unsupervised ML can be applied to the wealth of existing and publicly available data to obtain economic development strategies-based grouping of counties than can substitute for the dichotomous and commonly used urban/rural classifications. To better illustrate and interpret the 18 nonmetropolitan clusters, and due to the nature of our hierarchal clustering, we aggregate the 18 clusters into four major groupings: Capital Needs, Transitioning, Agriculture and Tourism, and Regional Hubs. These major groupings are named based on economic development strategies that the counties can adopt. The Capital Needs grouping is of counties that need to invest in education, infrastructure, and broadband. Transitioning are high fossil-fuel producing counties that need to invest in diversification. Agriculture and Tourism counties are those that can benefit from investing in developing food systems programs and/or agritourism, and/or CRC designation. Regional Hubs are counties that can benefit from investing in their anchor institutions.
Table 1 presents descriptives for each of the nonmetropolitan aggregate groupings, as well as the metropolitan areas. 3 Tables A.6 through A.9 in the online Appendix present descriptives for each of the 18 clusters nested with the four groupings. Note that in Table A.7, we combine three clusters into one for tractability; one of those clusters was only one county, while the other was only three counties. Thus, effectively, we have four nested clusters under each major grouping, or 16 discussed/illustrated clusters in total. The nested clusters are all named Tier 1 through Tier 4, with Tier 1 indicating the highest level of need, and Tier 4 indicating the higher availability of access to capital and connectivity, among other positive attributes.
Descriptives for Metropolitan Counties and Four Major Groupings of Nonmetropolitan Counties.
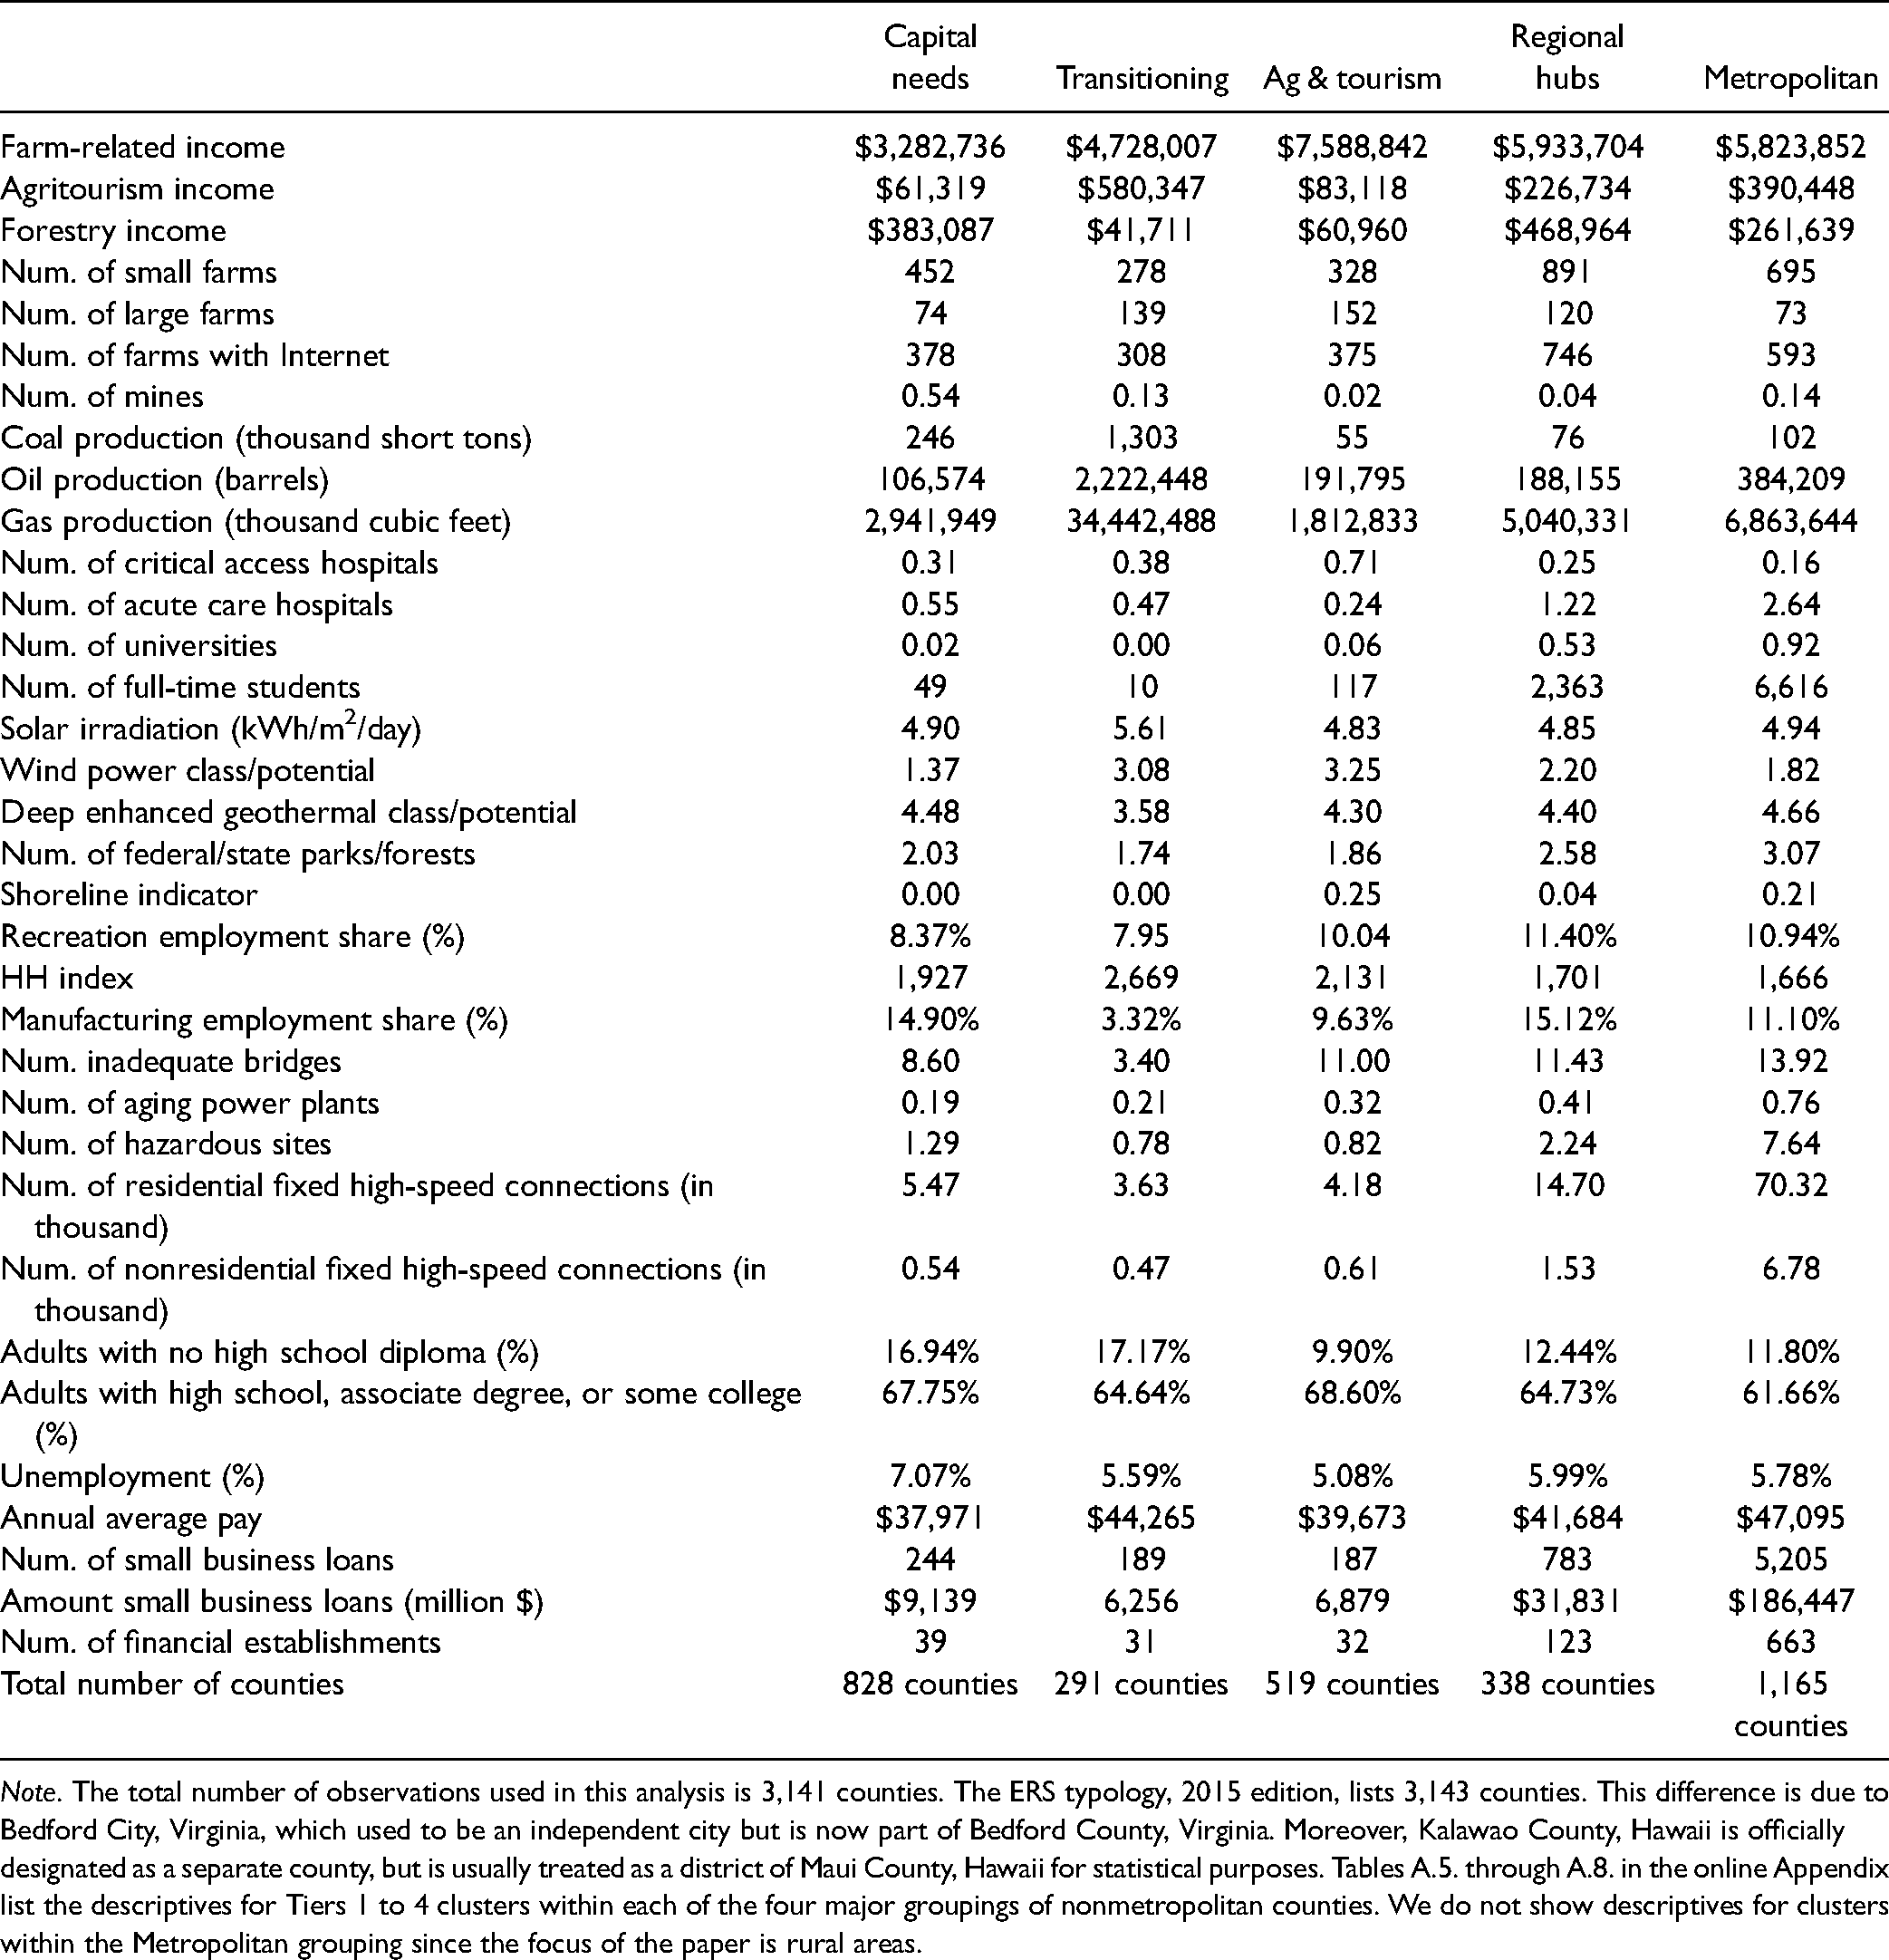
Note. The total number of observations used in this analysis is 3,141 counties. The ERS typology, 2015 edition, lists 3,143 counties. This difference is due to Bedford City, Virginia, which used to be an independent city but is now part of Bedford County, Virginia. Moreover, Kalawao County, Hawaii is officially designated as a separate county, but is usually treated as a district of Maui County, Hawaii for statistical purposes. Tables A.5. through A.8. in the online Appendix list the descriptives for Tiers 1 to 4 clusters within each of the four major groupings of nonmetropolitan counties. We do not show descriptives for clusters within the Metropolitan grouping since the focus of the paper is rural areas.
Figure 4 geographically displays the 16 clusters of nonmetropolitan counties and four clusters of metropolitan counties. To illustrate county-specific differences, we first examine two counties in Maine: Aroostook and Franklin. Under the USDA-ERS classification, Aroostook was classified as a nonspecialized county and Franklin was classified as a recreation-dependent county. Under our hierarchical clusters terminology, Aroostook belongs to Tier 3 of the Regional Hubs cluster, while Franklin belongs to Tier 2 of the same cluster.

Clusters of U.S. Counties based on economic development strategies. Note. Figure 4 illustrates the economic development strategies clusters (i.e., Capital Needs, Transitioning, Agriculture and Tourism, and Regional Hubs), as well as a grouping of metropolitan counties. Four tiers are nested within each cluster, with Tier 1 indicating the highest level of need and Tier 4 indicating the higher availability of access to capital and connectivity, among other positive attributes. Developed by authors using ArcGIS Pro.
Aroostook's classification in a higher tier is validated by looking at the counties’ dimensions. Aroostook County receives nearly $7 million in farm income, ranking it as the top agricultural county in Maine and the 18th-highest potato producer in the United States. In contrast, Franklin County only receives $691,000 in farm income. Examining opportunities in detail, we find that Aroostook has one critical hospital and three general acute-care hospitals, while Franklin only has one general acute-care hospital and one university. 4 Moreover, Franklin is in greater need of infrastructure investments, having lower broadband connectivity and more bridges in need of maintenance. Thus, Franklin County can benefit from pursuing funding that addresses its physical capital needs. Both counties can benefit from investing in their anchor institutions (i.e., hospitals and universities), which can ensure that these counties continue to have a reliable source of employment, as well as provide the means for these institutions to expand and continue to contribute to their region's economic development.
Next, we analyze the motivating Ohio example previously mentioned. As noted, Adams, Muskingum, and Washington counties are all classified as rural, nonspecialized Ohio counties. Under our hierarchical clusters terminology, Adams belongs to Tier 2 of the Capital Needs cluster, whereas Muskingum and Washington both belong to Tier 1 of the Regional Hubs cluster. All three counties (Adams, Muskingum, and Washington) receive farm income, at $3.9 million, $4.1 million, and $2.2 million, respectively. Muskingum and Washington produce oil and gas, while Adams has no fossil fuel production. We also observe that Adams and Washington have one critical hospital each. Muskingum and Washington each have one general acute-care hospital and one higher education institution. Further, Adams is in greater need of human and physical capital investments, having lower broadband connectivity, at about 7,000 residential fixed high-speed connections, compared to 18,000 for Washington and 25,000 for Muskingum. Of the population aged 25 and older in Adams County, 87% do not have a college degree, compared to 81% in Washington County and 85% in Muskingum County. The disparity in education level is also observed in annual wages: the average wage is $39,898 in Adams, $48,240 in Washington, and $41,710 in Muskingum. Adams County would greatly benefit from investing in its human capital. Further, Adams County enjoys a solar irradiance (4.61 kWh/m2/day) higher than the Ohio average (4.42 kWh/m2/day), which would make investments in solar energy attractive, especially given the associated county benefits in the form of additional fiscal revenue.
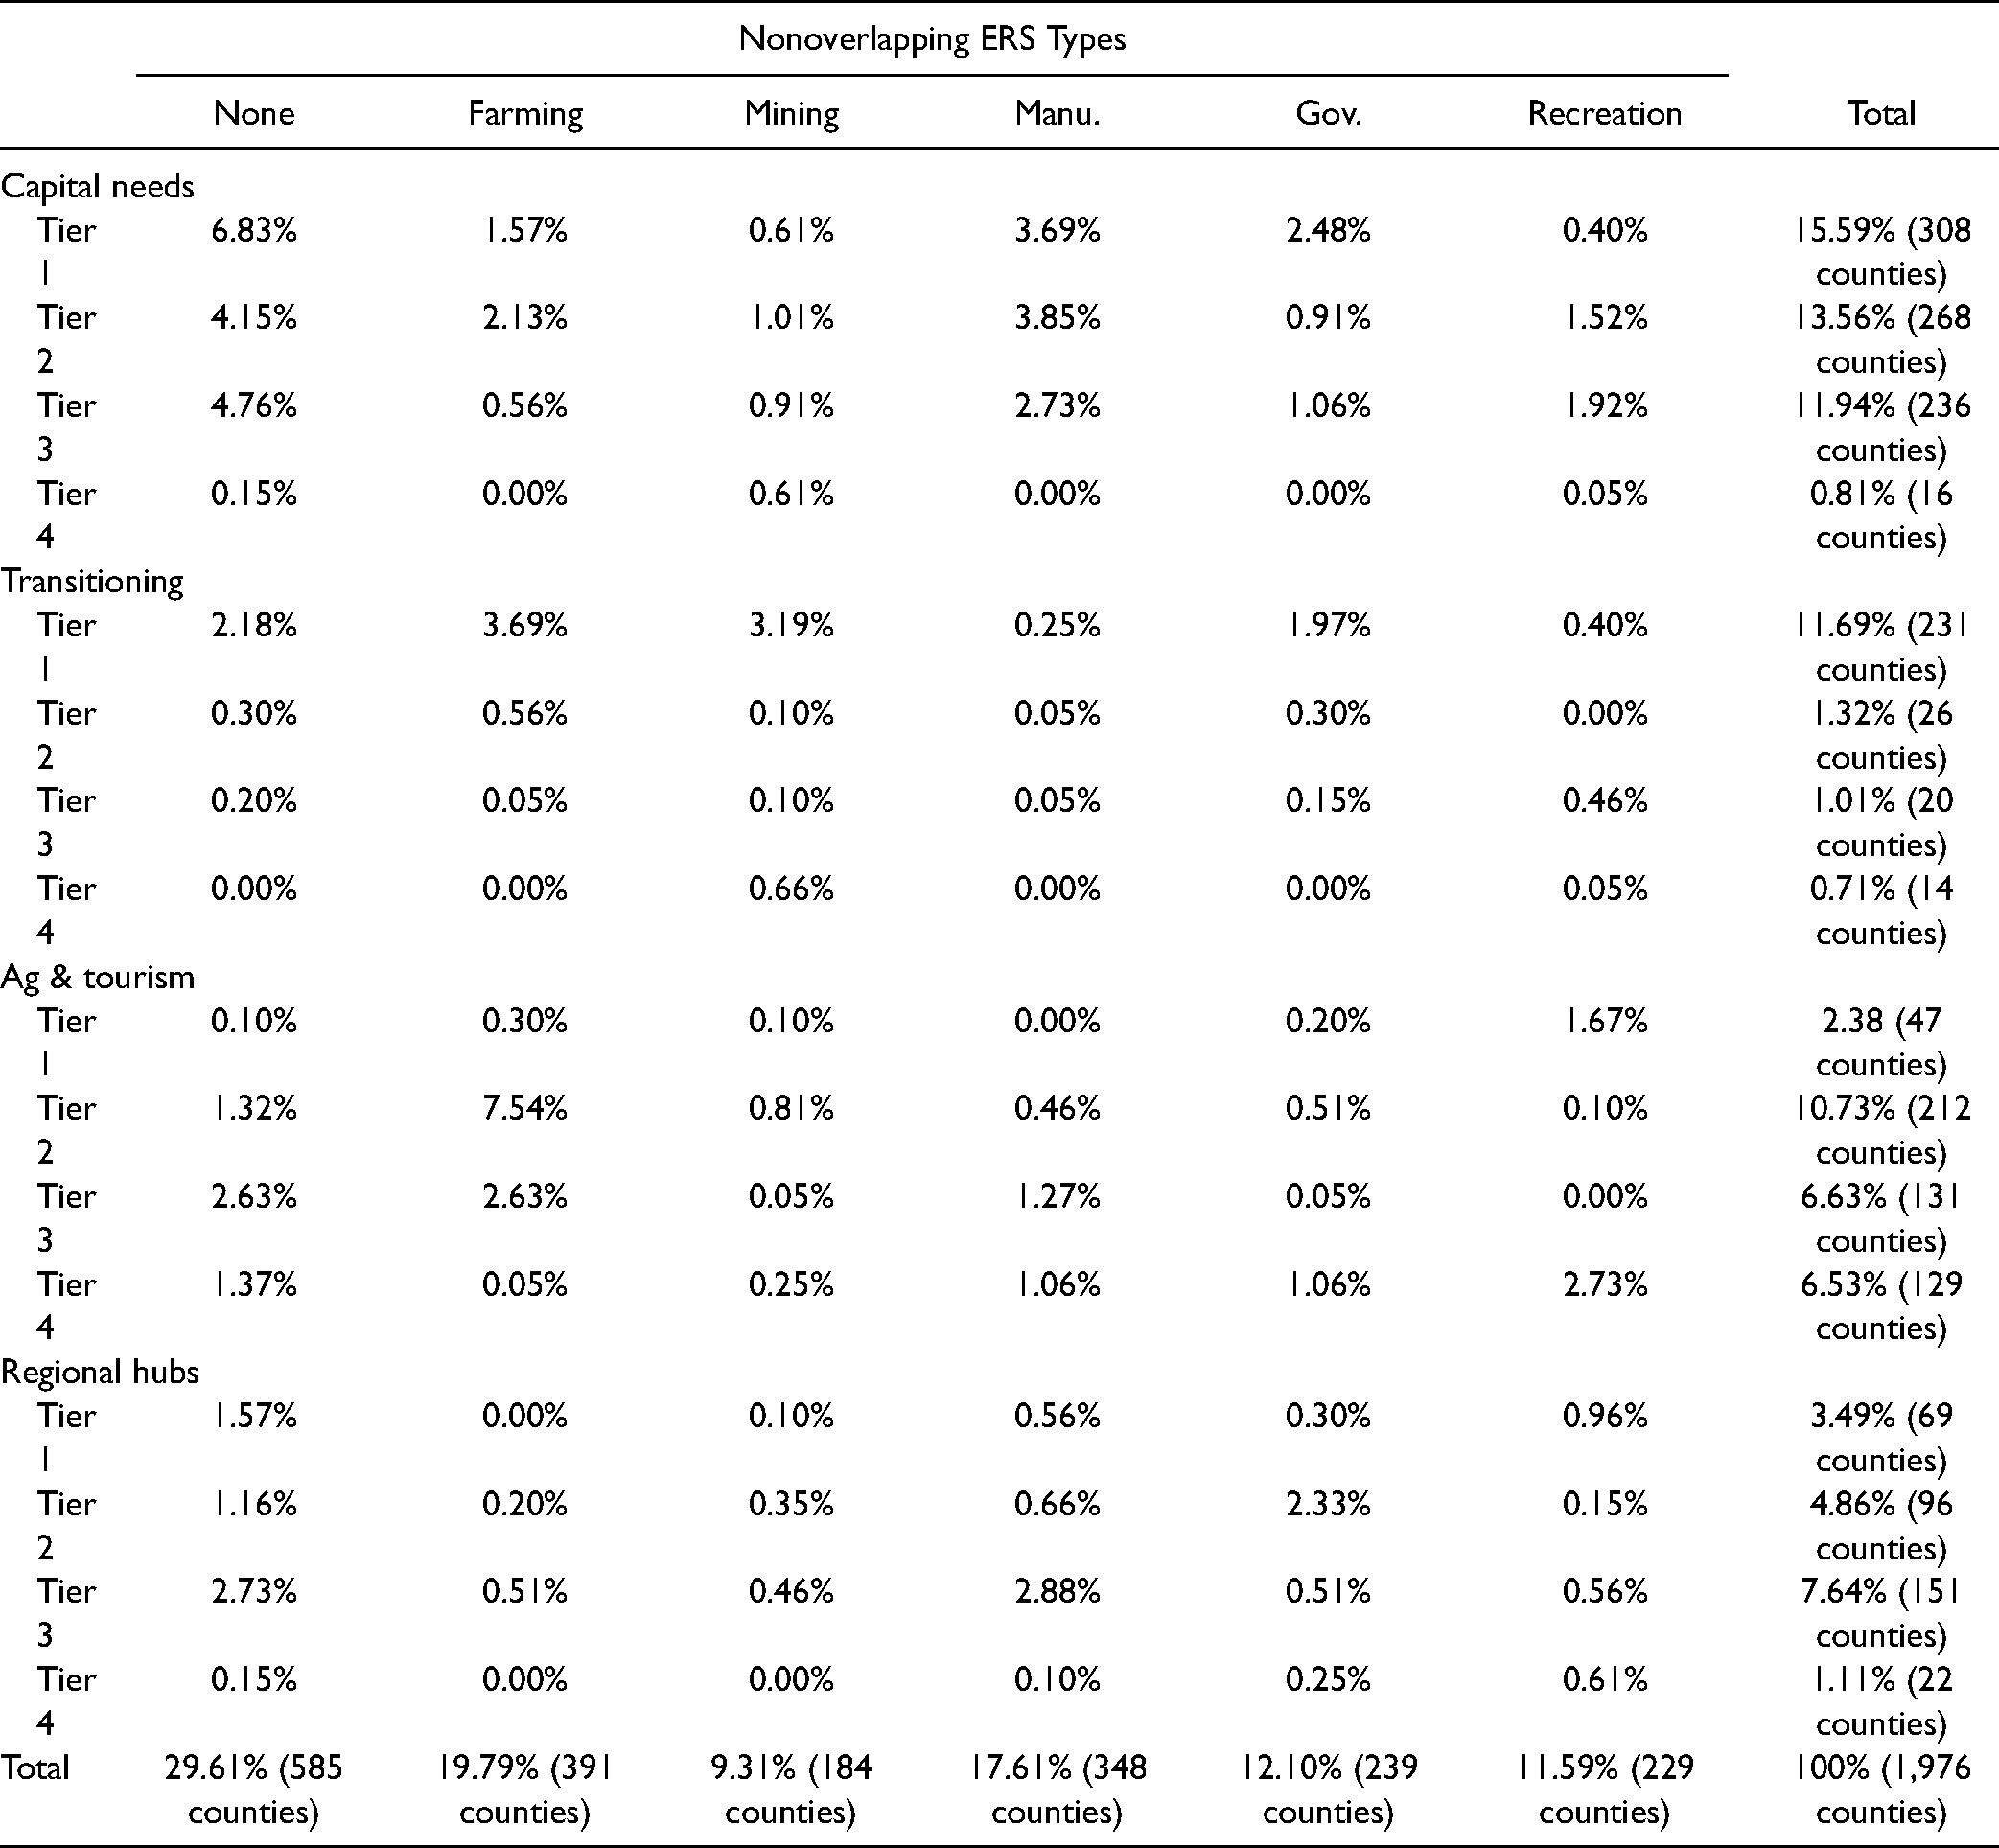
Table 2 compares the classification of nonmetropolitan counties under ERS nonoverlapping economic types to the groupings that emerged in this paper. Here, we find that about 16% of all nonmetropolitan counties, classified as nonspecialized under the ERS classification, belong to our Capital Needs cluster. In addition, over 10% of all nonmetropolitan counties classified as manufacturing dependent under the ERS classification, belong to our Capital Needs cluster. Further, we find that about 4% of all nonmetropolitan counties classified as farming dependent and over 3% classified as mining dependent under the ERS classification, belong to our Transitioning cluster. About 10% of all nonmetropolitan counties classified as farming dependent and about 3% classified as recreation dependent within the ERS classification, belong to our Agriculture and Tourism cluster. Some overlap exists between the ERS and our groupings. However, our groupings take into account industry dependency and other variables proxying for a region's specific needs and opportunities.
Comparing Classification of Nonmetropolitan Counties Under ERS Nonoverlapping Economic Types Versus the Researchers’ Groupings.
Finally, to illustrate how our clustering is better suited to help identify challenges, opportunities, and, subsequently, optimal economic development strategies, we examine two outcomes of interest by cluster and typology. The economic development strategies clustering identifies Tier 2 counties, belonging to the Transitioning (26 counties) and Agriculture and Tourism (212 counties) clusters as the ones with least broadband access. The ERS typology identifies 444 farming-dependent counties as the ones with least broadband access. Similarly, the economic development strategies clustering identifies Tier 1 through 3 counties (277 counties) belonging to the transitioning clusters as the ones with the most solar energy potential (an average irradiation above 5.4 kWh/m2/day). The ERS groupings dampen the irradiation score so that none of the groupings that exhibit an irradiation average above 5.3 kWh/m2/day are identified by the ERS typology as counties with solar potential (Figure 5).
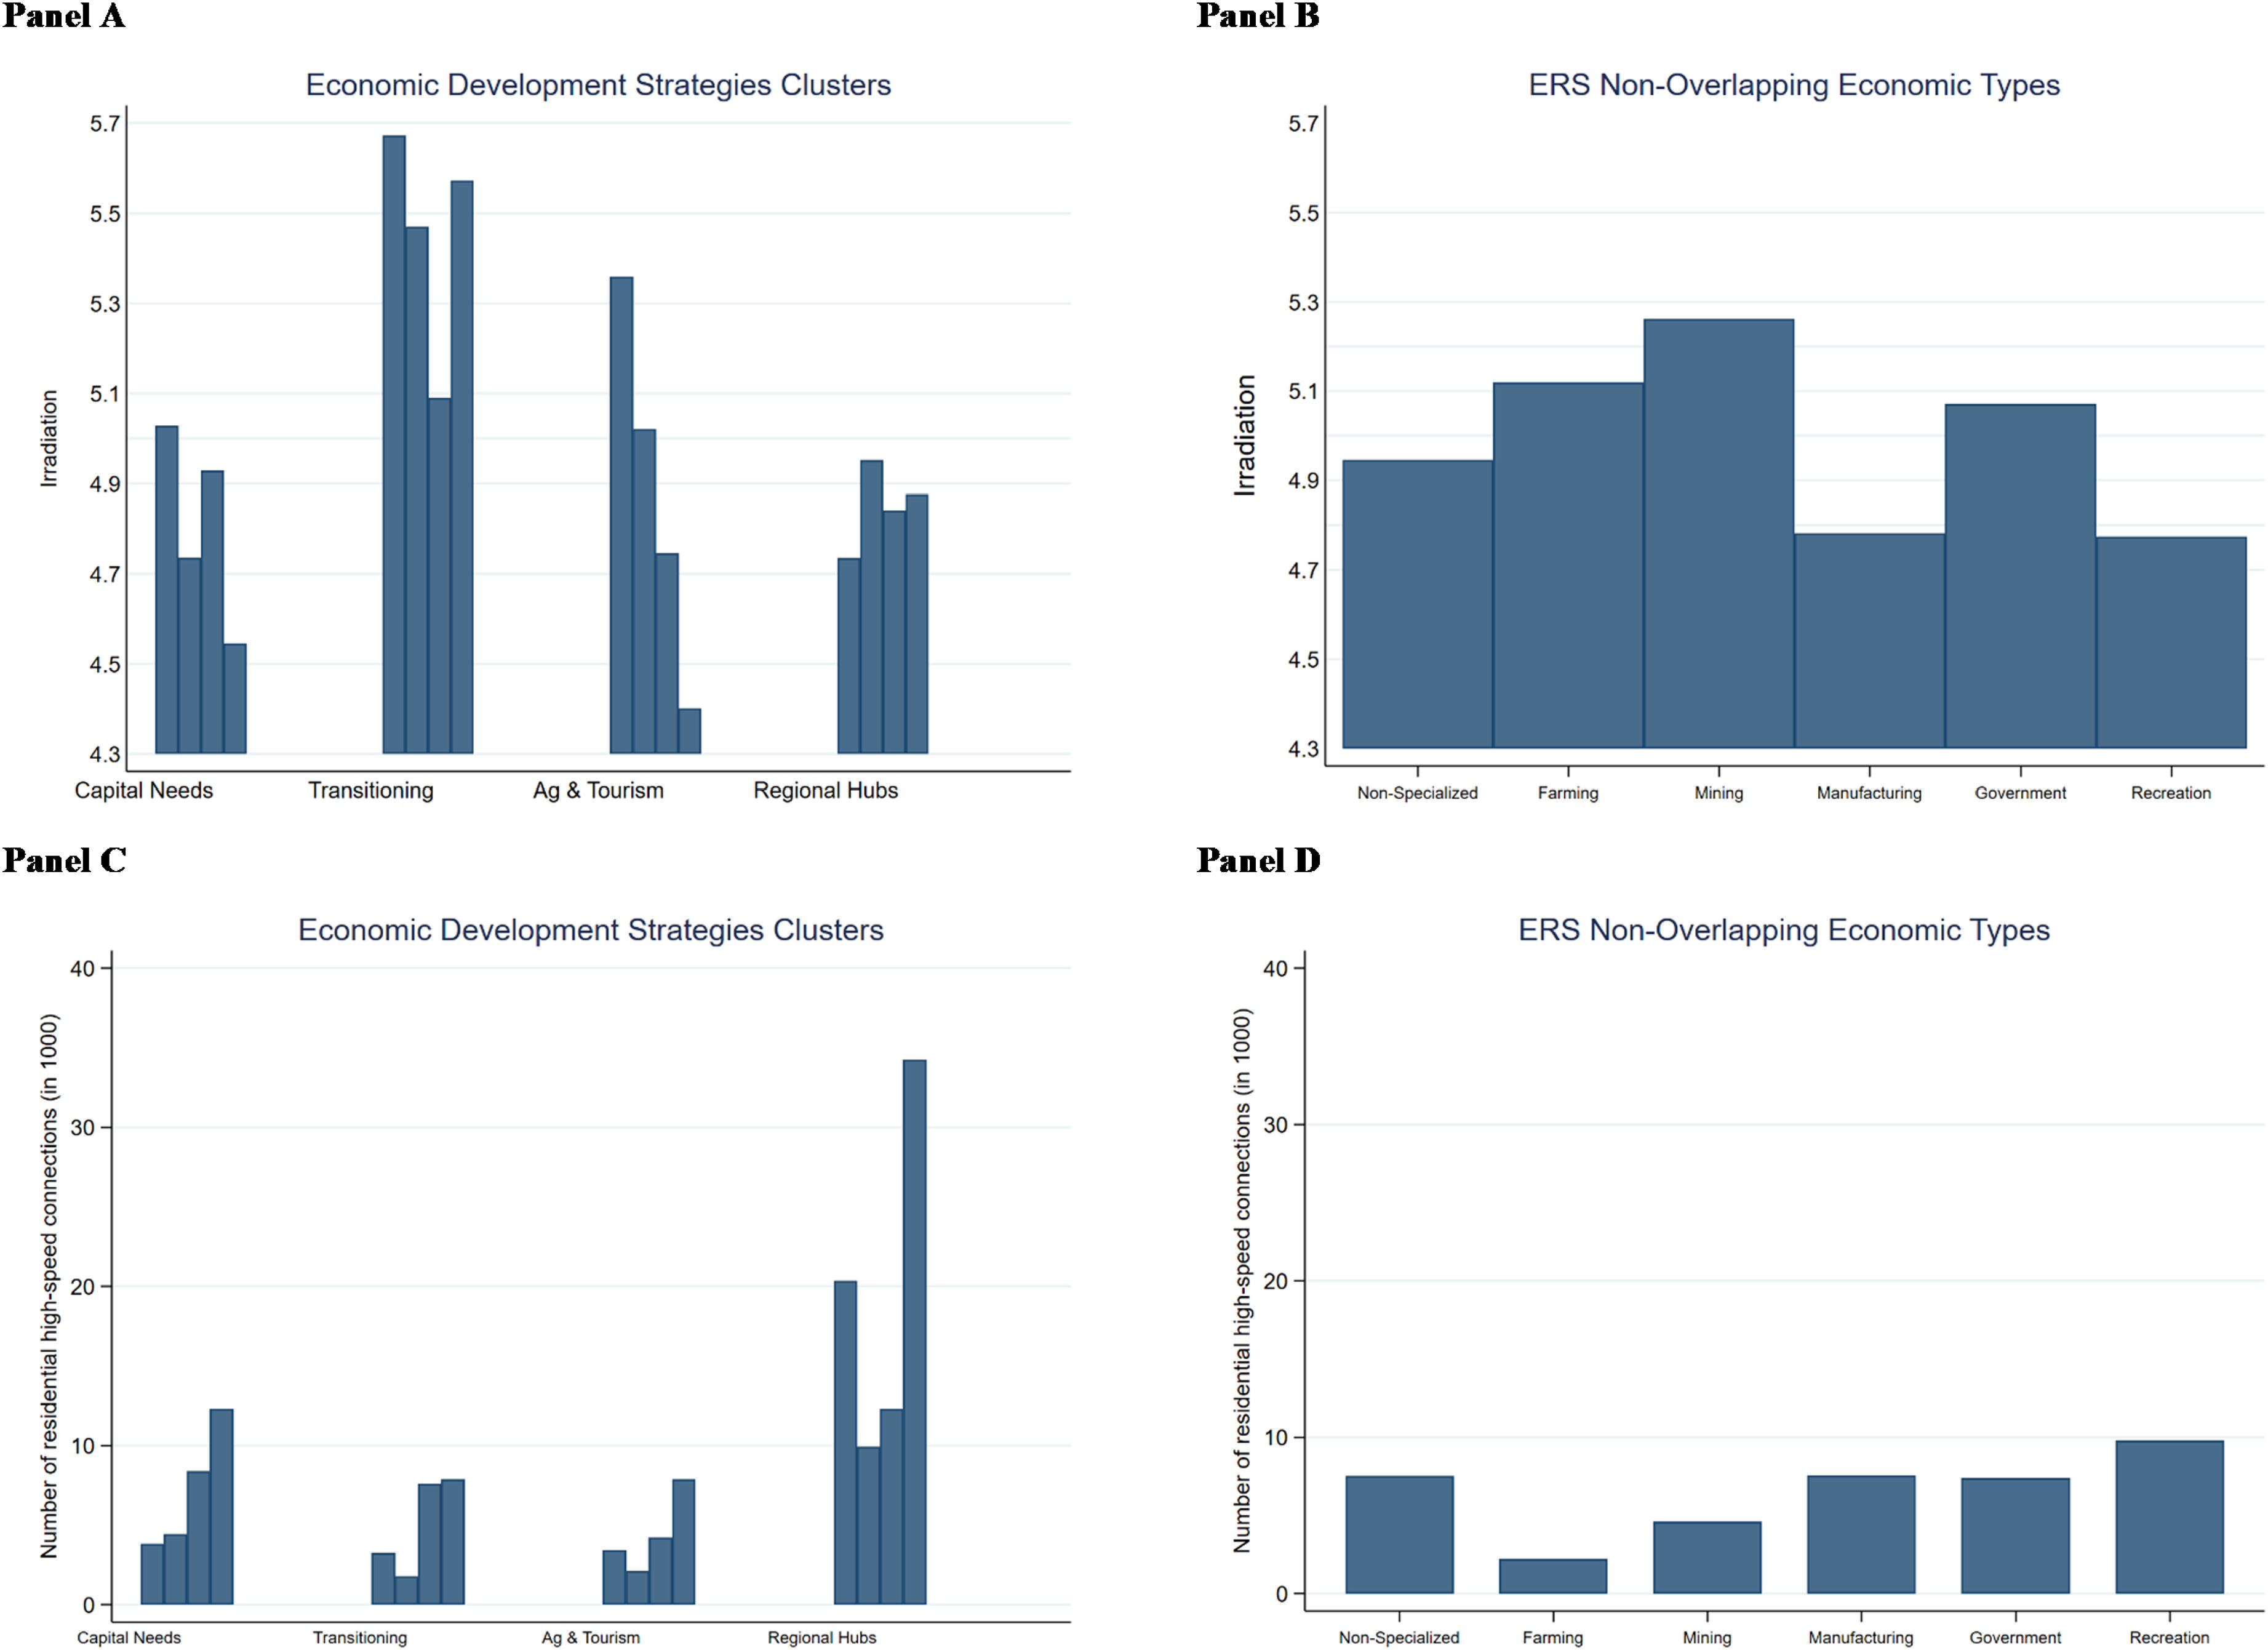
Outcomes of interest illustrated using the economic development strategies clustering versus the ERS classification. Note. Figure 5 illustrates outcomes of interest using the Economic Development Strategies Clustering versus the ERS classification. The four bars within each named grouping, in Panels A and C, represent the four tiers. Developed by authors using Stata 16.
Discussion and Implications
In this paper, we employed a cluster typology to illustrate the value of applying ML to publicly available data to discern valuable information that can inform highly localized economic development strategies. Our methods add to the literature on the definition of the term rural, as well as to the current rural classification approaches, by simultaneously accounting for key infrastructure and institutions (or lack thereof), instead of separately or exclusively examining population characteristics or economic dependence. Our methods can provide more granular data and useful information to practitioners, policy makers, and many others to better target firm attraction/retention efforts, understand key grant and funding opportunity qualifiers, and strategize for broader economic development approaches.
Increasingly, economic development practitioners are focusing on place-based responses to improve opportunities for communities, so it has become necessary to develop a typology for evaluating regional attributes, especially in U.S. rural areas, given the noted lack of a uniform definition. Often, there is no single best strategy for successful local economic development since all regions or jurisdictions have their own unique economic base and suite of local institutions (Bartik, 2003). Consequently, grouping geographic areas based on their idiosyncrasies can positively contribute to successful local economic development efforts by providing communities with a method for identifying comparable communities that could benefit from pooled resources and shared experiences. In fact, such place-based development strategies, which are typically geographically targeted at underperforming areas, have already shown the benefits of infrastructure expenditure and investment in higher education (Neumark & Simpson, 2015).
Our analysis serves as an initial step toward a more layered approach to defining a regional typology. As practitioners continue to seek data and approaches to capitalize on regional strengths, ML may be a feasible-to-execute approach to induce community and economic progress. Further, the described clustering methods can better inform agile and local policy response in times of crisis by making relevant information immediately available to stakeholders. Having access to information in a uniform place can help practitioners understand local identity, development strategies, and emergency response approaches.
We acknowledge that this paper has not necessarily developed a new, rigid definition of the term rural per se, yet the employed data set and methods offer an encouraging path forward for additional research to address the definitional challenges of rurality, depending on data included, measurement, geography, clusters desired, and many other intricacies. Future research might consider the link between economic development and variables such as tax structure, weather conditions, or housing stock. For instance, as it pertains to the link between tax structure and economic development, a Michigan program that provides tax credits to businesses in the state's export industries was shown to be a highly successful economic development strategy (Bartik & Erickcek, 2010). Moreover, fiscal activity is heterogeneous across counties and constitutes an important characteristic that requires future focus. To illustrate, Appalachia and the U.S. South have been characterized by low fiscal effort, state aid, and state centralization, while the Northeast and Midwest have a stronger tradition of state investment, aid, and centralization, which positively has impacted local fiscal efforts (Xu & Warner, 2016).
Despite data limitations or circumstantial variable selection strategies, the value added by this paper is to illustrate how publicly available data can be leveraged to drive economic development approaches that incorporate equity, retention, and connectivity. Economic challenges have historically disproportionately affected rural areas, and the use of advanced data, regional coordination, and strategic and targeted investments provides great promise for place-based economic development. Of course, as with most applications of ML, our paper presents a compromised typology of sociospatial characteristics rather than a uniform truth. Nevertheless, it creates a practical research tool for the articulation of specific aspects of rural areas.
Footnotes
Author Note
The authors acknowledge the anonymous referees for their comments, as well as the W.E. Upjohn Institute, the Federal Reserve Bank of Chicago, and The Citizens Research Council of Michigan, who convened a pre-conference meeting on rural economic development in 2019, where the authors received helpful feedback on the data and methods contained in this paper.
The authors declared no potential conflicts of interest with respect to the research, authorship, and/or publication of this article.
Declaration of Conflicting Interests
The author(s) declared no potential conflicts of interest with respect to the research, authorship, and/or publication of this article.
Funding
The author(s) received no financial support for the research, authorship and/or publication of this article.

Supplemental Material
Supplemental material for this article is available online.
Notes
Author Biographies
References
Supplementary Material
Please find the following supplemental material available below.
For Open Access articles published under a Creative Commons License, all supplemental material carries the same license as the article it is associated with.
For non-Open Access articles published, all supplemental material carries a non-exclusive license, and permission requests for re-use of supplemental material or any part of supplemental material shall be sent directly to the copyright owner as specified in the copyright notice associated with the article.
