
Abstract
We are starting to understand the magnitude of economic damage from the COVID-19 pandemic. Current estimates cover the national or state level, but tell us little about how massive business closures may be affecting urban vitality at the intrametropolitan level. A particular concern is whether urban areas with high poor or minority populations are more deeply affected. This paper combines InfoGroup Historic Business Data and Google Map API to analyze business closures at the neighborhood level in Franklin County, Ohio, encompassing the Columbus Metropolitan Area. As expected, retail and restaurant sectors had the highest number of closures, but closure rates were higher in other sectors. Descriptive and multivariate analyzes reveal that downtown Columbus has been severely affected, but no disadvantaging effect for communities of color or neighborhoods with concentrations of poor residents is found to be statistically significant.
The COVID-19 pandemic has created an unprecedented level of stress on the United States’ economy with lockdowns, stay-at-home orders, and limited business hours in addition to the direct health impacts of severe illness and death. Various scholars and business organizations have generated estimates of employment loss and business closures at national and state levels; but there is little information about whether this general economic distress is driving specifically toward urban crises. If certain sectors and neighborhoods are more affected by business closures, there will be concentrated employment loss for specific populations, as well as a loss of vitality at the urban neighborhood level. A question of major concern is whether the effects on neighborhoods of color and/or poor neighborhoods are especially severe.
This study offers an estimate of business closures at the neighborhood level. It integrates InfoGroup Historic Business Data and Google Map API to focus on Franklin County, Ohio, the home of the Columbus Metropolitan Area. While both InfoGroup and Google Map data are large and widely used, they come with limitations, and the purpose of this article is to provide the best estimate with relatively reasonable and timely data. As expected, retail and restaurant sectors record the highest number of business closures, but rates of closure are even higher for educational services and arts and recreation. These sectoral patterns may have correlations with neighborhoods since some neighborhoods may host more of these vulnerable sectors. The results of multivariate analysis controlling for sector and neighborhood factors, in addition to firm size according to revenue, do not demonstrate amplified effects on neighborhoods with high populations of people of color or low-income households. In fact, neighborhoods with Latinx residents appear to have lower business closure rates. The hardest hit area is the downtown area of Columbus, which suffered the double shock of COVID-19 and police clashes with Black Lives Matter demonstrators.
Literature Review
There has been a tradition of economic and management studies that examined business closures by identifying survival rates according to industry, capital intensity (i.e., firm size), and firm age (Caves, 1998; Penrose, 1952; Williamson, 1991). Other studies considered how business owners’ characteristics affected firm survival or success (Bosma et al., 2004; Gimeno et al., 1997; Honig, 1998). More recent work distinguished between successful and unsuccessful closures. Successful business closures were defined as those for which owners may have planned an exit, sold a viable business, or simply retired–situations that are different from business failures (Headd, 2003). In general, scholars agreed that higher educational attainment and previous industry experience correlated with a lower likelihood of business failure, while minority status and certain industries, such as retail, construction, food, and accommodations, were associated with higher business closures (Bates, 2005; Coleman, 2007; Cressy, 1996; Robb & Watson, 2012).
With the current COVID-19 pandemic causing an unprecedented level of economic stress, scholars have begun to estimate the magnitude of business closures. Fairlie (2020) analyzed the decline of business owners under the Current Population Survey (CPS) and found that Blacks (−26%), Asians (−21%), and Latinx (−19%) owners suffered more than White owners (−11%) between February 2020 and May 2020. As to sectors, personal and laundry services (−48%) and arts and accommodations (−35%) experienced the greatest decline, followed by manufacturing (−26%) and restaurants (−24%). Couch et al. (2020) applied a difference-in-differences method, also based on the CPS, and found similar disparities based on race/ethnicity. Bartik et al. (2020) combined the CPS with data from two private firms: Homebase, which provides time clocks and scheduling software to small businesses, and Cronon, which tracks the same type of services to larger firms. Bartik et al. estimated the magnitude of April 2020 layoffs and tracked recovery as of July 2020. Nonacademic surveys, such as the Small Business Pulse Survey (U.S. Census Bureau, 2020c) and the Small Business Optimism Index (National Federation of Independent Businesses, 2020) also reported a massive decline in March and April with a slow, gradual recovery since June 2020. The Yelp website (2020) estimated the closure of 163,735 businesses nationwide as of August 31, 2020, with heavy concentration in the restaurant and retail sectors.
These estimates using traditional and nontraditional economic data are helpful, but they lack a geographic dimension. In other words, we know that businesses of certain kinds of owners tend to close more frequently, but that does not inform what may happen if a large number of those closures takes place concurrently at the subcity or neighborhood levels. The best geographic analysis so far is by states in Forsythe et al. (2020), which used the U.S. Bureau of Labor Statistics’ unemployment claims and job vacancy data collected by Burning Glass Technologies. They found employment contraction in every state, regardless of the timing of stay-at-home policies. Leisure/hospitality services and nonessential retail were the sectors most seriously affected.
It is likely that certain types of retail—clothing or furniture stores, for example—may be collocated in specific neighborhoods or blocks. Collective closures could cause not only massive loss of employment, but also substantial economic decline within an urban area. Moreover, a steep decline among minority-area businesses could exacerbate certain sectoral declines, potentially causing multiplier effects within a neighborhood. That, in turn, might lead to additional closures of grocery stores or personal services. This possibility frames the aim of this article: to analyze the effects of COVID-19 on business activities at the submetropolitan, neighborhood level.
Method
Estimating business closures during the COVID-19 pandemic is challenging because traditional economic data are unsuited to analysis at the substate level. For instance, the CPS sample is 100,000 households per year, which means an average of 20,000 samples per state. This does not permit analysis at the submetropolitan level.
The sample for this study combines two nontraditional sources. The first is InfoGroup Historic Business Data, which lists businesses and other organizations by name, industry description, revenues, employees, and year established, among other data. Most critically for this project, it lists geocoded and street-level address information that can be converted to any level of spatial unit, such as U.S. Census Bureau (USCB) tracts or neighborhood polygons. The second source is Google Map API, which lists business name, street address, and business closure status. Unfortunately, although Google (2020a) lists temporary and permanent closures, the difference between them is unclear. 1 Therefore, this study combined temporary and permanent closure data.
The case for this study is Franklin County, Ohio, the seat of the Columbus Metropolitan Area and the state capital. Columbus is a multicounty metropolitan area with a population of 2.1 million (U.S. Census Bureau, 2020a). Franklin County is the primary county of the Columbus Metropolitan Area with 1.3 million residents in its 1,380 km2 land area. Quite diverse, it includes the traditional, active downtown; vibrant urban neighborhoods, such as Short North and Clintonville; and areas of racial or ethnic concentration, such as Linden (a predominantly Black neighborhood) and Hilltop (primarily Latinx residents). It also includes relatively wealthy suburban areas, such as Upper Arlington, Dublin, and Bexley, and the less densely populated ex-urban areas of New Albany, Oakland, and Grove City. For these reasons, Franklin County is an apt test case representing a variety of neighborhoods within a metropolitan area. The Columbus Metropolitan Area is economically vibrant and has grown steadily over the last several decades. The analysis presented here suggests the COVID's effects provide grounds for concern about even healthy, growing regions.
InfoGroup data list 60,183 entries in Franklin County in 2019. Excluding nonprofits and entities with no sales (18,561 cases), imprecise geocodes (2,145), duplicate or extremely similar business names and street address entries (3,811), and entities without names, which may still operate as sole proprietorships (7,398), the sample yielded 26,925 businesses. In the first week of January 2021, a Google Map API search of each entry by business name and street address found 8,981 cases (33%) that did not match InfoGroup data. Thus, the base data are 17,944 cases. While the listing by InfoGroup is extensive, it is not government or USCB-based data and comes with limited reliability. However, comparison of sectoral distributions with County Business Patterns (CBP) and Business Dynamics Statistics (BDS) demonstrates that InfoGroup data are largely compatible with CBP and BDS with a small standard deviation of differences, 1.2 to 1.4% (see online Appendix A).
Descriptive Analysis
Of the 17,944 businesses with confirmed business status in Franklin County, 2,458 cases were listed as closed. As expected, there is wide variation in number and rate of closures by industry sectors. As the media and earlier surveys have reported, retail (392), and accommodation and food (356) sectors experienced the highest number of closures, in part because these sectors represent the highest number of establishments.
As for closure rates, the count of year t establishments is longitudinally consistent with the count of establishments in year t − 1, thus the following calculation by BDS (U.S. Census Bureau, 2021) is applied:

These numbers should be cross-referenced and compared with closure rates during normal times. Since CBP does not track business entry and exit data, the best reference is from BDS, from which these data are extracted at the metropolitan level. As a reference, Franklin County represents 62% of the Columbus Metropolitan Area. Table 1 includes the business exit rate based on BDS from 2018 (U.S. Census Bureau, 2020b), the latest available year. The exit rate by BDS was 7.0%, so the current COVID-19 closure rate of 13.8% is virtually twice as high as the norm. In addition, the standard deviation almost quadrupled, from 1.7% for BDS to 6.3% for the estimate by this article. It is clear that the COVID-19 pandemic enlarged sectoral differences.
Business Closures by Sectors.

Dividing the closure rate by the BDS exit rate provides a ratio to compare to normal times. Seven sectors experienced more than double the normal closure ratio: educational services (4.20), accommodation and food (2.50), mining (2.43), manufacturing (2.39), finance and insurance (2.26), wholesale (2.04), and real estate (2.02). Utilities did not have any closures, but this is an essential sector even during a pandemic. Health care (1.41) and construction (1.76), two essential services, had relatively low ratios, as did professional services (1.52). Management of companies had a low ratio (1.54), which could be due to the small size of the sector. Information had the lowest ratio (0.94) that may come largely from the discrepancy in listed numbers in InfoGroup data between 2018 and 2019.
Figure 1 represents the geographic distribution of closed businesses at the point level within Franklin County. The two notable concentrations are downtown and north from downtown along High Street, a major retail and restaurant avenue cutting through Ohio State University and connecting to Worthington, a city north of Columbus. However, closures are arrayed throughout the county; this visual analysis does not point out specific high-concentration neighborhoods. More statistical analysis is needed.

Business closures in franklin county.
To identify more smaller geographic analysis of neighborhoods, the past studies reviewed a range of scale of neighborhoods, but did not find consensus. Coulton (2012) and Coulton et al. (2001) identified the census tract as a neighborhood unit, primarily based on parents’ perceptions about child safety. The unit is less appropriate for this project, because the census tract is relatively small and can be heavily biased if a tract faces a major retail or business street. Since the primary question of this project is whether low-income or minority-dominant areas have had higher business closure rates, a real-estate-based unit is more realistic. Thus, this study applied the 27 community planning areas of the City of Columbus (2013), which identified communities and target improvement areas. It reclassified the county's 284 USCB census tracts in 2020 into an average of 10 tracts for each neighborhood, which is compatible with the rule of neighborhoods of seven to nine tracts identified by Loukaitou-Sideris et al. (2019).
Table 2 lists business closure rates by neighborhood. High closure rates are observed in Southeast (22.7%), North Linden (19.2%), Near East (17.9%), and Clintonville (17.6%). While Clintonville is a wealthy area with a majority White population (87.2%), three other neighborhoods—Southeast, Near East, and North Linden—have high concentrations of Black residents (43% to 67%), which raises a concern that these minority areas may be more severely affected. At the same time, however, closure rates in other majority Black areas, such as Eastland/Brice, Eastmoor/Walnut Ridge, and South Linden, as well as areas with a high Latinx population, such as Hilltop and Eastmoor/Walnut Ridge, are nearer to or lower than the county average (13.8%). This suggests that the proportion of minority residents and closure rates may not directly correlate. As a reference, Figure 2 describes the rate of business closures at USCB tracts and neighborhoods levels.
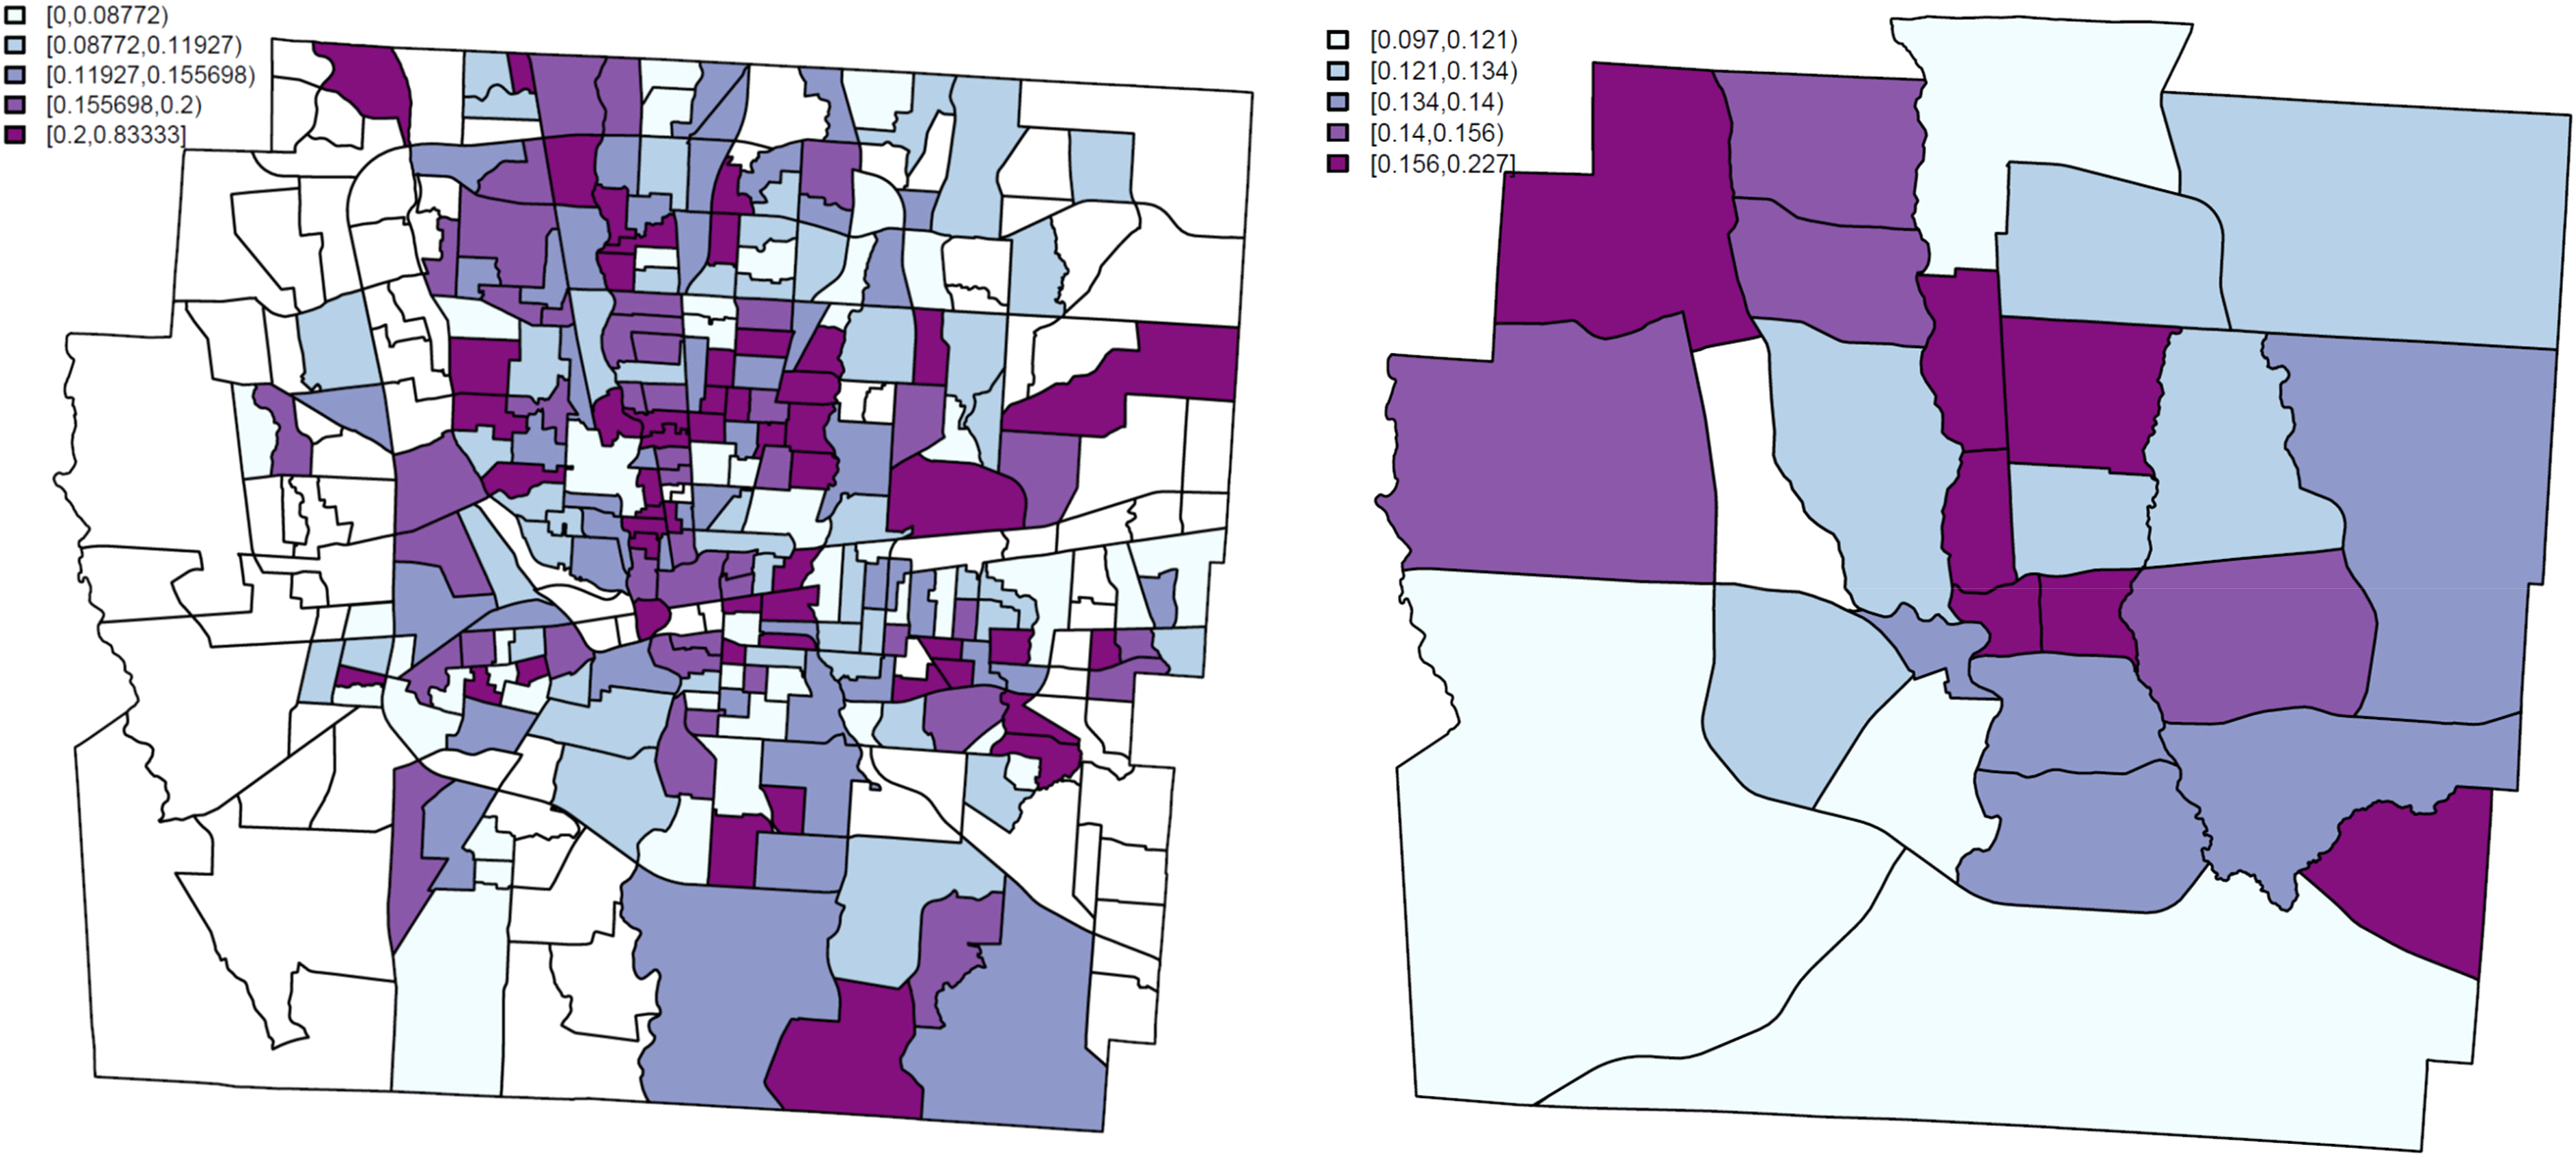
Business Closure Rates by Census Tract (left) and Neighborhood (right).
Neighborhood Data and Closure Rates.

Regression Analysis
The above descriptive analysis shows some skewed patterns of closure in certain sectors and neighborhoods, though such skews may only show correlations between sectors and neighborhoods. For instance, the wealthy, normally vibrant Clintonville neighborhood may have a higher closure rate because it has more retail and restaurant businesses. It is important to run a multivariate analysis to control for these two factors. The past literature additionally suggested that larger firms have lower exit rates (Cliff, 1998; Kalleberg & Leicht, 1991; Robb & Watson, 2012). Thus, the regression models for this study control for firm size in revenue, sectors, and neighborhood attributes. The models use a logistic regression of business closure at the establishment level (1 for closed; 0 for open). Nineteen industrial sectors at the NAICS two-digit level are dummy variables; the base case is the manufacturing sector.
The first model uses neighborhoods as dummy variables with the downtown as the base case. Fifteen of the other 26 neighborhoods are significant and negative, meaning that businesses in those places are less likely to face closure than downtown. Included in those 15 are the predominantly Black neighborhoods of South Linden, Eastland/Brice, Eastmoore/Walnut Ridge, and Near South, as well as Hilltop with its high concentration of Latinx residents. However, dummy variables for other neighborhoods with a high concentration of Black residents, such as North Linden and Southeast, are insignificant, meaning that their closure rates are similar to the high level of downtown. While this model can test an effect on specific neighborhoods, it does not reveal association with the concentration of Black, Latinx, or those in poverty, which the next models will test (Table 3).
Regression Results 1 with Neighborhood Dummies.
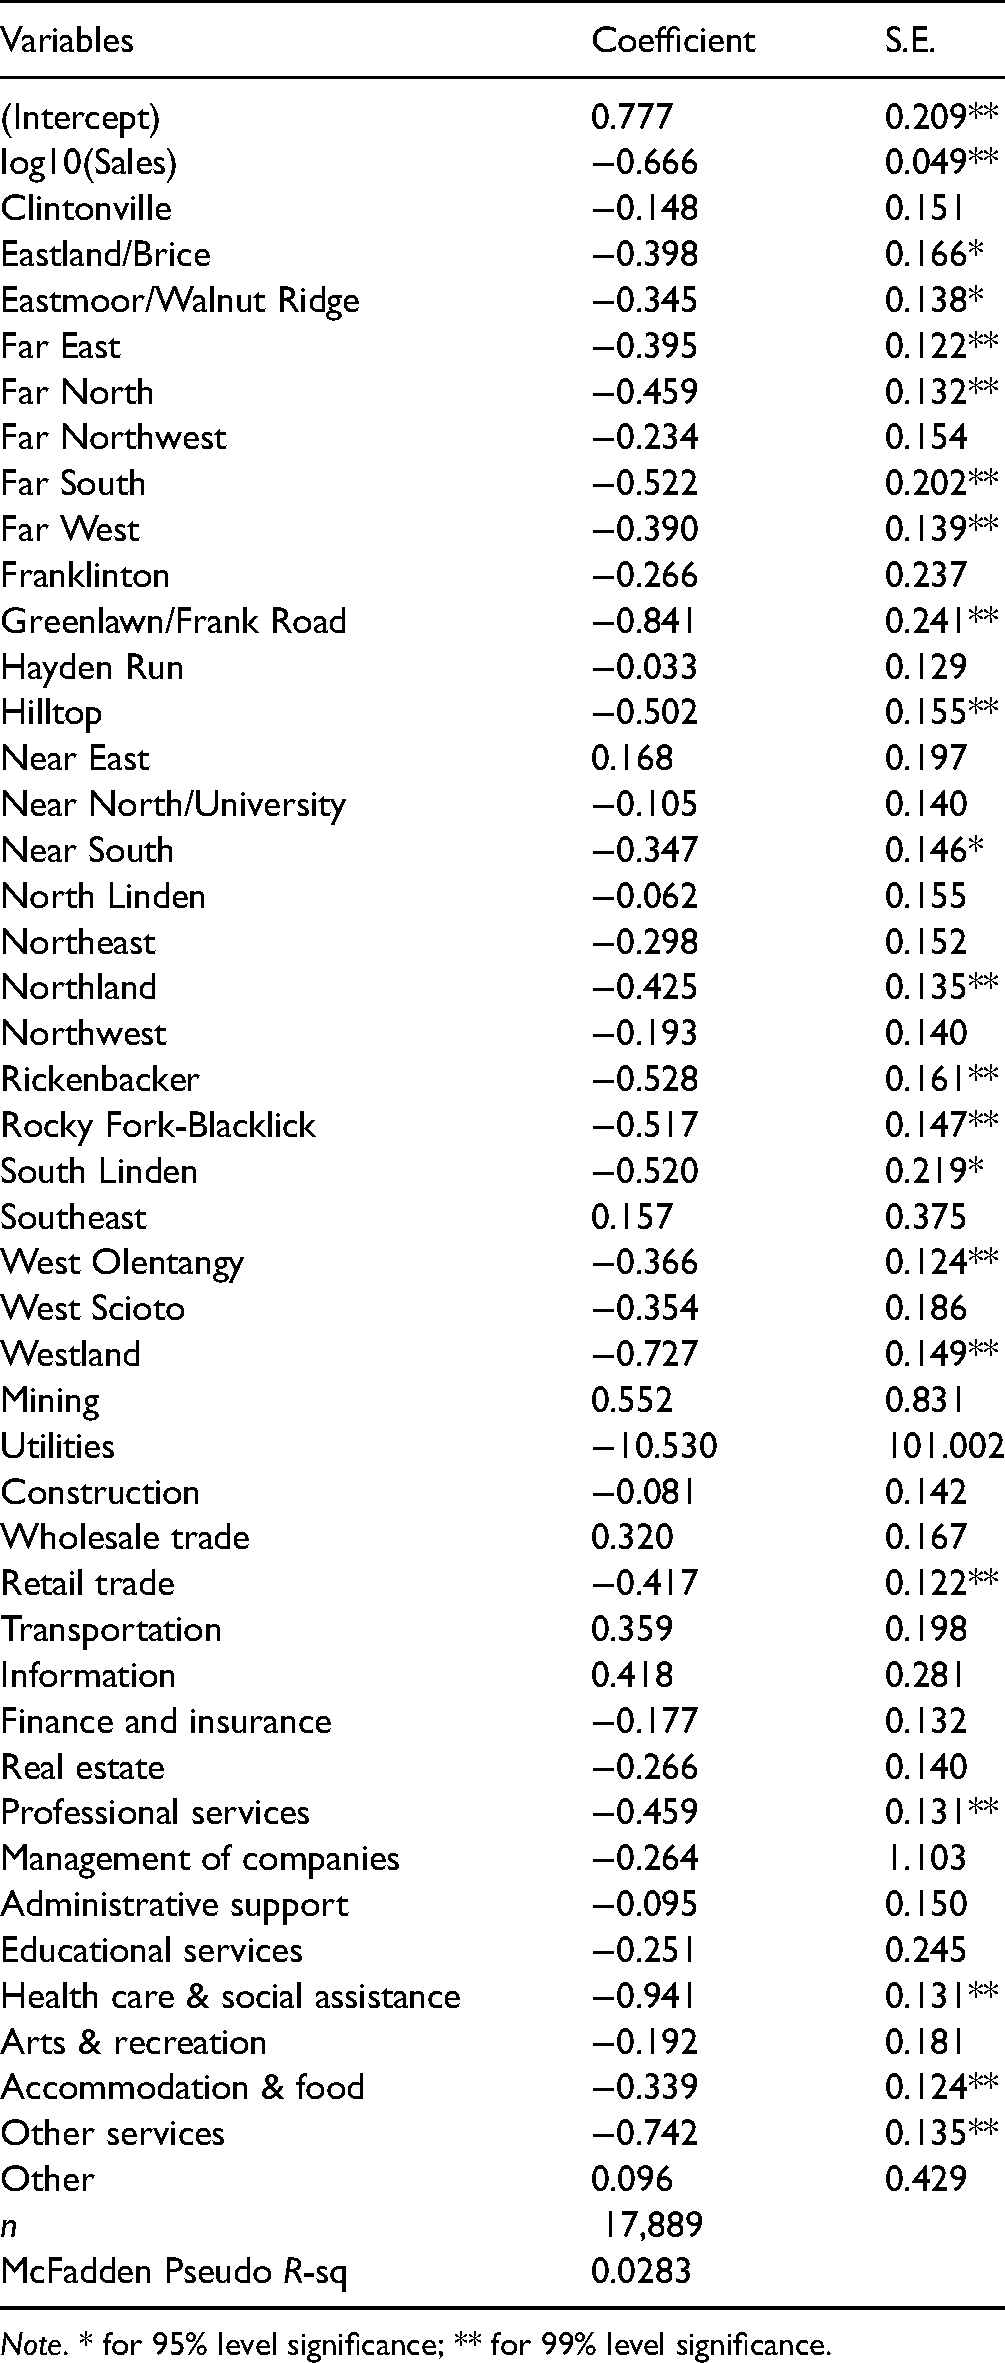
Note. * for 95% level significance; ** for 99% level significance.
Models 2 through 6 test whether a neighborhood's attributes (percent White, Black, Latinx, educational attainment, and poverty) are correlated with the closure rate of its businesses. 2 These are all correlated variables, between 0.54 and 0.97, and I separated each variable to avoid multicollinearity. In addition, Model 7 uses Shannon's diversity index (1948) to account for a combination of White, Black, and Latinx residents. The percentage of the population that is White, Black, or in poverty (in Models 2, 3, and 6, respectively) is not statistically significant, indicating that businesses near communities of color or in poverty are not disproportionately affected. The same result stands for Model 7 with the dissimilarity index. At the same time, the percentage of the population that identifies as Latinx is significant and negative (Model 4), meaning that the higher the percentage of Latinx residents, the less likely businesses are to close. Unexpectedly, Model 5 demonstrates that businesses near residents with higher educational attainment are more likely to close. It is possible that the Near North/University, Clintonville, and North Linden neighborhoods near the Ohio State University, the fourth largest university in the nation, had closure rates as high as downtown. Model 1 demonstrated no significant dummy variable for these three neighborhoods, which can support this interpretation. However, there can be a range of other possibilities. Finally, all models show that the larger a business is, the less likely it is to close.
With regard to sectors, Models 1 through 7 yield steady results. It is understandable that health care has the largest negative coefficients, indicating that closures are quite unlikely. Other sectors with lower closure rates compared to manufacturing are retail, personal services, accommodations/food, and other services. The retail and accommodations/food sectors may have experienced a significant number of closures, but the regressions indicate that the closure rate itself is not necessarily higher. The fact that no sectors had positive and significant dummy variables means no other sector was more likely to produce closures than manufacturing. At most, it can mean that other sectors may be as likely to experience closures as manufacturing (Table 4).
Regression Results 2 with Demographic Characteristics.

Note. * for 95% level significance; ** for 99% level significance.
Discussion
The central question in this study concerns whether certain kinds of neighborhood are more likely to experience business closures. The descriptive and regression analyses demonstrate that, contrary to popular narratives (see, for example, NY Times, 2020), businesses near racial or ethnic minorities in the Columbus Metropolitan Area were not more adversely affected by COVID-19 conditions. Neither were businesses in low-income neighborhoods. Further, neighborhoods with high concentrations of Latinx residents have lower closure rates. Several factors may be at play in this. It is possible that residents of Latinx communities are more likely to be employed providing essential services, such as construction and production (author's tabulation of 5-year Public Use MicroSample data of American Community Survey, 2013–17; Ruggles et al., 2020). In addition, a growing number of Latinx health practitioners, many of whom have been in the United States for many years, are in a sector where closures are less affected by the pandemic (Ruggles et al.). The regression models also showed lower closure rates for restaurants. Food preparation, a significant employment setting for Latinx persons, is another area less strongly affected by closure rates. At the same time, it is important to note that the main analysis here is businesses, closures, and their locations from urban neighborhood perspectives. This study does not speak to the different matter of the workforce and job losses, which we know have been severe for minorities and low-income earners.
My baseline finding, that downtown has a very high closure rate, brings a different set of policy issues. Columbus’ downtown population is 74% White and 18% Black; 62% of residents hold college degrees. It is a vibrant area with retail, restaurants, hotels, government services, churches, and other noncommercial activities. The high closure rate indicates that some other factors may have had an impact, especially protests in the summer of 2020. Demonstrations related to the Black Lives Matter movement started on May 28, 2020, around the state capitol. Demonstrators clashed with the police on May 30th, and a citywide curfew was imposed from May 30th through June 6th. During this time, more than 100 businesses were vandalized (ColumbusAlive.com, 2020), and others were forced to close. These disruptions likely played a part in the higher downtown business closure rate.
The other major finding relates to sectoral differences. Due to COVID stay-at-home orders and lockdowns in March and April of 2020, there was particular concern about their effects on retail, restaurant, and hotel businesses. Indeed, the retail and accommodations/food sectors have the largest number of closures–748 businesses that represent 30% of all closures. Other sectors with high closure numbers include professional services, health care, and other services, which together constitute 28% of all closures. Areas with businesses in these sectors will likely experience declines in urban vibrancy. However, if we consider the likelihood of closure, it is the highest among the educational services and arts and recreation, in both the closure rate and the closure ratio compared to the norm. Regression results also confirm that these sectors have higher closure probability than the base case of manufacturing.
These findings indicate that policy makers and city planners should factor in both the number and the rate of closures when considering damage at the neighborhood level. Some neighborhoods with active retail and restaurant businesses face more lost businesses and employment. In the Columbus metro area, downtown, Near North /University, and Clintonville are such neighborhoods. In addition, neighborhoods that host many educational services and arts and recreation businesses may experience major declines. Closed education businesses, for example, are in Clintonville, Westerville, Dublin, and Bexley–suburban areas with high-income and well-educated residents.
The major limitation of this analysis is the possible underreporting of closures for three reasons. First, while the coverage of InfoGroup business data is extensive, and the method outlined here carefully excluded entities outside the scope of investigation, such as government offices, nonprofits, and sole proprietors, InfoGroup data are not census based. They may be missing some business entities. For instance, I observed some discrepancy in the listed numbers of the information sector in 2018 and 2019. Second, there is a reliability issue with Google Map data. Their coverage is also extensive, but may also omit some entities. Google seems to rely on reporting by users, especially for temporarily closed businesses (Google, 2021). But it is not clear whether users, in this case businesses, report in a timely manner, report at all, or make the right judgment about the open, temporarily closed, or permanently closed status. Google data also seem to rely on reporting by consumers, and “data from governments and other authoritative sources” (Google, 2020b). The company does not disclose all of its detailed data collection processes or algorithms. The difference between a temporary closure, permanent closure, or work-at-home status could have different policy implications. It is technically possible that the temporary closure status of some businesses may have little impact on the economy if employees are working at home and their business operations continue. However, a work-at-home status can still affect urban vibrancy at the neighborhood level as fewer commuters can mean less spending by employees, as well as a loss of income tax to certain jurisdictions. Finally, the matching of the two data sets excluded 33% of entries, which I could not therefore analyze. That data likely included already closed businesses, leading to an underreporting of closures. This analysis is a best estimate based on reasonably reliable data sets. For an unprecedented crisis like COVID-19, it is critical for scholars to inform policy makers as much as possible about up-to-date economic and societal conditions.
In the meantime, it is important to underscore here that the closure rate in this analysis (13.8%) seems more realistic than the Yelp (2020) estimate of a 1.9% to 2.28% closure rate 3 even in states with the highest number of closures, such as Hawaii and California. The government data based on the BDS report a 7.0% closure rate even during normal times. Exact closures and impact will remain uncertain until government-based confidential data, such as Longitudinal Employer Household Dynamics, become available, which may not happen for years. It will be ideal to compare the closure rates before, during, and after the pandemic to estimate its effects. However, Google Map only provides the current status so a comparison with the past is not possible. Nonetheless, the analysis in this article suggests closure rates twice as high as the normal rate estimated from BDS. We do know that COVID induced more closures than the normal time, and this article presents the magnitude of its effects in one county.
Since this study of Franklin County is just one regional case, there is a limit to its external validity. While it is unrealistic to apply the findings here to all metropolitan areas in the country, similar patterns may apply to other metropolitan areas. Columbus is only one of many midsized metropolitan areas in the United States. There are 21 metropolitan areas with populations from 1.5 million to 3 million. Many of these metropolitan areas have similar multicounty geographies and a monocentric county, like Franklin County, which may share similar effects of COVID-19.
Footnotes
Acknowledgement
The author would like to thank Yuxuan Wang and Beth Chapple for their assistance.
Declaration of Conflicting Interests
The author(s) declared no potential conflicts of interest with respect to the research, authorship, and/or publication of this article.
Funding
The author(s) received no financial support for the research, authorship, and/or publication of this article.
Supplemental Material
Supplemental material for this article is available online.
Notes
Author Biography
References
Supplementary Material
Please find the following supplemental material available below.
For Open Access articles published under a Creative Commons License, all supplemental material carries the same license as the article it is associated with.
For non-Open Access articles published, all supplemental material carries a non-exclusive license, and permission requests for re-use of supplemental material or any part of supplemental material shall be sent directly to the copyright owner as specified in the copyright notice associated with the article.