
Abstract
This article draws on data from various sources for 190 developed and developing nations and uses them to examine gender regimes, or forms of patriarchal structures, at the regional level. I argue for multiple, rather than single, measures of gender inequality and illustrate that using many inequality measures exposes a wider range of outcomes within the Global South than the North, also suggesting the inefficacy of this geographic dichotomy. Then I re-examine the outcomes with nations grouped into seven regions, showing that each region has different variables that define their gender inequalities. Finally, I link gendered social institutions (e.g., laws on violence/physical integrity, family codes, civil liberties, and ownership rights) and implicitly gendered political-economic structures (e.g., IMF debt, armed conflict, ever having been a colony, and electoral democracy) to gender-inequitable outcomes in six regions to reveal three different gender regimes across the regions.
Keywords
Many sociologists do research on some aspect of gender inequality—perhaps within families or formal education; in the labor force; in politics, law, and social movements; as an aspect of violence or health care; or in sexuality. But few of us would ever try to create a single measure encapsulating the state of gender inequality in the United States—clearly such a measure would not distinguish outcomes for women of varying race, national, or class origins and would homogenize inequalities across many variables. Nonetheless, at an international level, many single-number measures of a nation’s gender inequalities are widely used.
Global gender inequalities are not a new topic among development researchers or transnationally oriented feminist researchers, although both groups tend to study these inequalities differently than I do and differently from each other. One group uses existing measures of gender inequality largely to predict improvements or declines in women’s status. For example, Dorius and Firebaugh (2010) estimated whether or not global gender inequality is declining over time, Korpi (2000) examined the relationship between gender and class inequality, and Seguiro (2000) tested if growth in a nation’s Gross Domestic Product (GDP) improves women’s relative position.
A second, rather large, group of scholars tries to develop more accurate, composite single indicators of gender inequality in each nation. The three most popular indices are relatively well known. Two were constructed by the United Nations Development Program (UNDP, http://www.undp.org): the Global Gender Development Index (GDI, http://hdr.undp.org/en/content/table5-gender-related-development-index-gdi), based on their Human Development Index (HDI, http://hdr.undp.org/en/content/table1-human-development-index-and-its-components), and the Gender Empowerment Measure (GEM) (1995). (More recently, UNDP combined these two measures into a Gender Inequality Index [GII], http://hdr.undp.org/en/content/table4-gender-inequality-index). In addition, the World Economic Forum (WEF 2013) created the Global Gender Gap Index (GGI), also in wide use. There are other alternative measures, too, such as Dijkstra and Hanmer’s (2000) Relative Status of Women Index (RSW) and Benería and Permanyer’s (2010) Women Disadvantage Index (WD).
Let me concretize the rankings for the most common measures using specific national examples. Although the United States is often held up as a role model for gender equity, it actually ranks 42nd on the GDI, 23rd on the GGI, and 15th on the GEM index. The “best countries” for these three indices, which are ranked at “1,” are the Netherlands (GDI), Iceland (GGI), and Norway (GEM)—all North European countries; while the nations ranked at the bottom on these indices are Yemen (GDI = 148 and GEM = 93) and Pakistan (GGI = 135). Other countries fall in between.
Why are gender inequality measures so popular? First and foremost, transnational women’s movements have succeeded in making gender inequality a global good, as reflected in the UN’s Millennium Development Goals (http://www.undp.org). And assuming that national-level politicians agree, advocates and activist researchers argue that having a measure of gender inequality for each country can be an incentive toward improving a nation’s relative status. The “politics of measurement” also takes over as scholars seek the “most accurate” measure. But measuring inequality is not the same thing as understanding its multifaceted dynamics.
In this article, I do not intend to create yet another measure—plenty already exist. Instead, because of problems in the substantive meanings and/or constructions in the GDI, GEM, and GGI, I first decompose the components of these single-number indices and focus on just seven measures that best reflect the typical subdimensions of such gender inequality outcome indices. In addition, I make use of the subscales from an index of gendered national structures (SIGI) and four different existing measures of implicitly gendered political structures (both described below), which I consider national “inputs” that could be responsible for the gendered outcome or “output” measures.
Second, I demonstrate how even these separate measures of a nation’s gender inequality structures and outcomes can become less than useful when they are employed to homogenize gender conditions across global geographies. Such national-level gender inequality indices often are used to justify the purported “significant differences” between the Global North and South. But I show how this dichotomy is an inaccurate depiction of the range of regional gender processes, because this division effectively treats all Global South nations as if they follow a single gender inequality regime, when the data show that they do not. Consequently, I illustrate how our understanding of global gender inequalities improves when across (and within)–regional variation, instead of North–South variation, is the focus.
Finally, I link my measures of explicitly and implicitly gendered social institution “inputs” with the seven disaggregated measures of gender inequality outcomes to reveal a variety of complex gender regimes.
Inequality Measures and Gender Regimes
In this section, I describe the construction of the inequality measures—first addressing the “output” measures and then two types of “input” measures—and highlight the difference between outcome and process/input measures. Finally, I raise the broader issue of why variation in gender regimes matters.
Inequality Outcome Measures
As I have indicated, the most commonly used measures of a nation’s gender inequality are the GDI, GEM, and the GGI. Each of these indices tries to improve on substantive problems they observe in others. For example, the GDI is criticized because it incorporates an indicator of development level (per capita Gross Domestic Product) to capture income inequities (Dijkstra and Hanmer 2000). The result is that poorer nations with small gender gaps on some equality submeasures can never rise very high on the overall scale, confounding development and gender equity. GEM is criticized because its components do not fully theorize all the dimensions of power (Charmes and Wieringa 2003) and because the sub-scales for percentage of women in economic decision-making positions or women’s share of income reflect data or positions found only in highly developed nations. The GGI does eliminate economic development levels from its measures but has been criticized for using multiple indicators that do not seem to hang together (Benería and Permanyer 2010). There are also more technical critiques that suggest we need nonarithmetic combinations of the various submeasures when they are folded into a single scale (Benería and Permanyer 2010), or that indices combining women–men ratios in which women do better than men (such as for life expectancy) with those in which men do better than women (such as income or labor force participation) create overall measures where the former component can cancel out a portion of men’s advantages (Benería and Permanyer 2010). While all these arguments make sense, for the purpose of discussing global variations in gender regimes, I argue that the major drawback of single-number indices is that gender dynamics are “flattened” or hidden within them.
Yet, each of these gender inequality scores contain rarely discussed subindices that are more nuanced than the overall measure. Each has slightly different subindices that are combined to measure inequality “outcomes.” To understand the subtleties of regional gender regimes, we need to use several separate, specific outcome measures, many of which can be drawn from subcomponents of the GDI, GGI, or GEM, rather than use their overall/combined index values (or ranks).
The GDI combines national measures of gender disparities in life expectancy, earned income, and three levels of education. The GGI has more dimensions, including health and survival (life expectancy and sex ratios), economic participation, educational attainment on multiple levels, and political empowerment. GEM, in contrast, has the fewest and simplest components: women’s proportion of seats in national parliaments, the percentage of women in economic decision-making positions, and women’s share of earned income. Many authors agree that across these measures there are only four major categories of gender inequalities: literacy and education, economic participation or income differences, political empowerment, and health or survival differences (Dorius and Firebaugh 2010; World Economic Forum 2013). I select and argue for seven inequality measures that cover these four outcomes.
Input Measures: Social Institutions and Gender Index (SIGI) and Implicitly Gendered Institutions
In order to examine gender regimes, it is important to consider the varying “causes” or kinds of social structures that shape the global variations in national gender inequality outcomes. One of the most useful ways to do this is with a relatively new scale, created by Branisa, Klasen, and Ziegler (2009, 2013), called the Social Institutions and Gender Index or SIGI. The SIGI score indicates the extent to which gender is embedded in a nation’s institutional structures and processes, generally using measures of law and culture. SIGI’s variables can be thought of as the gendered “inputs” that occur in each nation; it is described by its creators as a composite national-level “multi-dimensional measure of deprivation of women caused by social institutions” whose “five sub-indices are composed of twelve variables from the OECD Gender, Institutions and Development (GID) Database” (Branisa, Klasen, and Ziegler 2013, 252, 254).
Like GGI, GDI, and GEM, SIGI can be disaggregated into subindices, all five of which are multivariate: family code, civil liberties, physical integrity, ownership rights, and son preference. Because son preference is based on sex ratios, which are more an outcome measure than an input measure of cultural patriarchy, I use it as an output rather than input measure of gender regimes. Using linear regression, Branisa, Klasen, and Ziegler (2013) have shown that the family code subindex significantly predicts several typical gender inequality outcomes (female secondary school enrollment, fertility, and child mortality) controlling for GDP, religion, region, and the civil liberties subscale. Two components of the family code measure, early marriage and polygamy, are particularly significant. Their findings help substantiate the authors’ theoretical construction of the SIGI subscales as being conceptually different from the typical gender inequality “output” measures.
The SIGI subscales focus on explicit ways in which major social institutions can be gendered, using measures of national-level laws or gendered customs. Missing in these measures are the larger-scale political-economic structures that are “implicitly gendered institutions” and less obviously discriminatory, but which nonetheless have gender-differentiated impacts on men and women. I have chosen four of them for this analysis.
First, electoral democracy, especially along with electoral quota policies, enhances women’s political representation. This is particularly clear in the European Union and African Union countries, where women’s increased representation is associated with gender mainstreaming policies that assess the impact on women and men of all government programs and legislation—with the goal of increasing gender equality (Walby 2004). The second political “institution” is the presence of armed conflict on national soil, included because such struggles make household life difficult by reducing women’s resources and at the extreme turning women into refugees (United Nations Women 2000). Such conflict increases gender inequality in some regions. Third is the presence of International Monetary Fund (IMF) Structural Adjustment Plans (SAPs) that increase a nation’s external debt. Many feminist scholars argue that IMF debt impedes women’s progress by urging nations to cut back on public sector formal employment in teaching, health, or civil service, thus decreasing women’s formal economy jobs, and increasing women’s household burdens and gender inequality due to reduced access to services or increased fees (Walby 2009, 122). The final political-economic concern is previous colonial status, if any, of a country, no matter when it gained independence. This measure captures the patriarchal gender roles that often ensue under colonization, as well as any continued influence national economic dependence on former colonizing nations (Acosta-Belén and Bose 1995).
Gender Regimes within and across Nations
Connell refers to gender regimes at the institutional level as “the patterning of gender relations in that institution, and especially the continuing pattern, which provides the structural context of particular relationships and individual practices” (Connell 2005, 6). Walby (2004) develops this concept at a regional level when she examines gender inequality within the European Union. In both cases, a gender order is viewed as the configuration of varying institutional regimes into a nationally recognizable approach to managing gender. In this research, I extend these concepts by aggregating institutional regimes across nations, rather than aggregating across regimes within a single nation.
Therefore, this article investigates the multiple gender orders that are revealed in the connections between explicit gendered institutional regimes, implicitly gendered political-economic variables, and gender inequality outcome measures. Methodologically, this maintains the advantages of indices while avoiding their reduction to a single national score. After describing the data set, I begin my analysis with the typically used geographic dichotomy of Global North and South, and then move to a more complex and nuanced regional level. Doing so illustrates that patriarchy and gender regimes/orders are not homogeneous, but instead take on varying regional forms that are only indirectly associated with “modernity” or development processes.
Methods
To carry out this project, I created a data set for 190 countries that contains about 75 variables (not all of which are used here). The variables originate from multiple sources, including online data bases developed by large entities like the United Nations or the International Monetary Fund (IMF), or from more focused data sets created by scholars on specific topics (e.g., Armed Conflict data base, Correlates of War Project, or the Quota Project [http://www.quotaproject.org/uid/search.cfm]). All variables were combined into an SPSS file, where the number of cases (or nations) changes for each variable because they were drawn from different sources.
The seven inequality outcome measures that I selected encompass the four substantive areas used in the subscales of the GDI, GEM, and GGI measures. I chose what I considered to be the best indicators in the UNDP (GDI and GEM) and World Economic Forum (GGI) data sets. The first three outcome measures cover education and labor force participation. All are women/men ratios of equality, which means that numbers closer to “1” represent equality and “0” represents inequality:
1. The women/men ratio of the population over age 15 who are literate. (This measure is drawn from the GGI, which is based on UNESCO 2012 data. Similar measures are used in the GDI but not in GEM.)
2. The women/men ratio of the population age 25 or older with at least secondary education. (The source is UNDP data for 2006–2010 averages that I recoded as a ratio. This is simpler than the GDI and GGI, both of which use a combined primary, secondary, and tertiary measure; no such measure is used in GEM.)
3. The women/men ratio of people ages 15–64 in the labor force. (This is a GGI measure based on 2010 International Labour Organization [ILO] data. It is not used in GEM, which instead incorporates women’s share of earned income, or in the GDI, which includes women’s and men’s estimated earned income.) Because measures of earned income are better for developed than for developing nations with large informal economies, in this analysis I limit my variable to labor force involvement.
The next outcome measure is women’s political participation:
4. The percentage of national parliamentary seats held by women. (The source is UNDP data for 2012. It is one of three measures used in GEM and also part of a complex GGI measure of political empowerment. It is not included in the GDI.)
The final three indices are related to mothers’ and children’s health and survival: the first is measured on a 0 to 1 scale, but the second two are ratios or rates, where absolute numbers are important. For all three, lower scores better:
5. Son preference based on sex ratios. (My source is SIGI whose creators consider this a measure of gender bias in mortality [Branisa, Klasen, and Ziegler 2013, 254; Klasen and Wink 2003] that incorporates “sex ratios of young people and adults” [Branisa, Klasen, and Ziegler 2009, 2013; Klasen and Wink 2003].) It is intended to identify “missing women” possibly lost to sex-selective abortion or insufficient care given to female babies. The scale runs from 0 (sex ratio equality) to 1 (complete inequality). The GGI includes sex ratios, and both the GDI and GGI use life expectancy. I do not use life expectancy because, if measured as a gender inequality gap, women are usually ahead.
6. Maternal mortality ratio per 100,000. (The source is UNDP data 2010. It is not an explicit component of GEM or among GGI and GDI health measures.)
7. Adolescent fertility rate. (The source is UNDP data. It is not a component in GEM or among GGI and GDI health measures.)
I use four SIGI subscales as measures of gendered institutional inputs. The family code subindex incorporates marriage laws and customs by measuring women’s legal guardianship of children and inheritance rights, as well as early marriage and polygamy. It is intended to measure women’s decision-making power in households.
The civil liberties subindex measures gender inequality as it relates to women’s freedom of movement and freedom of dress—effectively this index focuses on the Middle East, North Africa, and parts of South Asia, addressing the political confinement of women to family and aspects of unequal family relations. It is not intended to address civil liberties at the larger level of voting rights, nor at the micro-level of sexual harassment on streets. Such measures might be developed in the future.
Physical integrity is a subindex based on three measures of laws related to violence against women—laws against domestic violence, against sexual assault or rape, and against sexual harassment—as well as the percentage of women who have undergone genital cutting.
Finally, the ownership rights subindex combines measures of women’s access to land, credit, and other property indicating equality of their access at a level equal to or less than men in the same nation. I expect that ownership of property and inheritance rights (part of family code) will be key factors for women’s ability to leverage greater equality in their nations—without either of these resources, leaving a bad relationship and garnering a living on one’s own are extremely difficult. On the other hand, in nations where men’s and women’s property rights and position in family codes are similar, these variables should not be correlated with gender inequality outcomes because there would be no variation in them—other variables instead should be key inputs to these outcomes in regions where women’s access to ownership and family rights are common. (Similarly, although an outcome variable, literacy also is fundamental to women’s independent survival, and in nations where literacy is almost universal, I expect that none of the input variables will predict it.)
Each of these subscales or components are coded on an “inequality” scale from 0 to 1, where “0” represents equality and “1” represents complete inequality (which results in some odd correlations that feel like a “double negative”). Most importantly, each measure represents several key aspects of varying social institutions and the gendered processes within them.
There are other institutions whose structures are only implicitly gendered, but nonetheless influence inequality outcomes. Therefore, to capture an important aspect of the current global economy, I added four variables related to national political-economic structures. These were chosen from among other variables that I had coded, but some of those had less explanatory power (e.g., the number of paid maternity leave weeks, party or electoral gender quotas) and/or were not well measured for both developed and developing nations (e.g., percentage of female-headed households, female/male ratio of national out-migrants). I use these political-economic measures:
First is the presence of electoral democracy measured as the proportion of the years from 2009 to 2013 with electoral democracy, ranging between 1 = 100 percent of those years and 0 = 0 percent of those years (source: Freedom House data, http://www.freedomhouse.org). While my future analyses might differentiate among democracies with and without electoral quota policies that could enhance women’s political representation, I chose to use this measure because quotas are highly associated with the two regions of Africa and Europe.
Second is the presence of any IMF structural adjustment or poverty reduction debt between the years 2005 and 2013, simply coded Yes = 1 and No = 0, rather than for the size of the debt or the number of years (source: IMF country data, http://www.imf.org/external/country/index.htm). Again, future analyses could make such a differentiation, but this preliminary effort is a conservative test of the effects of recent debt.
The third variable is the presence of any armed conflict later than 2000, coded Yes = 1 and No = 0 (source: Armed Conflict Database, Uppsala University, and PRIO, http://www.pcr.uu.se/research/ucdp/datasets), included because such recent struggles reduce women’s resources and at the extreme can turn women into refugees.
The final political measure is whether a country was ever a colony, no matter when it gained independence (source: Correlates of War database, Colonial/Dependency Contiguity Data, 1816-2002, Version 3.0, University of Michigan). This is a simple measure intended to capture the patriarchal gender roles that often ensue under colonization, as well as any continued national economic dependence on former colonizers.
As mentioned earlier, my goal is to show that while there may be varying Global North–Global South gender regimes, we learn more empirically by examining the variety among them across the regions composing the Global South. Furthermore, at a theoretical level, we can see the multidimensionality of patriarchy and how the intersections of gendered institutions vary across regions.
In order to see the effectiveness of this strategy in revealing gender regimes, I distributed countries into regions beginning with the same six regional allocations used in UNDP’s analyses with the Gender Development Index (GDI) and by Branisa, Klasen, and Ziegler (2013) with their SIGI. Then I add a seventh region, North America, which both sources entirely exclude. While the GGI includes North America, it does so at the expense of combining South and East Asia into one region, while I divide them. Thus, the final seven regions are North America; Latin America and the Caribbean; Europe and Central Asia; East Asia and the Pacific; South Asia; the Middle East and North Africa (MENA); and Sub-Saharan Africa.
Since the overall single-number indices of SIGI, GDI, and GGI are all significantly different for North and South, in the first findings section, I illustrate how my input and output variables are differentiated between the Global North and Global South, using mean differences and standard deviations. In the second findings section, I discuss the variation in these same variables across seven regions, focusing on the differences across Global South regions, primarily using analysis of variance (ANOVA) results. Then, in the final section, correlation matrices between structural input variables and gender inequality output measures are used to reveal a variety of gender regimes.
Global North–South Mean Differences
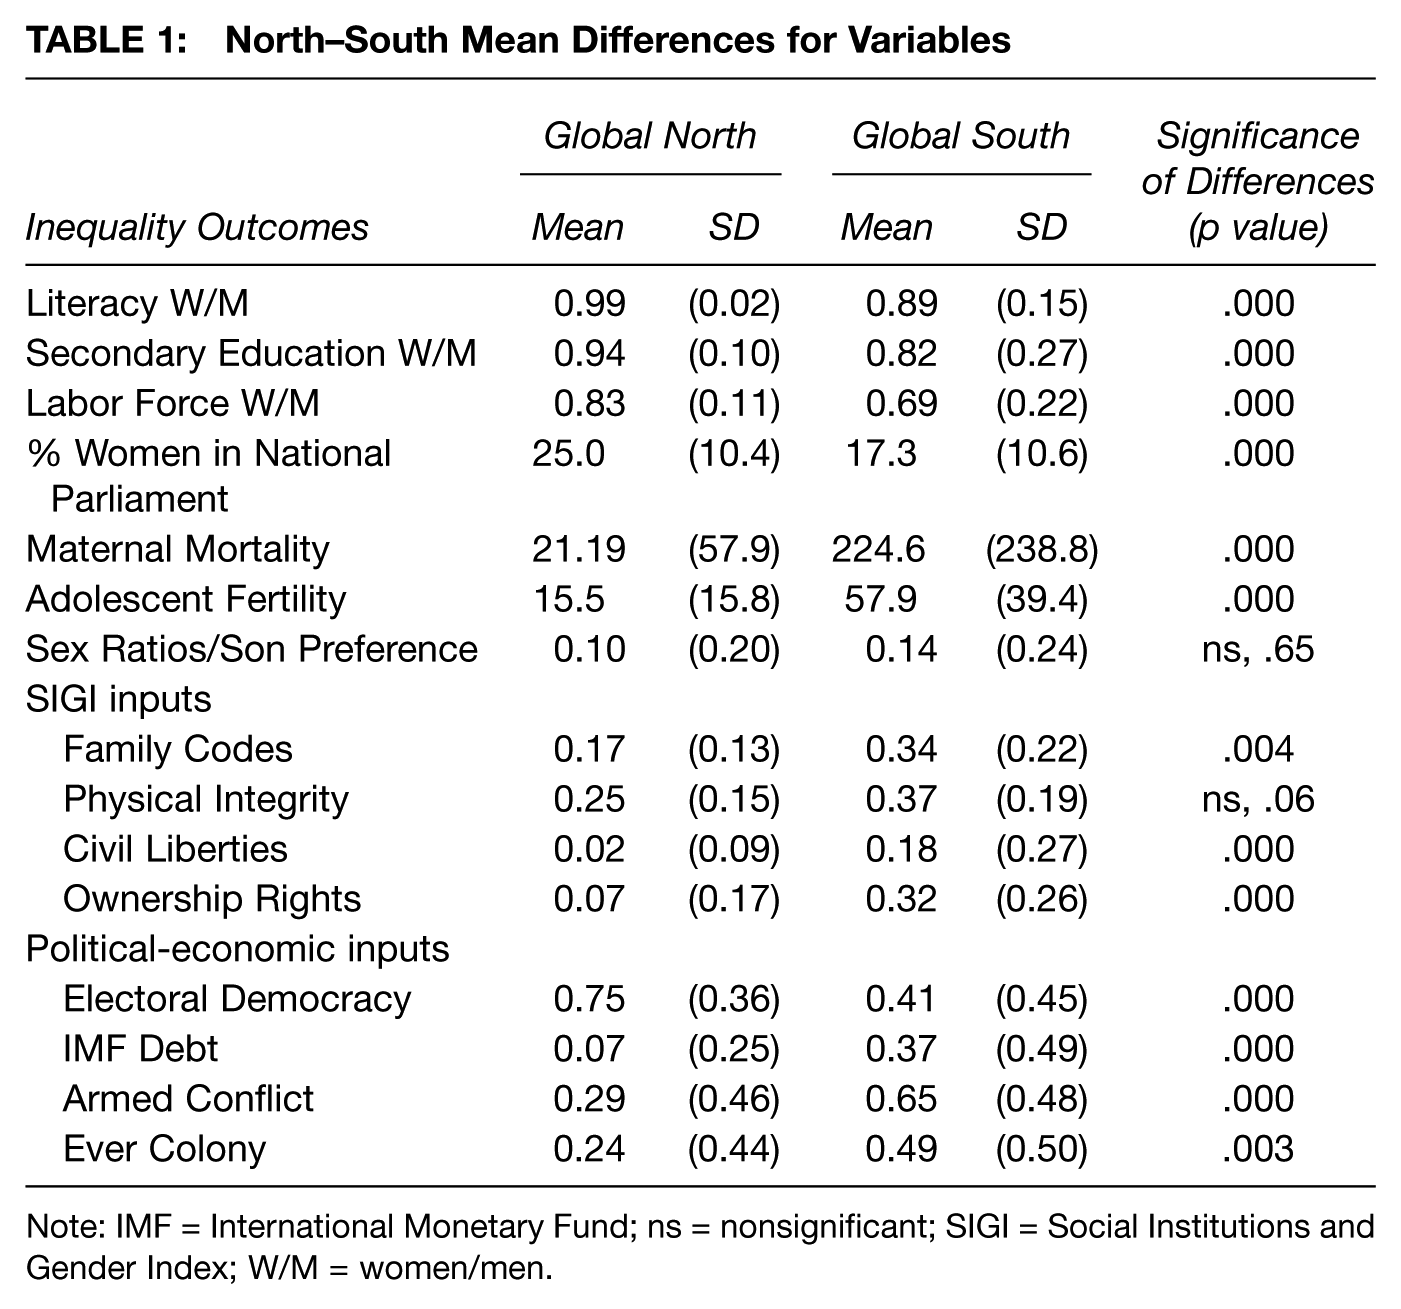
It is informative to compare the Global North–South mean differences for the seven inequality outcome measures, the four SIGI subindices of social institutions, and the four “implicitly gendered” political-economic institutions (see Table 1) because of possible similarities, as well as their differences, and because the common expectation is that the two hemispheres are entirely different.
North–South Mean Differences for Variables
Note: IMF = International Monetary Fund; ns = nonsignificant; SIGI = Social Institutions and Gender Index; W/M = women/men.
Gender Inequality Outcomes, Institutions, and Structures: North versus South
Among the gender inequality outcomes, only one—sex ratios/son preference—is not significantly different. This may be due to the fact that its institutional or cultural causes, such as sex-selective abortion, are found in relatively few nations, and thus the effect is “diluted.”
Two other indicators—women/men literacy ratio and percentage of parliamentary seats held by women—are statistically significant, but are not substantively large. In both the Global North and South women/men literacy ratios are high at .99 and .89, respectively, while both have low rates of women’s political representation (25 percent vs. 17 percent). The four other outcome measures also are statistically different, but are larger. Specifically, the women/men ratios for the population with at least secondary education are .94 (North) versus .82 (South); the women/men ratios for labor force participation are .83 (North) versus .69 (South); and maternal mortality and adolescent fertility rates in the Global South are substantially higher than in the North.
But equally important, along with significant Global North–South gender inequality differences, we see much greater variability (or larger standard deviations) within the Global South as compared to the Global North—indicating that aggregating all these countries together is not especially useful, since wide variation is hidden within the “South” category. This is particularly true for the large variation in maternal mortality and adolescent fertility rates, where the Global South standard deviations for these measures are 4.1 and 2.5 times larger than in the Global North. The same contrast holds true for the 0–1 scaled variables of women/men labor force participation ratio, secondary education, and literacy ratios, which are 2, 2.7, and 7.5 times larger, respectively, in the South than in the North.
Among the SIGI subscales, the three indices for family code (.17 vs. .34), civil liberties (.02 vs .18), and ownership rights (.07 vs. 32) all distinguish Global North from Global South nations. However, physical integrity is not significantly different for the Global North–South dichotomy; physical integrity laws against violence are increasingly widespread around the world and differentiate Global North and South less than in the past (although they are nearly significant at p = .06).
In contrast, all of the gendered political-economic structure measures significantly distinguish Global North and South nations, but the standard deviations are large (especially given these are 0–1 scaled measures), suggesting considerable within-region variation. Not surprisingly, there are more former colonies, as well as countries with IMF debt and recent armed conflict in the South, while there are more electoral democracies in the North. However, the difference in standard deviations is large only for IMF debt.
In sum, while most of the gender inequality input and output measures are significantly different for the Global North and Global South, I argue that these differences do not sufficiently delineate the global variations in gender inequalities because there are such large, and often huge, differences, especially among the nations of the Global South.
Regional Mean Differences
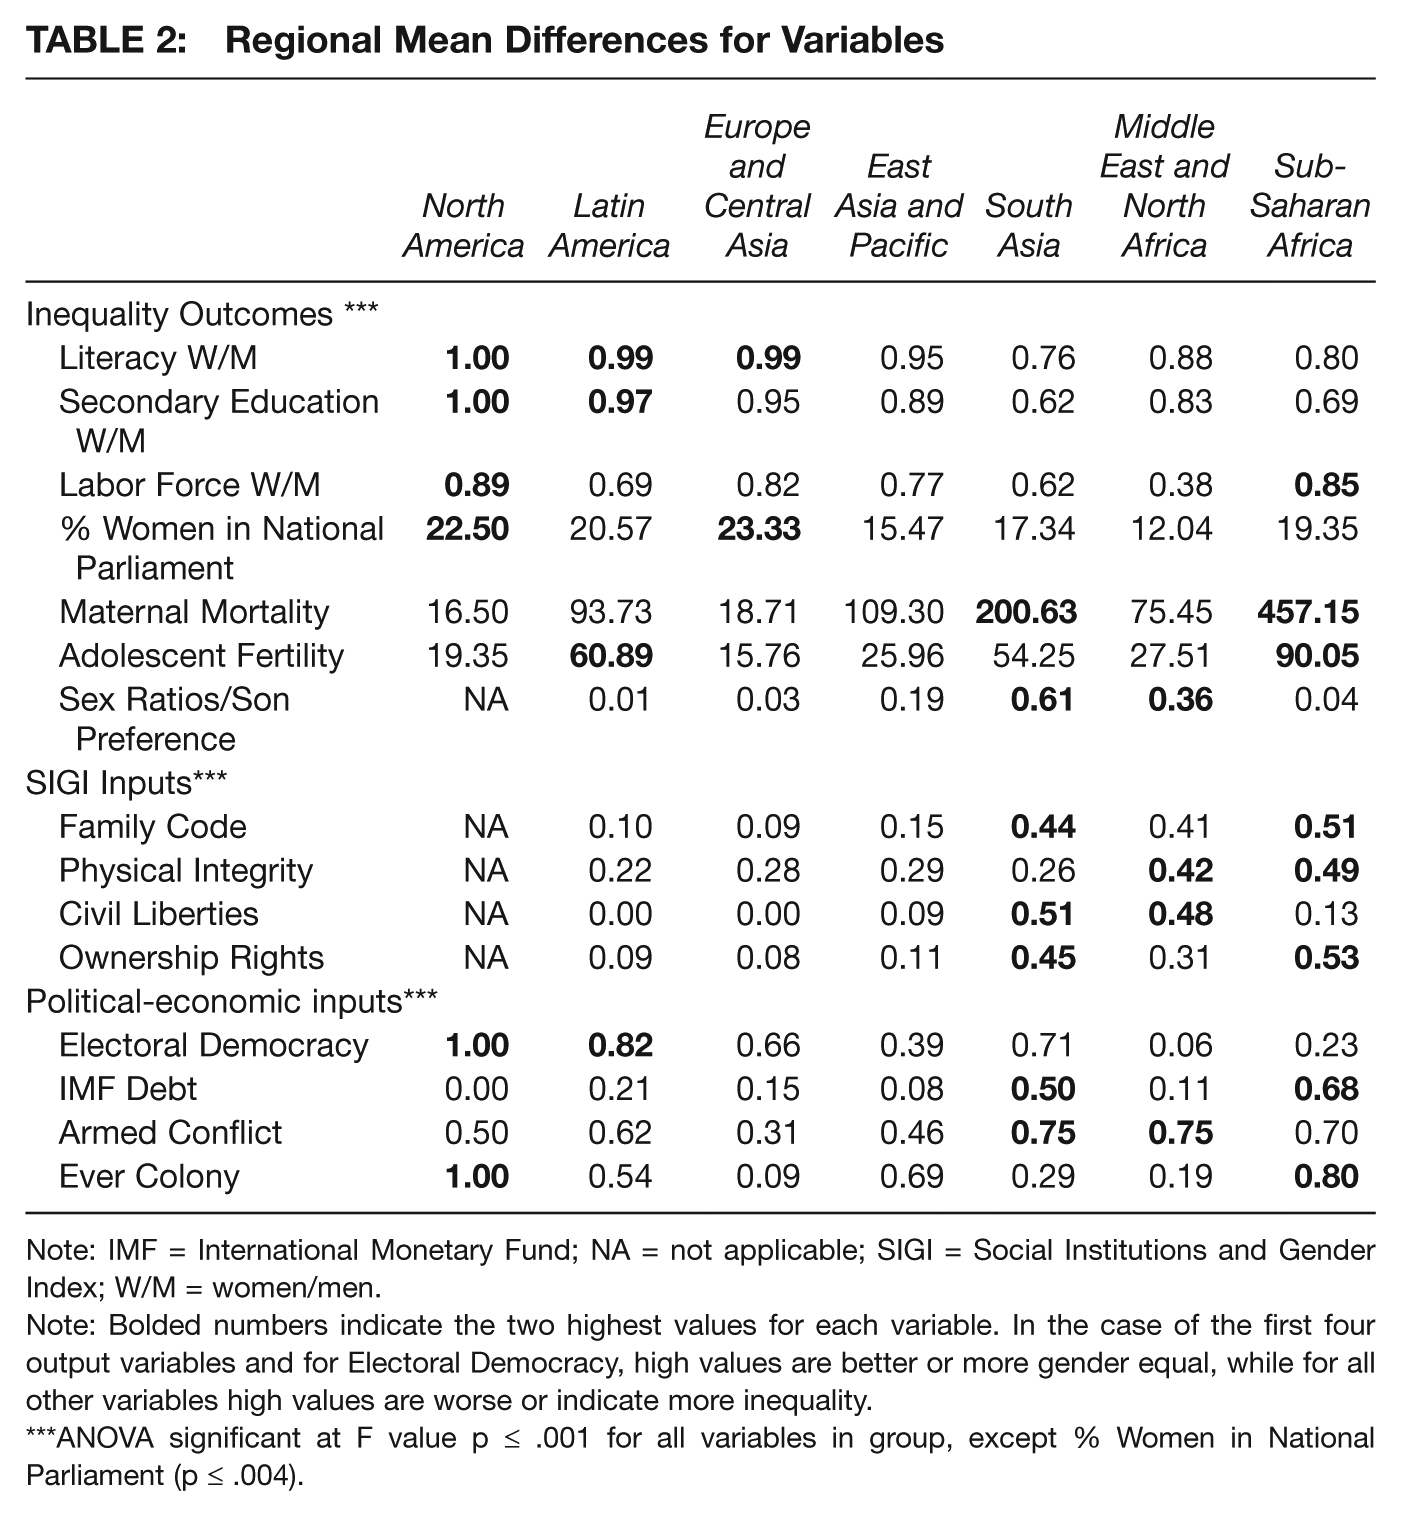
In this section, I turn to the regional differences in gender inequalities and, based on an ANOVA, I find significant differences by region for every explicitly and implicitly gendered input measure, as well as for each inequality outcome. A closer look reveals that some of the Global South geographic subregions have considerable gender equity, while others are doing comparatively worse. Table 2 shows the results using the means derived from the ANOVAs, and I also discuss some standard deviations for regions. (In the online Appendix, the relative positioning of each region is visually illustrated using selected box plots for several of these variables.) In Table 2, the highest two values for each variable appear in bold, which for the first four variables and electoral democracy show the most equitable regions, while among the other variables high values are “worse” or indicate more inequality. Once again, I begin with the seven gender inequality outcome measures and then discuss the input measures.
Regional Mean Differences for Variables
Note: IMF = International Monetary Fund; NA = not applicable; SIGI = Social Institutions and Gender Index; W/M = women/men.
Note: Bolded numbers indicate the two highest values for each variable. In the case of the first four output variables and for Electoral Democracy, high values are better or more gender equal, while for all other variables high values are worse or indicate more inequality.
ANOVA significant at F value p ≤ .001 for all variables in group, except % Women in National Parliament (p ≤ .004).
Most regions score quite well on the two educational measures—the women/men literacy ratio for those aged 15 and above, and the women/men ratio of the population with at least secondary education. Nonetheless, for secondary education, both South Asia and Sub-Saharan Africa score substantially lower than other regions (but their standard deviations are comparatively high, and therefore the range of national outcomes within these regions are quite varied), while the Middle East/North Africa (MENA) falls between the lowest and highest regions.
In contrast, women’s parliamentary representation is not near equity anywhere—23 percent or less in all regions—illustrating that some factors seem fairly consistent across regions. Indeed, the standard deviations are fairly similar for each region, ranging from 7.8 to 11.9. Nonetheless, in East Asia and the MENA countries, representation rates are the lowest at 15.5 percent and 12.0 percent, respectively, while those in Europe and Central Asia (23.3 percent) are almost double those values, possibly because of the high usage of electoral or party quotas in Europe
The ratio of women’s to men’s labor force participation, a GGI gender gap measure that can run from 0 (inequality) through 1 (equality), is inconsistent. Although men’s employment rates tend to be fairly steady across regions, women’s employment opportunities vary considerably and are the primary cause for ratio fluctuations. Women are very likely to be in the labor force in North America, Europe, and Sub-Saharan Africa (where women/men ratios run between .82 and .89), moderately likely in East Asia, South Asia, and Latin America/Caribbean (with women/men ratios ranging from 0.77 to 0.62), and unlikely in the MENA countries (ratio is 0.38).
Among the health measures, maternal mortality averages the highest in Sub-Saharan Africa (457.2 per 100,000) and South Asia (200.6); Sub-Saharan Africa also has highest adolescent fertility rate (90.1 per 100,000), followed by Latin America/Caribbean (60.9), and then South Asia (54.3). Since younger pregnancies often lead to higher maternal mortality, it is not surprising that these two measures are correlated and exhibit a somewhat consistent regional pattern. In contrast, an inequitable sex ratio measure of “missing women” is relatively common in some regions (e.g., South Asia, MENA, or East Asia) and very rare in others (e.g., Latin America, Europe, and Sub-Saharan Africa). Yet, in regions where it is more common, the standard deviation within those regions is also higher (0.21 to .30 compared to 0.05 to 0.12), indicating considerable national variation within the “son preference” regions. This finding is consistent with research that shows there are about 15 to 20 countries that exhibit rather unequal sex ratios (Seager 2009).
In sum, gendered inequality outcomes reveal considerable variation among the regions of the Global South which is hidden when they are considered as just one undifferentiated group. South Asia and Sub-Saharan Africa have the most gender inequality in literacy and secondary education rates, as well as the highest maternal mortality or adolescent fertility rates. However, the Middle East and North African (MENA) nations have the lowest women/men labor force participation, and MENA and East Asian nations share the lowest parliamentary representation.
Since the SIGI scores were created in order to study development processes, the countries of North America were excluded; so the Global North is represented only by Europe and the remaining regions were considered part of the Global South. The first SIGI subindex is family code, which combines multiple measures of early marriage, polygamy, women’s legal guardianship of children, and women’s inheritance rights. The regions of Europe, Latin America, and East Asia have relatively low mean scores (0.09 to 0.15), representing near equality, while the most inequality is found in Sub-Saharan Africa (0.51), followed by South Asia (0.44) and the Middle East/North Africa (0.41).
The subindex of physical integrity, another multiple indicator, measures FGM pervasiveness and three types of laws opposing violence against women. None of the regions score very well (i.e., close to 0)—but Europe, Latin America, East Asia, and South Asia all are relatively equitable with indices between 0.22 and 0.29—likely because of relatively strong anti-violence laws. However, Sub-Saharan Africa (0.49) and the Middle East/North Africa (0.42) both have mean values that are half way to full inequality, although the reasons may vary. FGM is prevalent in some African countries, but not all, and violence against women laws may also be uneven.
For the civil liberties subindex, which combines women’s freedom of movement and freedom of dress, most regions have low scores, nearing equality. (The results are similar to those for son preference, with little variation across most of the regions.) Europe and Latin America score a perfect “0,” and East Asia (0.09) and Sub-Saharan Africa are quite low as well at 0.08 and 0.13, while the most unequal regions are South Asia (0.51) and Middle East/North Africa (0.48).
Finally, the ownership rights subindex, measuring the degree to which women have access to land, credit, and other property at a level equal to men in the same nation, shows relative equality in Europe, Latin America, and East Asia (0.08 to 0.11), moderate equality in the Middle East and North Africa (0.31), and considerable inequality in South Asia (0.45) and Sub-Saharan Africa (0.53).
In sum, there are large differences in the institutional support for gender equality (SIGI) among the regions often considered part of the Global South. Latin America and the Caribbean and East Asia score well, similar to Europe, on all four SIGI measures. This is similar to the outcomes measures for these two regions. In contrast, Sub-Saharan Africa, South Asia, and the MENA region all score comparatively poorly on three SIGI measures, but the first two score relatively well on civil liberties and physical integrity, respectively, while the MENA region scores intermediately on ownership rights. Thus, while these three Global South regions exhibit the most inequality, it is not for the same constellation of structural inequality measures, with each showing more equity in a single, but different, measure. This lack of consistency across the three regions is also true of the outcome measures, since each has different development-related issues.
For the political-economic structures, the regions seem to fall into three groups. The first two regions in the table, North America and Latin America, are similar in terms of their high rates of electoral democracy. The second two regions, Europe/Central Asia and East Asia/Pacific, are similar since both lack high values on any of the variables, although Europe is the lowest in armed conflict and former colonial status. Thus, East Asia and Latin America are not consistently like the Global North for these variables. Finally, we see that South Asia and the MENA regions share high rates of armed conflict; and South Asia and Sub-Saharan Africa share high rates of IMF debt; in addition, Sub-Saharan Africa has the highest proportion of former colonies (after North America).
Across these variables we see that, again, the same three Global South regions (South Asia, the Middle East and North Africa, and Sub-Saharan Africa) exhibit the most inequalities, but the differences among them are greater than for other variable sets. Sub-Saharan Africa does fairly poorly on all four measures, while the other two regions score poorly on only two of the four indicators. As before, the constellation of issues is not identical among them.
Summarizing the regional findings, across all the variables East Asia and the Pacific as well as Latin America and the Caribbean are usually, although not always, similar to the Global North regions (North America and Europe/Central Asia). In contrast, South Asia, the MENA countries, and Sub-Saharan Africa are much less likely to follow that pattern. All three regions are fairly similar to the Global North in literacy rates and women’s parliamentary representation, but in other ways they have multiple indicators that are typical of what international policy agencies think of as the Global South. Nonetheless, all three regions are not the same—there is no consistent “Global South pattern” since only three variables (literacy, family code, and armed conflict) have similar levels of gender inequality across all of them. Many factors seem to be cross-national, but also take regionally specific forms, while for others, such as sex ratio inequality, there is considerable variation within a region.
Relationships between Gendered Inputs and Inequality Outcomes—Gender Regimes
The regional variations in mean values for inequality input and output measures in the Global South suggest that there are several possible configurations for the regions’ gender regimes. In order to locate them, I examined the constellation of significant correlations between the SIGI institutional and political-economic input measures and the gender inequality outcome measures. I begin with a simple comparison of the Global South and North, as shown in Tables 3 and 4, where I leave out the nonsignificant correlations in order to focus on the patterns. (Remember that some of the significant correlations feel like a “double negative” because SIGI uses 1 = inequality, while female/male ratios imply 1 = equality.) Then I examine regional gender regimes, as shown in Table 5.
Global South Correlations between Input Structures and Gender Inequality Outcomes

Note: IMF = International Monetary Fund; ns = nonsignificant; W/M = women/men.
Global North Correlations between Input Structures and Gender Inequality Outcomes

Note: IMF = International Monetary Fund; ns = nonsignificant; W/M = women/men.
Significant Correlations between Input Structures and Gender Inequality Outcomes in South Asia (SA), the Middle East–North Africa (MENA), and Sub-Saharan Africa (SSA)

Note: IMF = International Monetary Fund; ns = nonsignificant; SIGI = Social Institutions and Gender Index; W/M = women/men.
Within each region, each grouping of input variables is significantly correlated with an equal number of outcome variables: Both gendered institutions and implicitly gendered political-economic structures each have six significant correlations with the inequality outcome measures in the North. In contrast, the number of correlations is more than twice as high (15 and 16, respectively) in the South. This shows that, on the one hand, SIGI’s institutional measures and the political economy variables are equally effective in predicting gender inequality outcomes for the hemispheres. But on the other hand, gender inequalities are not predicted as well by any of these measures for the Global North as they are for the Global South, given the few significant values for the North.
Turning to specific input variables, most notable is that, among the gendered institutions, as predicted, women’s property ownership and family rights indeed are important to decreasing inequality everywhere—the major North–South difference is that literacy is unaffected by these rights and is already fairly universal in the Global North. But ownership and family rights inequalities remain correlated with increased secondary education gender gaps and with higher rates of maternal mortality and adolescent fertility in the Global North—which is a similar, but more limited, impact of these two rights than for the Global South.
However, in the Global North, because of the widespread availability of anti-violence laws (physical integrity) and civil liberties in dress and freedom of movement, neither measure predicts gendered outcomes. In contrast, in the Global South, where such laws and practices are more scattered, physical integrity is the most important predictor of five gendered education, political, and health inequality outcomes, and civil liberties affect the other two outcomes (labor force participation and son preference). These two gendered institutions account for most of the difference in number of predictive correlations between the North and South.
Among the political economic institutions, IMF debt is one of the most influential factors across both hemispheres—increasing inequality on two education and two women’s health outcomes, while significantly increasing women’s labor force participation and creating more equitable sex ratios in the Global South, but also negatively affecting secondary education and two health outcomes in the Global North. This impact is broader than one might expect, especially in the North, and substantiates the wide-ranging gender inequality declines associated with IMF loans.
Electoral democracy decreases inequality primarily in the areas of education and maternal mortality outcomes in the Global South, while in the Global North its impact is only on health measures—suggesting that equality in education and literacy are more universal there, regardless of democracy, but that maternal mortality and adolescent fertility rates both improve (i.e., the numbers decline) with democracy. In contrast, recent armed conflict and previous colonial status have huge negative impacts on gender inequality in the South, where all but labor force and parliamentary representation are affected. In contrast, ever having been a colony has no effect in the North (indeed, lack of postcolonial impact may be what makes countries global powers), while armed conflict affects only literacy there.
Thus all eight of the “input” structures influence gendered outcomes in the Global South, but only four do so in the Global North. Specifically, physical integrity, civil liberties, armed conflict, and having been a colony are sources of gendered inequality outcomes only in the South, while both North and South outcomes are influenced by family code, ownership rights, electoral democracy, and IMF debt. In the next section, I consider the overall Global South pattern variations, if any, across its constituent regions and how these might compare to the Global North.
One of the most intriguing findings is the variation across regions in the relative usefulness for predicting gender inequalities of gendered institutions (SIGI) versus political-economic variables. I located three distinct gender regime patterns for the six regions which are shown in Table 5. (North America is not included in this analysis because the number of cases is too low and the countries too similar, making it impossible to produce correlations among most variables.)
First, there are two regions—East Asia and the Pacific and South Asia—where neither the gendered institutions nor the political-economic structures have much influence on the seven inequality outcomes. There are four significant correlations for East Asia, two with SIGI variables and two with political-economic variables; and there are only three for South Asia, all with SIGI variables. This seems due to the relatively high levels of equality on input variables for East Asia. But for South Asia these particular input variables may not be the most explanatory for its several inequitable mean outcome measures. As an example of the latter problem, if sex ratio/son preference were used as in input, instead of an output variable, South Asia would have two more significant SIGI-related correlations—but still a total of only five. It is possible that South Asia might represent another pattern in which only gendered institutions, and not political-economic ones, affect gendered inequalities—but additional input variables are necessary to be sure. Table 5 includes the results for South Asia as representative of the “few predictors” pattern.
Second, the most common pattern is found in the three regions of Europe, Latin America, and the MENA countries, where the implicitly gendered political-economic variables are much more influential than are the explicitly gendered SIGI ones. There are only one or two significant correlations between SIGI institutional measures and inequality outcomes in each of these regions, and all involve either ownership rights or family code.
But in Europe, the MENA countries, and Latin America, most or all political-economic inputs have fourteen, eight, and nine significant correlations, respectively, with gender inequality outcomes. This result parallels the examination of mean differences earlier that suggest a Global North/European pattern for Latin America, but it is surprising that East Asia does not follow this gender regime too, and that instead the developing regions of the Middle East/North Africa and Latin America and the Caribbean do so.
An illustration of the correlational patterns of specific political-economic variables also is shown in Table 5 for the Middle East and North Africa. Note that IMF debt influences the most outcomes and thus has widespread impact, decreasing women’s relative literacy and secondary school enrolment, and increasing maternal mortality as well as adolescent fertility, while armed conflict also decreases both education measures. In contrast (not shown), in Latin America, armed conflict has the widest impact, while in Europe armed conflict, IMF debt, and democracy each influence four to five outcome variables. Thus, these three regions share the importance of political variables, but localized forces determine which ones are most important.
A third and final pattern, represented only by Sub-Saharan Africa, is one in which gender inequalities are correlated with both SIGI institutions and political-economic inputs. In popular beliefs, this pattern of multiple development structural problems is often attributed to the Global South as a whole. As shown in Table 5, within Sub-Saharan Africa there are eight significant correlations between inequality outcomes and SIGI inputs and five with political-economic input.
Specific outcomes for Sub-Saharan Africa confirm that every input variable is correlated with at least one inequality outcome. On the other hand, there are no predictors of women’s participation in national parliament, while most variables (five of the eight inputs) predict increased maternal mortality (and one predicts a decrease).
Conclusion
To summarize, multiple measures of gender inequality outcomes help us capture gender regimes, both in the Global North or South and across six more geographically focused regions. They represent an improvement over single number measures such as the GDI, GGI, or GEM, which do not capture the whole story—either across all the range of outcome variables or for all the subgroups of women. By themselves, they give little insight into the gender regimes that produced them.
Second, with multiple input and outcome measures, we see that while nations of the Global North and South are significantly different in their gendered institutions, their implicitly measured political-economic structures, and their gender inequality outcome measures, the Global South is much more varied than the North on many of these indicators, probably because of the great mixture of emerging and industrial economics within the South. Indeed, the North–South dichotomy is not a very accurate one on empirical or theoretical grounds.
Third, the regional mean differences in these input variables help to concretize why there is Global South variation—since Latin America and the Caribbean and East Asia generally approximate Global North patterns, while Sub-Saharan Africa and MENA nations do so for only some variables. Overall, the lack of antiviolence laws predict many inequality outcomes in the Global South, but not in the Global North, while ownership and family laws are influential everywhere, but they have less impact in the Global North. More specifically, within the Global South, South Asia and Sub-Saharan Africa tend to exhibit the most inequality, but it is not for the same constellation of inequality measures.
Finally, and most importantly, when we connect explicitly and implicitly gendered institutional structures with gender inequality outcomes, at least three different gender regimes become visible. In East Asia and South Asia few of the included factors explain gendered inequalities: East Asia may be fairly equitable already and/or South Asia may require different input measures to explain its gender regime. Meanwhile, in Europe, Latin America, and the MENA countries, political and economic factors have the most explanatory power—perhaps because these countries have tried to reduce the more explicit gender inequalities. But in Sub-Saharan Africa both SIGI and political-economic factors significantly influence inequality, with slightly more impact by SIGI, following the stereotyped image of the Global South as having many problems, but also suggesting the need to work for change on several fronts.
These findings represent an important beginning for understanding global gender inequality regimes, and especially for illustrating that these regimes (or patriarchy) take different forms across regions within the Global South. I plan to continue focusing on the methodological goal of deconstructing and better specifying the gendered inputs, and the empirical/theoretical goals of examining within-region variations, as well as how regional gender regimes may be decomposed into global, regional, local, and “cross-cutting factors” (Bose 2011).
Footnotes
Acknowledgements
Many thanks to everyone who strengthened the final article, most especially Edna Acosta-Belén and Myra Marx Ferree, whose comments clarified and better specified my argument, and to Wen-Ling Kung for her expert help in coding variables. Also thanks to audience members attending the lectures at the 2014 ASA meetings in San Francisco and at Texas A&M University in 2015, whose questions sparked ideas to further my analysis. Most importantly, I want to thank the members of Sociologists for Women in Society, who provided me with the opportunity and honor of being the 2014 Distinguished Feminist Lecturer.
Christine E. Bose is Professor Emerita of Sociology, University at Albany, SUNY, with joint appointments in LACS and Women’s, Gender, and Sexuality Studies. She is past President of ESS and SWS, and past Editor of Gender & Society. Her interests are global gender inequalities, gendered labor market issues, and intersectionality.