




Abstract
The most popular use of wood–plastic composite (WPC) members in the United States has been as outdoor decking material in residential construction. If the use of these products expands into more structural applications, such as beams and joists, it is imperative that the material’s mechanical behavior be understood. Since most of the potential structural uses of this material are as flexural members, it is particularly important that the response to this mode of loading is well characterized. Like many filled polymers, WPCs are anisotropic and bimodal, and thus their shear and two axial moduli (tension and compression) must be determined separately. This study determined the shear and axial moduli of six WPC formulations (mainly polypropylene, high-density polyethylene, and low-density polyethylene) by testing prismatic members in bending at multiple span-to-depth ratios. The initial moduli were determined from constant strain rate tests, and their time dependencies were found using creep tests. The resulting axial-to-shear moduli ratios were shown to be greater than 25 for all formulations. The ratios were relatively constant over time at low stress levels, while decreasing over time at high stress levels.
Introduction
Wood–plastic composite (WPC) products are composed of wood flour particles, generally less than 250 μm in size, embedded in a thermoplastic matrix. The two constituents are combined while the polymer is in a molten state, and the composite is extruded into its final shape. Polyethylene is the most common plastic utilized, making up roughly 90% of the total volume of thermoplastic used in WPCs each year. 1 Because of their polymer component, these products are generally viewed as moisture and degradation resistant and are predominately used in outdoor applications such as deck board and window trim. 2 Given the success of WPCs as a low-maintenance replacement for semi-structural outdoor wood products, 3 manufacturers will naturally target new load-bearing WPC products to similar areas. It has been shown that these materials have relatively low strength and stiffness, 4 which will likely dictate that any structural applications will be limited to relatively low stresses. Potential uses include joists in residential and commercial decking as well as stringers and beams in bridges. Current test standards and building codes do not allow WPC products to be used in structural members beyond deck boards and railings. 5 Several pilot bridge projects have, however, been constructed of recycled plastic lumber, a similar product that does not contain wood filler. 6 The nature of the potential applications necessitate that the predominant loading mode of structural WPC products will likely be flexure. As a result, it is imperative that the relative importance of shear deflection be determined so that design provisions can be established that reliably predict overall bending deformation.
The wood flour in WPCs acts as filler that stiffens the polymer matrix, but like many filled plastics, the overall mechanical behavior is anisotropic nonlinear viscoelastic. 7 Research into the mechanical performance of WPC materials has mostly focused on the strength and constitutive response in flexure with reference to the axial direction. While much of the work has been conducted on the instantaneous stiffness, see Bechle 8 for a review, a few investigations have been performed on creep response, such as by Kobbe. 9 Only one study by Lockyear 10 has investigated the quasi-static shear response of WPCs. No known study has been conducted on the time dependence of the shear modulus. Multidimensional deformation mechanics have been considered for pure thermoplastics, but these studies have assumed isotropy, homogeneity, and linear viscoelasticity. 11 The approach for thermoplastics has been to extend the Hookean elasticity relationships into analogous time-dependent equations that utilize time-dependent moduli, such as the relaxation modulus, E(t), and the contraction (Poisson’s) ratio. 12
Evaluating the shear properties of WPCs is addressed by ASTM D7031, 13 but only quasi-static shear strength is addressed. The evaluation of flexural creep 14 and shear strength 15 for plastic lumber is standardized by similar methods, but neither of these documents discusses the shear modulus or its time dependence. Theoretically, the shear modulus can be determined easily by applying pure shear through torsion tests; however, there are practical disadvantages to these tests. Lockyear 10 compared this method with the estimates of the shear modulus from flexure tests with various span-to-depth ratios, as outlined in ASTM D198 16 and found that the torsion test resulted in a modulus significantly greater than the multispan value. He concluded that ASTM D198 was an acceptable method to estimate the shear modulus for members that will experience flexure. Several other time-dependent shear test methods have been suggested, 12, 17 but in order to accommodate the largest number of tests in the space available, the shear modulus was determined using ASTM D198, 16 the multi span-to-depth ratio approach.
Determining the shear modulus and its time dependence is an extra step that is not normally performed when characterizing a WPC material. Requiring this data adds time and expense to any testing regimen that determines mechanical properties. Establishing a consistent relationship between the axial and shear moduli would simplify the testing necessary to characterize these materials. The objective of this study was to investigate the relationship between the axial and shear moduli and examine its evolution over time under sustained load.
Plane stress relaxation moduli tensor
The multidimensional constitutive relation for filled polymers that exhibit anisotropic nonlinear viscoelastic behavior can be expressed using a time-dependent fourth order tensor. If fully anisotropic, this tensor has 21 independent constants. Applying transverse isotropy, however, reduces the number of independent moduli to 5, and this reduction has been verified for viscoelastic materials. 18 The microstructure of WPCs is heterogeneous, 19 but the materials exhibit relative uniformity at larger scales. The mechanical properties have been shown to vary in the extrusion direction, 20 but they exhibit enough symmetry to apply transverse isotropy.
WPC products are usually thin or thin-walled sections with one dimension that is significantly smaller than the others. The product’s behavior can therefore be modeled using the plane stress condition, further reducing the number of independent constants to 4. It is known that the lateral contraction ratio varies relatively little with time and is generally considered constant.
21
The resulting relaxation moduli matrix can be expressed as

where C 11 and C 22 are the relaxation moduli in the principle axial directions, C 33 is shear relaxation modulus in the 12 plane, and C 12 quantifies the lateral contraction behavior. The time-dependent axial modulus parallel to the extrusion direction, C 11(t), has been the focus of some previous research on WPCs, 4 but little information is available for the moduli perpendicular to the extrusion direction. The time-independent moduli parallel (C 11) and perpendicular (C 22) to the extrusion direction were both measured for several WPC products by Haiar, 20 but neither the relationship between them nor their time dependence was addressed. It was found that the exact determination of C 22 does not have a significant effect on global flexural deformation and was not explicitly determined for this study.
The focus of this study was to relate the time-dependent axial modulus in the extrusion direction (C
11) and the shear modulus (C
33). While the ratio of these two moduli
Experimental procedures
Coupon specimens at four different span-to-depth ratios (8, 16, 24, and 32) were subjected to quasi-static ramp loading in order to investigate the shear behavior of WPC materials in flexure. Similar specimens were subjected to sustained creep loads at three different span-to-depth ratios (8, 16, and 32) in order to determine the time dependence of the shear response.
Materials and specimens
In order to obtain a realistic sample of the behavior of commercially available WPC products, this study utilized a variety of polymers, wood types, manufacturers, and product cross sections. Six formulations from five different producers were selected. Four of the formulations (C, D, F, and L) were primarily polyethylene, while the remaining two were produced with polypropylene (A and Z). Formulation F was a foamed product that was significantly different from the others. Both polypropylene formulations were extruded as closed-box members, while the others all had solid rectangular cross section. Further details about the materials and the products can be found in Hamel et al. 4
The coupon specimens were rectangular in cross section with nominal dimensions of 10 mm × 12 mm. Coupon specimens were cut from the center of the full-sized products’ cross section where the maximum shear stresses occur. The surface “skin” layer was removed and the specimens were cut such that the orientation of stresses would align with those expected in the full-sized boards subjected to bending. When possible, specimens were taken from multiple boards.
Quasi-static ramp testing
Experimental tests were performed on coupon specimens subjected to bending at different span-to-depth (L/d) ratios in order to determine the initial shear and axial moduli for each formulation. Ten specimens of each formulation were cut and measured and each specimen was tested in bending at four different L/d ratios (8, 16, 24, and 32).
The quasi-static tests were conducted on a servomechanical testing machine in flatwise 3-point bending according to ASTM D790.
22
A monotonically increasing midspan deflection was imposed using an Instron test machine to correspond to an extreme fiber strain rate of 1%/min. The crosshead speed was determined using the equation
Determination of the long-term creep stress levels
The creep bending tests were performed with the members loaded such that the extreme tensile fibers experienced two nominal axial stress levels: 20 and 50% of the average tensile failure strength, which was determined in a series of ramp tests, as described by Hamel et al. 4 Due to the nonlinear nature of the material’s constitutive behavior, a finite element model was required to calculate this load for each stress level. As described by Rogers and Pipkin, 18 these stresses were calculated with a user-created finite element model written with a commercial software ADINA 8.4, which is produced by ADINA R&D Inc (Watertown, MA). Using the results of this analysis, appropriate coupon bending loads were determined. These loads and the corresponding extreme fiber tension stresses are shown in Table 1.
Bending loads for creep specimens.

Long-term creep testing
Creep tests were conducted for each formulation in 3-point bending by hanging weights from the midspan of the specimens at (Figure 1) three different L/d ratios (8, 16, and 32). One specimen for every L/d ratio was tested at each of the two selected stress level, 20 and 50% of the ultimate tensile strength, resulting in six bending specimens/formulation (36 tests total). The loads were maintained on the specimens for 3 years or until failure. Stress levels were chosen with the aim of preserving the specimens throughout the prescribed time period, but despite these efforts, several specimens at the higher stress level failed or exceeded the instrumentation limits. Those that failed were restarted with new specimens.
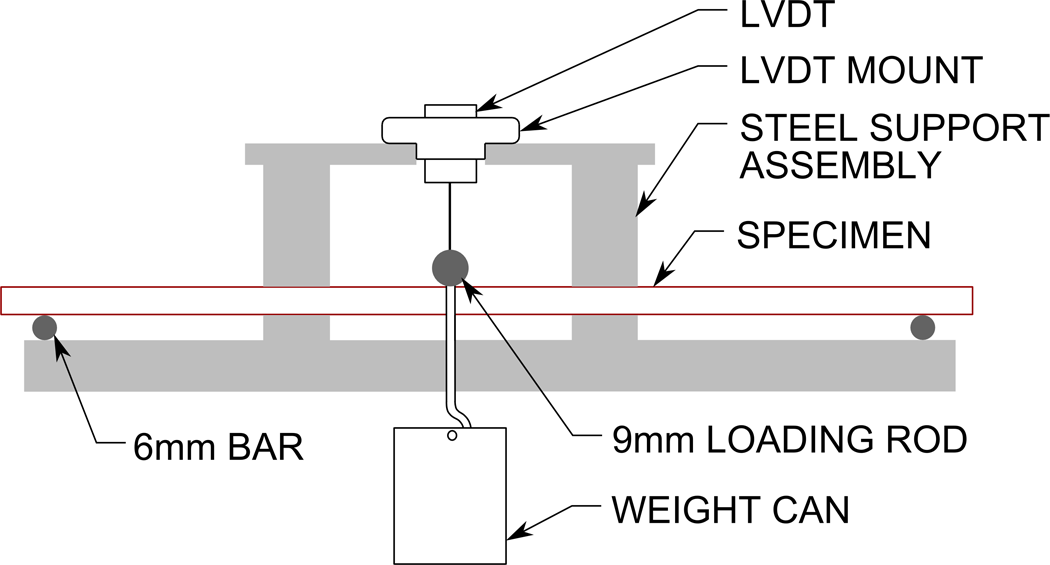
Coupon bending creep apparatus.
The specimens were supported by 6.5 mm diameter steel bars. Weights were hung from a 9.5-mm diameter horizontal steel loading rod, which rested on top of the specimens at midspan. The top of the loading rod was connected to an LVDT suspended above the specimen (Figure 1). LVDT ranges varied from ± 0.25 to 12 mm depending on the expected creep deflection. The deflection was recorded using a data acquisition program written in LabVIEW, a product of National Instruments Inc. The recording interval was 1s at the beginning of the experiment, was slowly increased over the first 50 h to 10 min, and then remained at 10 min for the duration of the test. The experiments were conducted in an environmentally conditioned room at 25°C and 50% RH.
Results
Initial time-independent moduli
The initial shear modulus (G
ini) and Young’s modulus (E
ini) were determined using several simplifying assumptions. It was assumed that the bending coupons behaved as an isotropic linear elastic material for strain levels less than 0.1%. Using Timoshenko’s theory of deflection,
23
the deflection (▵) at midspan takes the familiar form
where P is the load, L is the length of the span, I is the moment of inertia, A
s is the shear area of the cross section, and E
ini and G
ini are the initial axial and shear modulus, respectively. For specimens with a rectangular cross section, equation (2) can be rearranged into the following more convenient form
where
In order to determine the variation in the material, a linear mixed-effects model was created, as described by Pinheiro and Bates,
24
which includes both fixed and random effects. The fixed effects represent the material parameters associated with the model, (E
ini and G
ini), while the random effects represent the variation between the specimens and in the testing process. The standard error of the fixed effects represents the uncertainty associated with each parameter’s estimate, which will be reduced if the data set is increased. The random effects represented material variation and are modeled using random variables with a normal distribution about zero. Statistical analysis revealed that for this set of data, accurate estimates can be obtained without a random effect associated with the shear modulus. Thus, the mixed-effects model is given by the following equation
where
It can be seen in Table 2 that for each formulation, the initial axial modulus is between 25 and 65 times the corresponding shear modulus, with an average axial-to-shear moduli ratio of 42. Most of the measured initial axial moduli of the WPC formulations are roughly half that of typical wood species (8000–15,000 MPa), while the WPC shear moduli are much less than wood, which are on the order of 500 MPa. The resulting ratios of E ini to G ini are significantly higher than wood, for which this ratio is generally around 15. 25
Initial moduli for quasi-static tests in mega Pascal.

cov: coefficient of variance.
aRandom effect divided by fixed effect value.
bStandard error of fixed effect divided by fixed effect value.
Time dependence of axial-to-shear moduli ratio
The goal of the creep testing program was to determine the time-dependent evolution of the ratio of the axial and shear relaxation moduli, β (t). This is important because the required material testing and analysis of a member subjected to time-dependent bending is simplified if either the moduli ratio β (t) or the shear relaxation modulus G(t) can be approximated as constant over time.
Unlike the quasi-static test program, the time-dependent bending tests at the three different L/d ratios were necessarily conducted on different specimens. Given the magnitude of the variation in the material behavior demonstrated in the quasi-static testing, this variation across the three specimens in the creep tests might more heavily influence the result of equation (3) than the change in L/d ratio meant to separate the shear and axial moduli. For example, if the slender specimen (L/d = 32) is composed of material that is softer than the other two coupons, then the calculated shear modulus will be artificially high. In order to remove the influence of these specimen variations, the initial deflection of each specimen was adjusted to a target value that represented the material’s average quasi-static response. Adjusting the deflections, allowed the modulus ratio, β, at the start of each creep test to match those found in Table 2.
The target values of the initial deflections were calculated using a variant of equation (2) in which the initial axial tangent modulus, E ini, was replaced with a stress-dependent secant modulus, E(σ). Replacing the shear modulus in an analogous manner is not necessary because the 3-point bending condition produces very low shear stresses with respect to the ultimate shear strength, 20 allowing the use of the initial modulus. The axial secant modulus was determined using the stress level at the extreme fiber and the constitutive relations developed by Hamel et al. 4 The target deflection would have ideally been applied at the end of the ramp loading and the start of creep. However, despite electronic deflection measurements at 5 Hz, the material’s viscoelasticity made it impossible to determine the time at which loading was finished and creep began. For consistency, a time of 36 s (0.01 h) was chosen as the start of creep and the deflection at this time was adjusted to the target deflection value.
Once the initial creep deflection values were properly adjusted, the moduli were calculated by regression analysis using equation (3) at each recorded time interval. In order to compare all the formulations, the time-dependent modulus ratio β
(t) ratios were normalized by dividing them by their initial, quasi-static value
The results of the time-dependent shear modulus, normalized by the initial shear modulus can be seen in Figure 2. It is clear that the shear modulus, G(t), is decreasing with time. This is the expected response for viscoelastic materials, which soften when stress is applied. It can also be seen in Figure 2 that the stress and time-dependent responses vary across different materials.

Normalized shear modulus as a function of time.
Figures 3 and 4 show the time-dependent normalized creep modulus ratio,
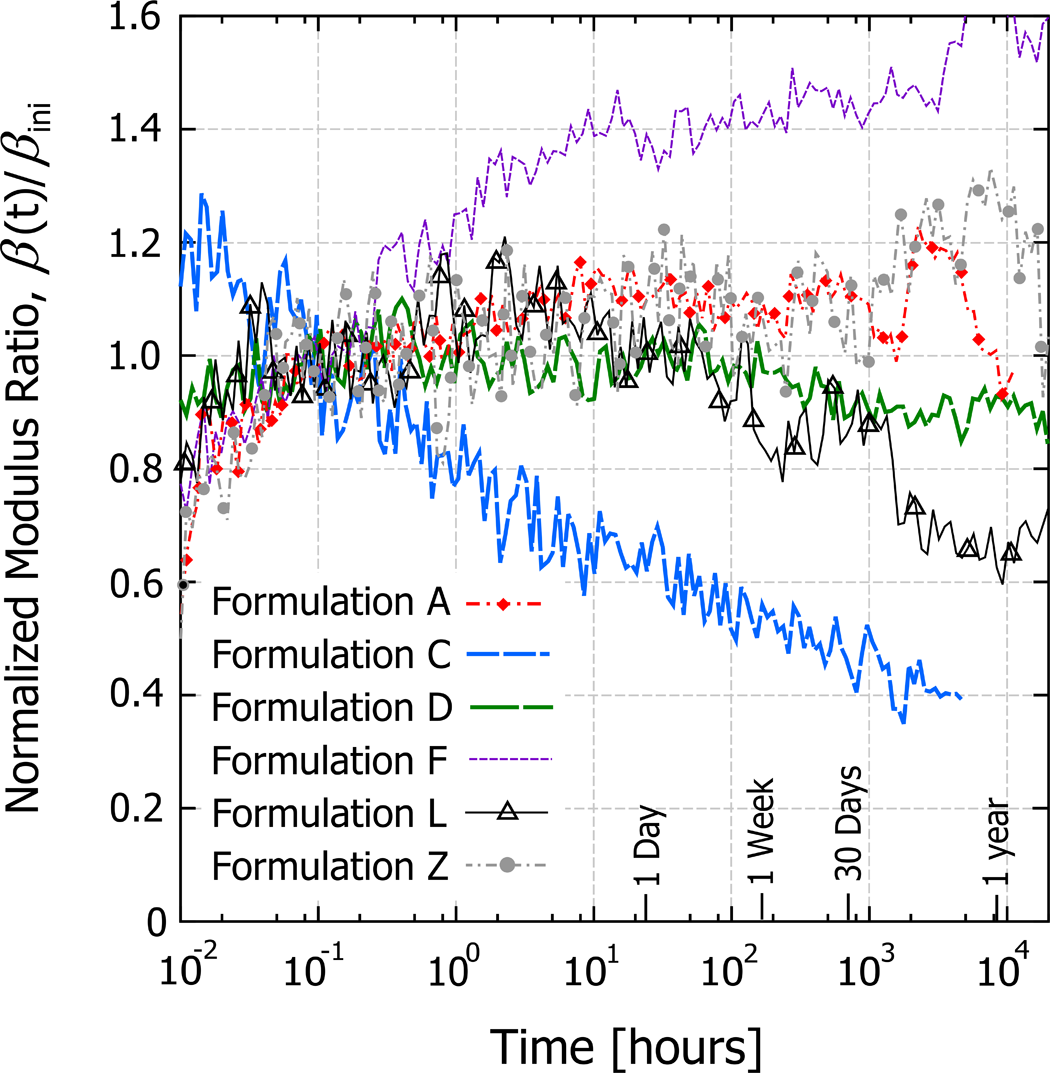
Normalized modulus ratio as a function of time for axial stress of 20% of the ultimate tensile strength.
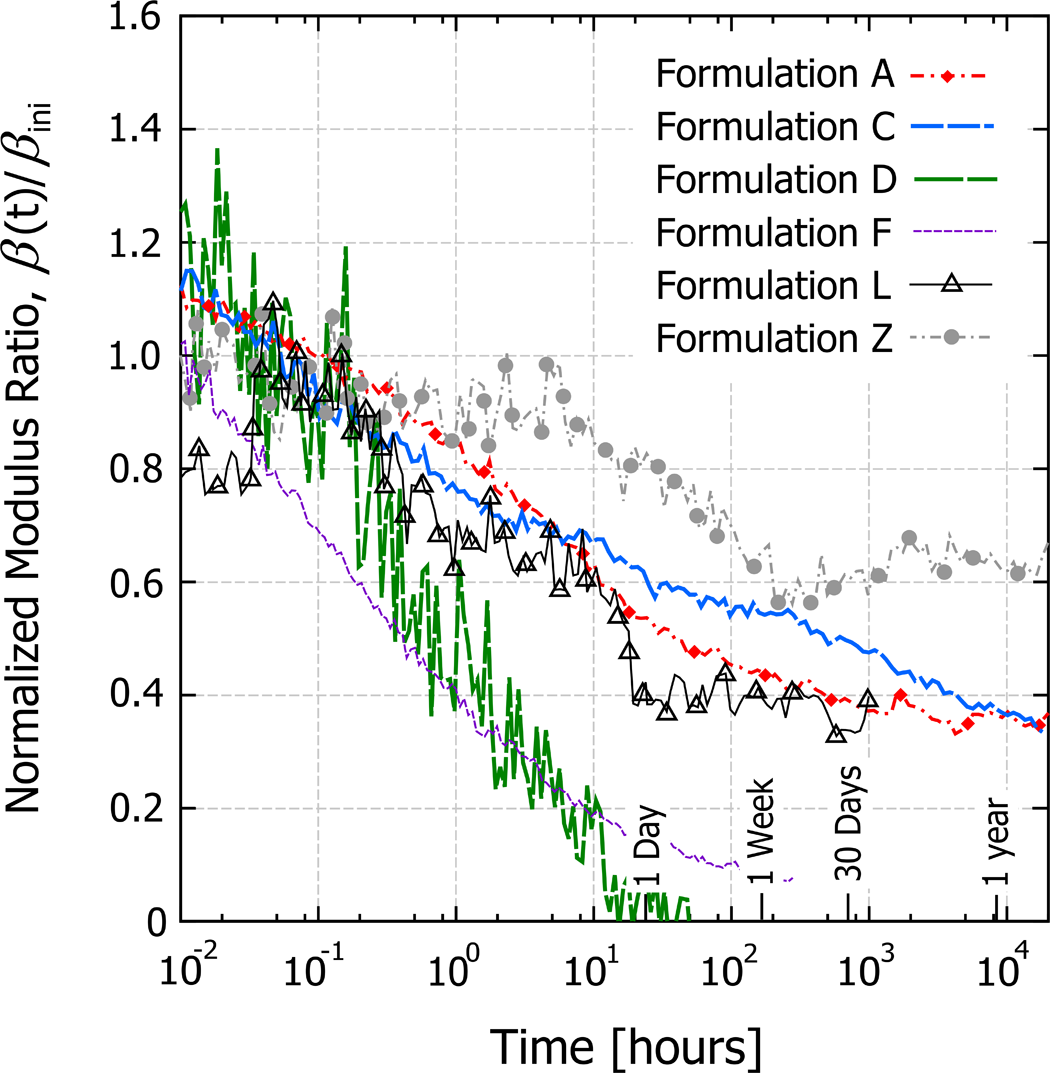
Normalized modulus ratio as a function of time for axial stress of 50% of the ultimate tensile strength.
It is clear from the figures that β does not vary significantly with time for the lower stress level, while decreasing noticeably at the higher stress. There are two exceptions to this observation, Formulation C and Formulation F. It is not clear why there is an increase in the ratio for most of the formulations at the lower stress level during the first few minutes, but it is likely related to the complicated transition between loading and creep, which was characterized in Hamel et al. 4
The modulus ratio, β, decreases with time for formulation C at both load levels, indicating that E(t) is decreasing faster than G(t). Formulation C contains a coupling agent, which was observed to significantly increase the material’s strength without affecting its stiffness properties. Because the applied stress levels were chosen based on the ultimate tensile strength, this resulted in much higher loads for formulation C than other polyethylene formulations, such as formulations D and L, as seen in Table 1. Thus, it is likely that because of its higher ultimate strength, the load for formulation C exceeded the level at which a constant β is observed. Formulation F increases with time at the 20% load level, indicating that the shear modulus, G(t) is decreasing faster than the axial stiffness. Because of the foamed nature of this formulation, its response is complicated by the interaction of entrapped air bubbles.
Conclusions
The relationship between the axial and shear moduli for six WPC formulations was investigated by applying quasi-static bending loads to specimens at several different span-to-depth ratios and measuring the resulting deflection. The material variation of each formulation’s quasi-static moduli was evaluated using a linear mixed-effects statistical model. The evolution of the moduli relationship over time was evaluated by applying sustained loads to various span-to-depth ratios for 3 years.
The WPC materials in this study were found to have axial moduli that were between 25 and 65 times higher than their corresponding shear moduli. This made shear deformations significant in beams with a span-to-depth ratio less than 16. In some of the formulations tested, shear deformations in beams with low span-to-depth ratios were responsible for as much as half of the total deflection. Given its relatively low stiffness, WPC bending members will likely be designed with low span-to-depth ratios, similar to dimension lumber. The significant deformations associated with applied shear stress for these types of beams means that it is critical to quantify and account for shear deformations in WPC bending. This is particularly true if the cross sections are to be axially reinforced with a stiffer material, such as fiberglass-reinforced plastic or steel.
It was also shown in this study that at low stress levels, the ratio of the axial stiffness to shear stiffness, β, remained relatively constant with time for all non-foamed formulations. This behavior did not hold true at stress levels above 20% of the ultimate strength, at which point the axial modulus decreased faster than the shear modulus. This observation allows the axial and shear moduli to be tied together with respect to time for stress levels below 20%, meaning that once their relationship has been established, the time-dependence of only one of the moduli, presumably the axial, must be tested.
The test methods were found to be adequate for this study but several improvements are recommended, if repeated. It was found that the deflections of specimens with a depth of 12 mm and an L/d of 8 were on the order of 0.2 mm, making them difficult to measure accurately. Varying the depth of the specimens instead of the span to obtain various L/d ratios would increase the overall deflections producing more accurate measurements. In addition, the sensitivity of the shear modulus on the smallest L/d ratio could be reduced and the calculation of the shear and axial moduli improved by introducing a fourth span-to-depth ratio in the creep tests, as was done in the quasi-static testing. Finally, adding a second creep specimen to each L/d ratio would help to account for material variability. The additional tests would be recommended at the expense of the number of formulations as it was evident during the data processing that accurate calculations and quantifying material variability was more important than encompassing a large number of formulations.
Footnotes
Funding
This research was supported by the National Research Initiative of the USDA Cooperative State Research, Education and Extension Service (grant number 2005-35103-15230).