
Abstract
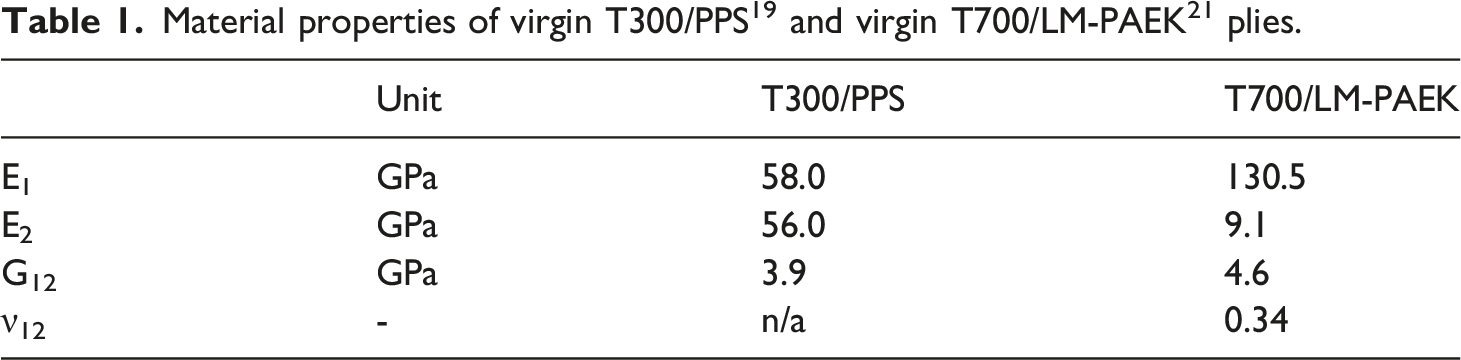
Thermoplastic welded single-lap shear joints made from sandwich-like adherends with a recycled core and virgin face sheets are tested to measure their load-carrying capacity and to quantify damage growth. The results are compared with single-lap shear joints entirely made from laminates consisting of virgin materials. The adherend constituents are T300/polyphenylene sulfide (T300/PPS) and T700/low-melt polyaryletherketone (T700/LM-PAEK), joined via induction and conduction welding, respectively. Test bench data, digital image correlation, a high-speed camera, and microscopy are used to evaluate the structural response of the specimens. Damage initiation and propagation are heavily influenced by the actually welded interface regions. While the virgin joints only experience damage growth along the welded interface, adherend failure can also occur in the recycled core joints. The recycled core joints show a reduced lap shear strength compared to their virgin counterparts, limited to less than 14% for the induction welded T300/PPS specimens and around 40% for the conduction welded T700/LM-PAEK specimens. Despite the reduction in load-carrying capacity, recycled core joints may be considered as a suitable alternative in scenarios where the requirements for mechanical properties are less dominant and environmental considerations are more relevant.
Introduction
The European Union aims to combat climate change by transforming Europe into the first climate-neutral continent by 2050. 1 The aerospace industry, as part of the transport sector, is contributing to this endeavor and aspires to reduce its environmental impact by 90% compared to 1990 levels. 2 It is important to take into account that, next to the environmental damage caused by burning jet fuel, there is a significant ecological cost associated with the resources used for manufacturing and maintaining aeroplanes. Hence, recycling is a key aspect of rendering the aeronautical value chain more sustainable. Naturally, choosing both a suitable material and a fitting manufacturing technique plays an important role in reaching these goals.
Thermoplastic fiber-reinforced polymers combine several properties that are advantageous for designing environmentally friendly aeronautical structures. They feature a high strength-to-weight ratio, high impact resistance, high fracture toughness, thermal stability, chemical resistance, and, critically, the potential for recycling. 3 Thermoplastic fiber-reinforced polymers are also suitable candidates for thermoplastic welding which creates a microstructure at the joint interface that is physically indistinguishable from the surrounding material. 4 Hence, thermoplastic welded joints can face reduced certification requirements compared to more traditional joining methods like bolting or adhesive bonding.
Recycling techniques for carbon-fiber reinforced polymers can be grouped into three categories: thermal, chemical, and mechanical recycling. 5 The main objective of thermal and chemical recycling is the recovery of the carbon fibers by removing the surrounding polymer. Afterwards, virgin polymers can be added to the recycled fibers to manufacture new thermoplastic composites. In contrast, mechanical recycling works by grinding or milling the entire fiber-matrix compound to smaller sizes which range from a fine powder to fibrous recyclate. 6 The short fiber material is typically reused as filler material in sheet molding compounds or together with virgin resin for injection molding.
It is well known that recycling has a negative impact on the material properties of the recyclate where the extent of the property degradation depends on the specific recycling technique. Mechanically recycled carbon fibers retain 50–65% of their original tensile strength. 6 The range for thermal recycling is larger because polymer often remains on the fiber surface. Chemical recycling yields clean fiber surfaces which leads to the most consistent tensile strength recovery rates with values ranging between 82% and 98%. 6 While thermal and chemical recycling provide the highest potential, mechanical recycling is the most mature process from a technological standpoint.7,8
Regarding techniques for joining thermoplastic composites, welding is an active field of research since the 1980s. 9 Many different welding techniques exist, for example resistance, ultrasonic, induction, and conduction welding. Villegas et al. 4 manufactured ultrasonic, induction, and resistance welded thermoplastic single-lap shear (SLS) joints made from a fabric carbon fiber polyphenylene sulphide (CF/PPS) composite. The authors carried out static and fatigue tests and determined comparable lap shear strengths between the three joining methods, but noted that resistance welding led to incomplete welds. A similar study was conducted by Korycki et al. 10 for carbon fiber reinforced polyetheretherketone (CF/PEEK) SLS joints that they manufactured using ultrasonic, induction, and transmission laser welding. In this study, the experiments showed a significant variance between the different welding techniques that the researchers attributed to the use of a polyethylenimine (PEI) energy director for ultrasonic welding.
The static and fatigue behavior of induction welded carbon-fiber reinforced polyetherketoneketone (CF/PEKK) SLS joints was investigated by Kwon et al. 11 who also modeled the heat distribution during welding with the finite element (FE) method. The authors highlighted the importance of optimizing the welding process parameters to produce joints with a high shear strength. Zhang et al. 12 investigated the use of short carbon fibers in the weld line to further increase the lap shear strength of induction welded composite joints.
Conduction welded SLS joints made from CF/PEKK were evaluated experimentally and numerically by Tijs et al. 13 They found that the joint strength was not only significantly influenced by the failure mechanisms of the welded interface, but also by the failure mechanisms of the surrounding plies. Another study by Tijs et al. 14 highlights the influence of the manufacturing process on the mechanical properties of the joint.
Frederick et al. 15 investigated the disassembly of an ultrasonically welded joint through resistance heating by depositing a nanocomposite film at the weld interface. This allows replacing one or both of the adherends for reuse or recycling. The study of Oliveira et al. 16 involved a recycled adherend material. They manufactured sandwich-like SLS joints with upcycled polyethylene (PE) bottle caps as core material and glass fiber composites as face sheets using ultrasonic welding to test the joints under static and dynamic loads.
Recycled element-level structures were studied by Roux et al. 17 who applied electrodynamical fragmentation to virgin CF/PEEK rotorcraft door hinges. They used the resulting recyclate material to compression mold another set of door hinges and found that the static ultimate load of these hinges decreased by 17% compared to the original structures. Kim et al. 18 manufactured overhead bin door pin brackets from mechanically recycled CF/PEEK via compression molding. They tested four different designs to showcase the structural performance enhancement of the door pin brackets by integrating various degrees of continuous fiber-reinforced precuts.
While many studies explore examine either thermoplastic welded joints or recycled fiber-reinforced composite structures, research into recycled thermoplastic welded composite joints remains limited. This paper presents an experimental investigation into the mechanical behavior of recycled core SLS joints that are manufactured by induction welding at the Dutch Aerospace Center (NLR), and by conduction welding at Collins Dutch Thermoplastic Components (DTC). The studied structural response and the obtained mechanical properties are compared to SLS joints made by virgins materials welded with the same techniques. Both virgin and recycled core SLS joints are experimentally tested in quasi-static conditions until failure to investigate their strength, stiffness, damage tolerance, and failure mechanisms using digital image correlation, a high-speed camera, and microscopy.
Single-Lap Shear Joints and Experimental Procedures
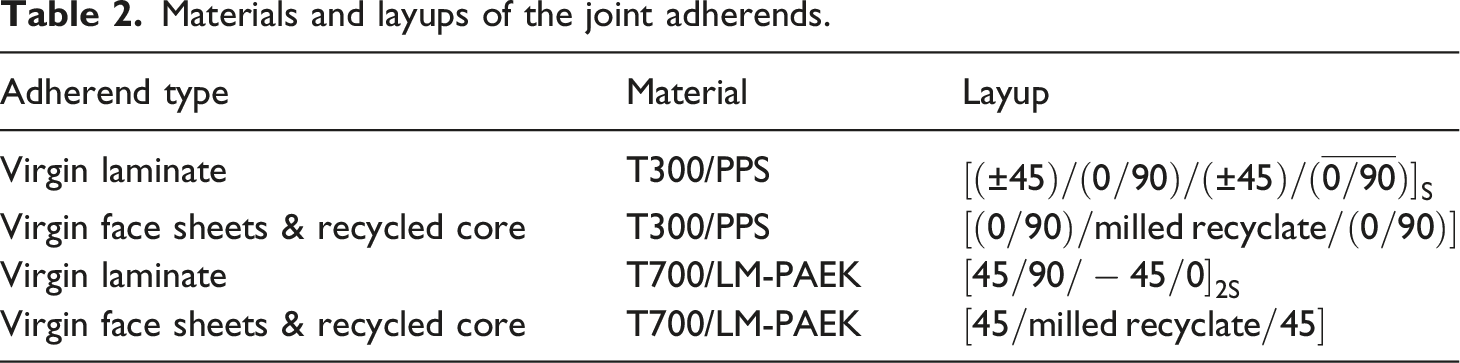
Materials and layups of the joint adherends.
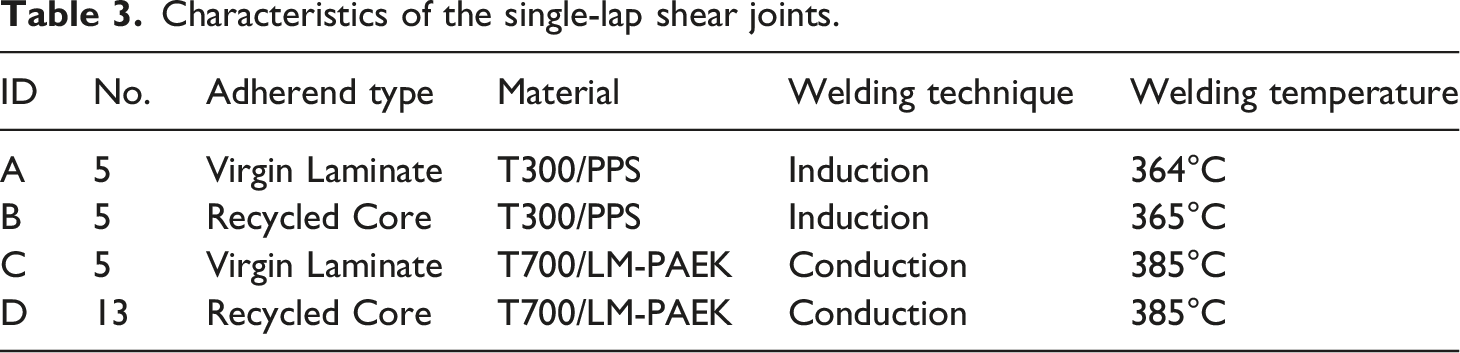
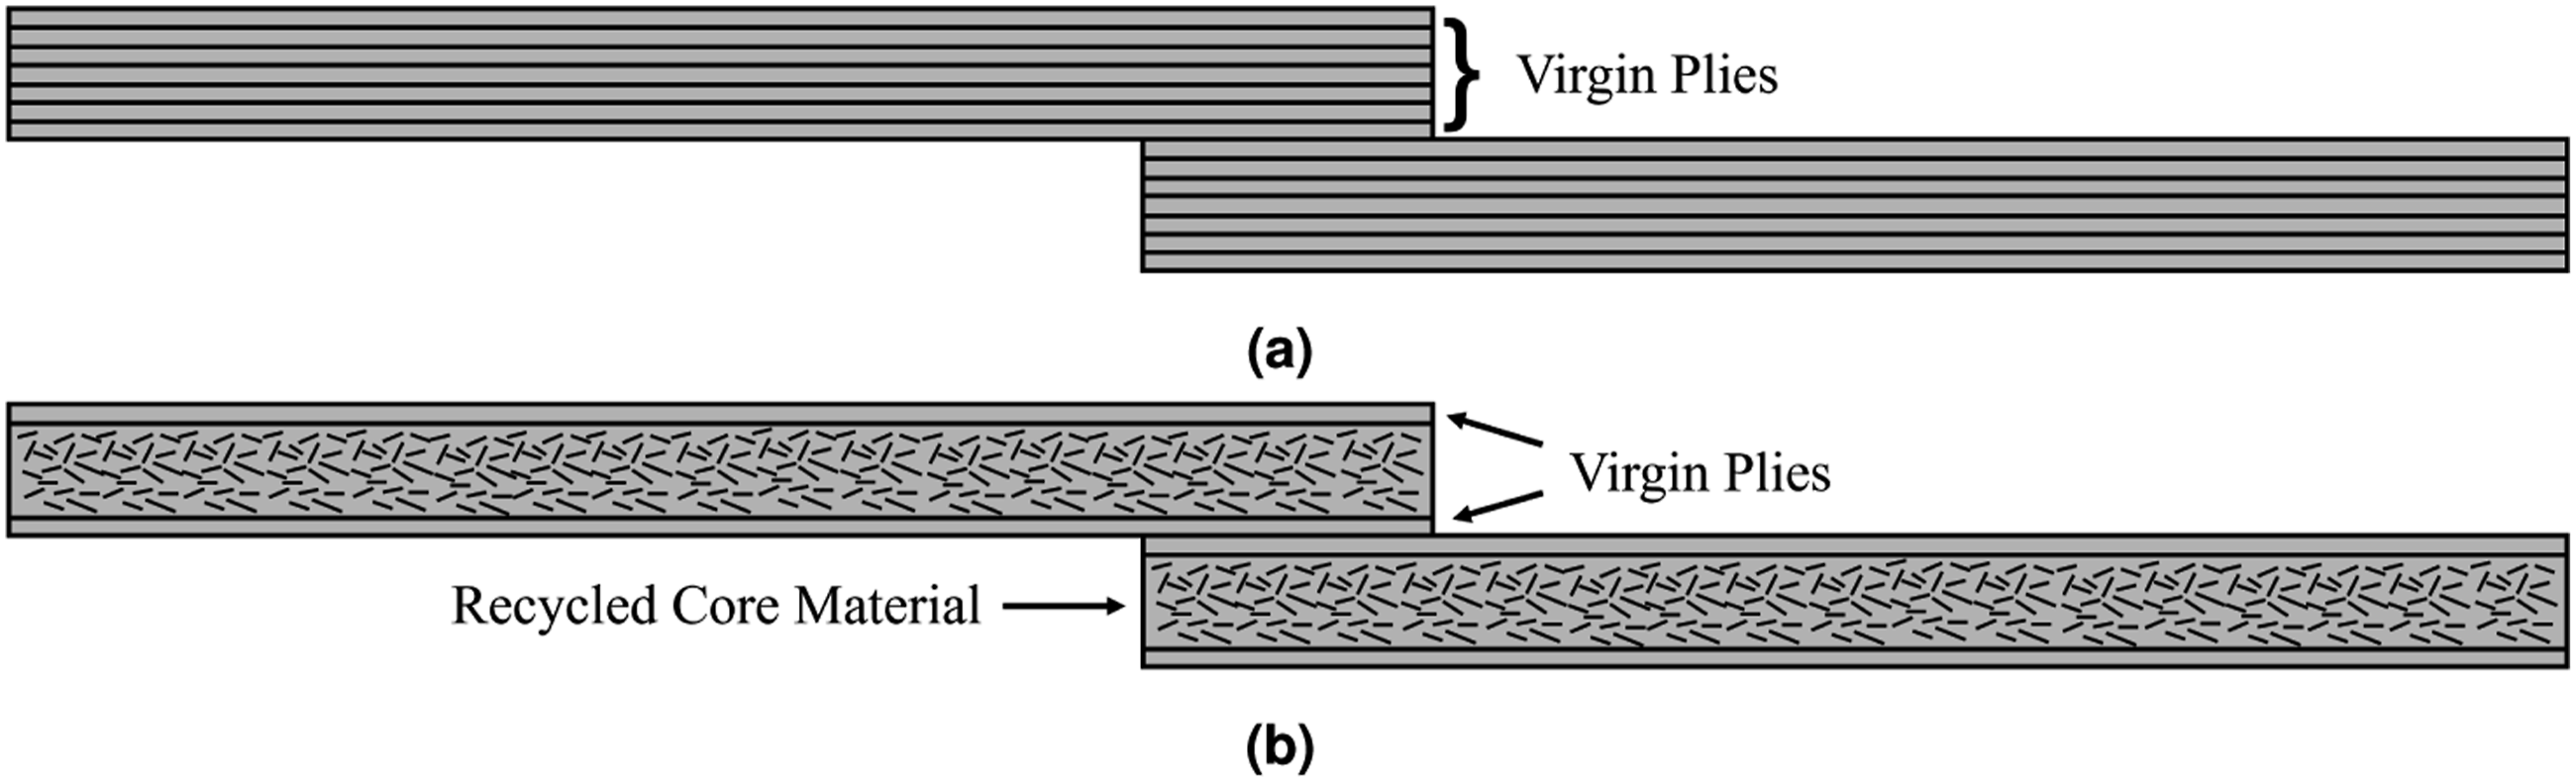
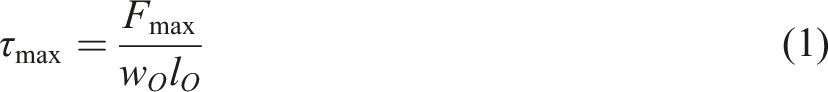
Thermoplastic welding is used to manufacture the SLS joints. The T300/PPS adherends are joined via induction welding at the NLR. Induction welding, illustrated in Figure 1(a), works by moving an induction coil along the weld area which induces an eddy current. Heat is generated by the electric resistance of the material. The polymer melts locally and reconsolidates as it cools down. The T700/LM-PAEK adherends are joined by DTC using conduction welding. For conduction welding, heat is transferred to the weld region via a hot metal stamp that is pressed onto the overlapping adherends as sketched in Figure 1(b). After welding, the specimens are cut to a width of 25.4 mm. Table 3 provides a summary of the SLS joint specimens available for testing. The cross-sections of the thermoplastic welded SLS joints are presented in Figure 2 to highlight the difference between the joints made from virgin plies and the joints that feature recycled material. Manufacturing of the single-lap shear joints using (a) induction and (b) conduction welding. Characteristics of the single-lap shear joints. Cross-section of (a) virgin and (b) recycled core specimens (not to scale).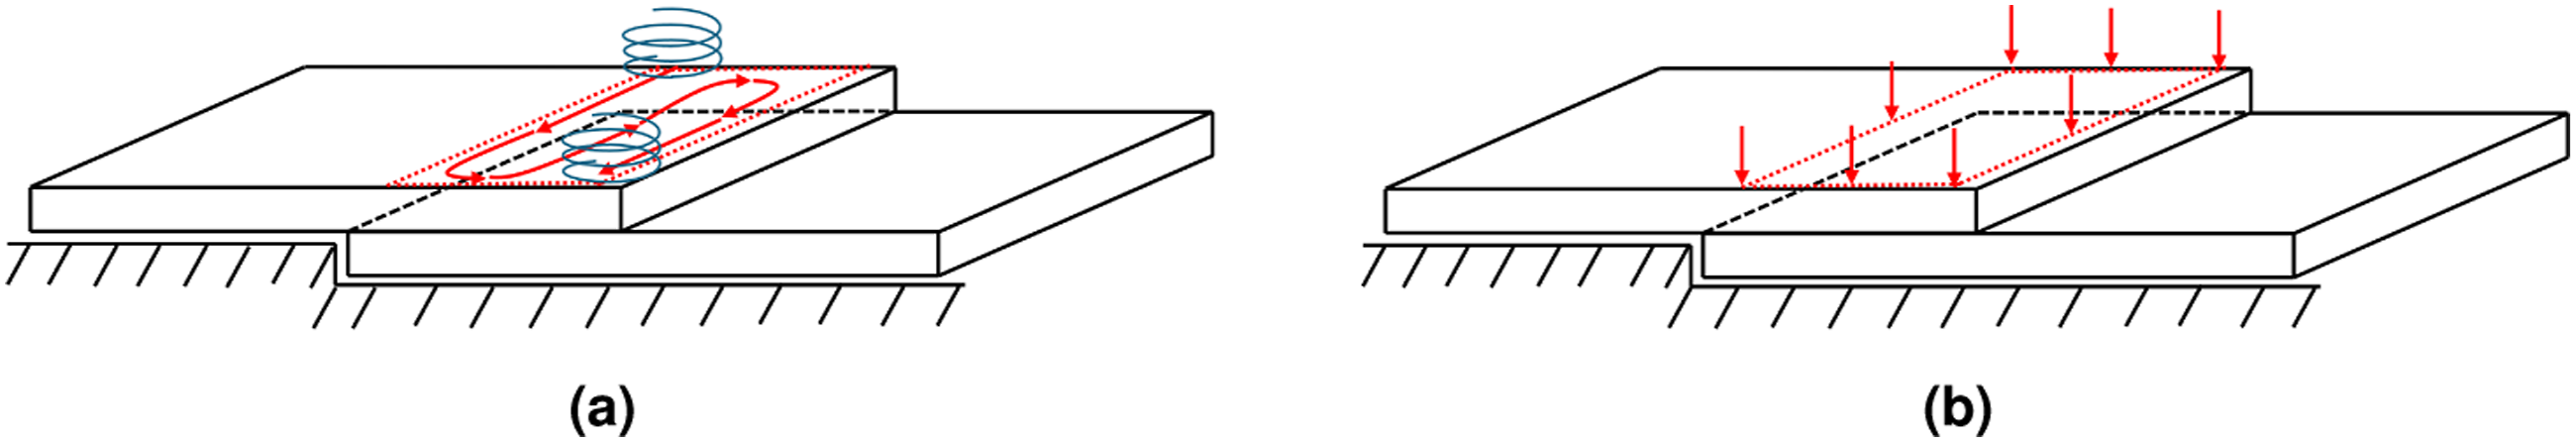
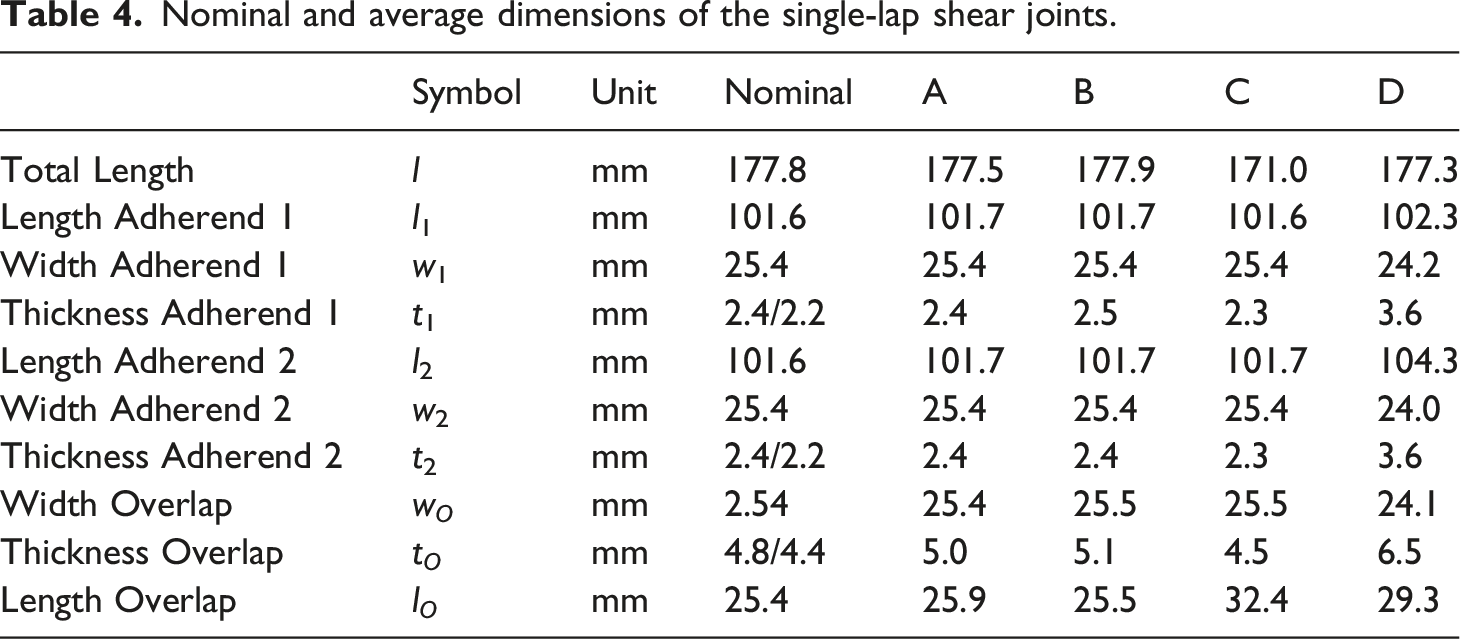
Nominal and average dimensions of the single-lap shear joints.
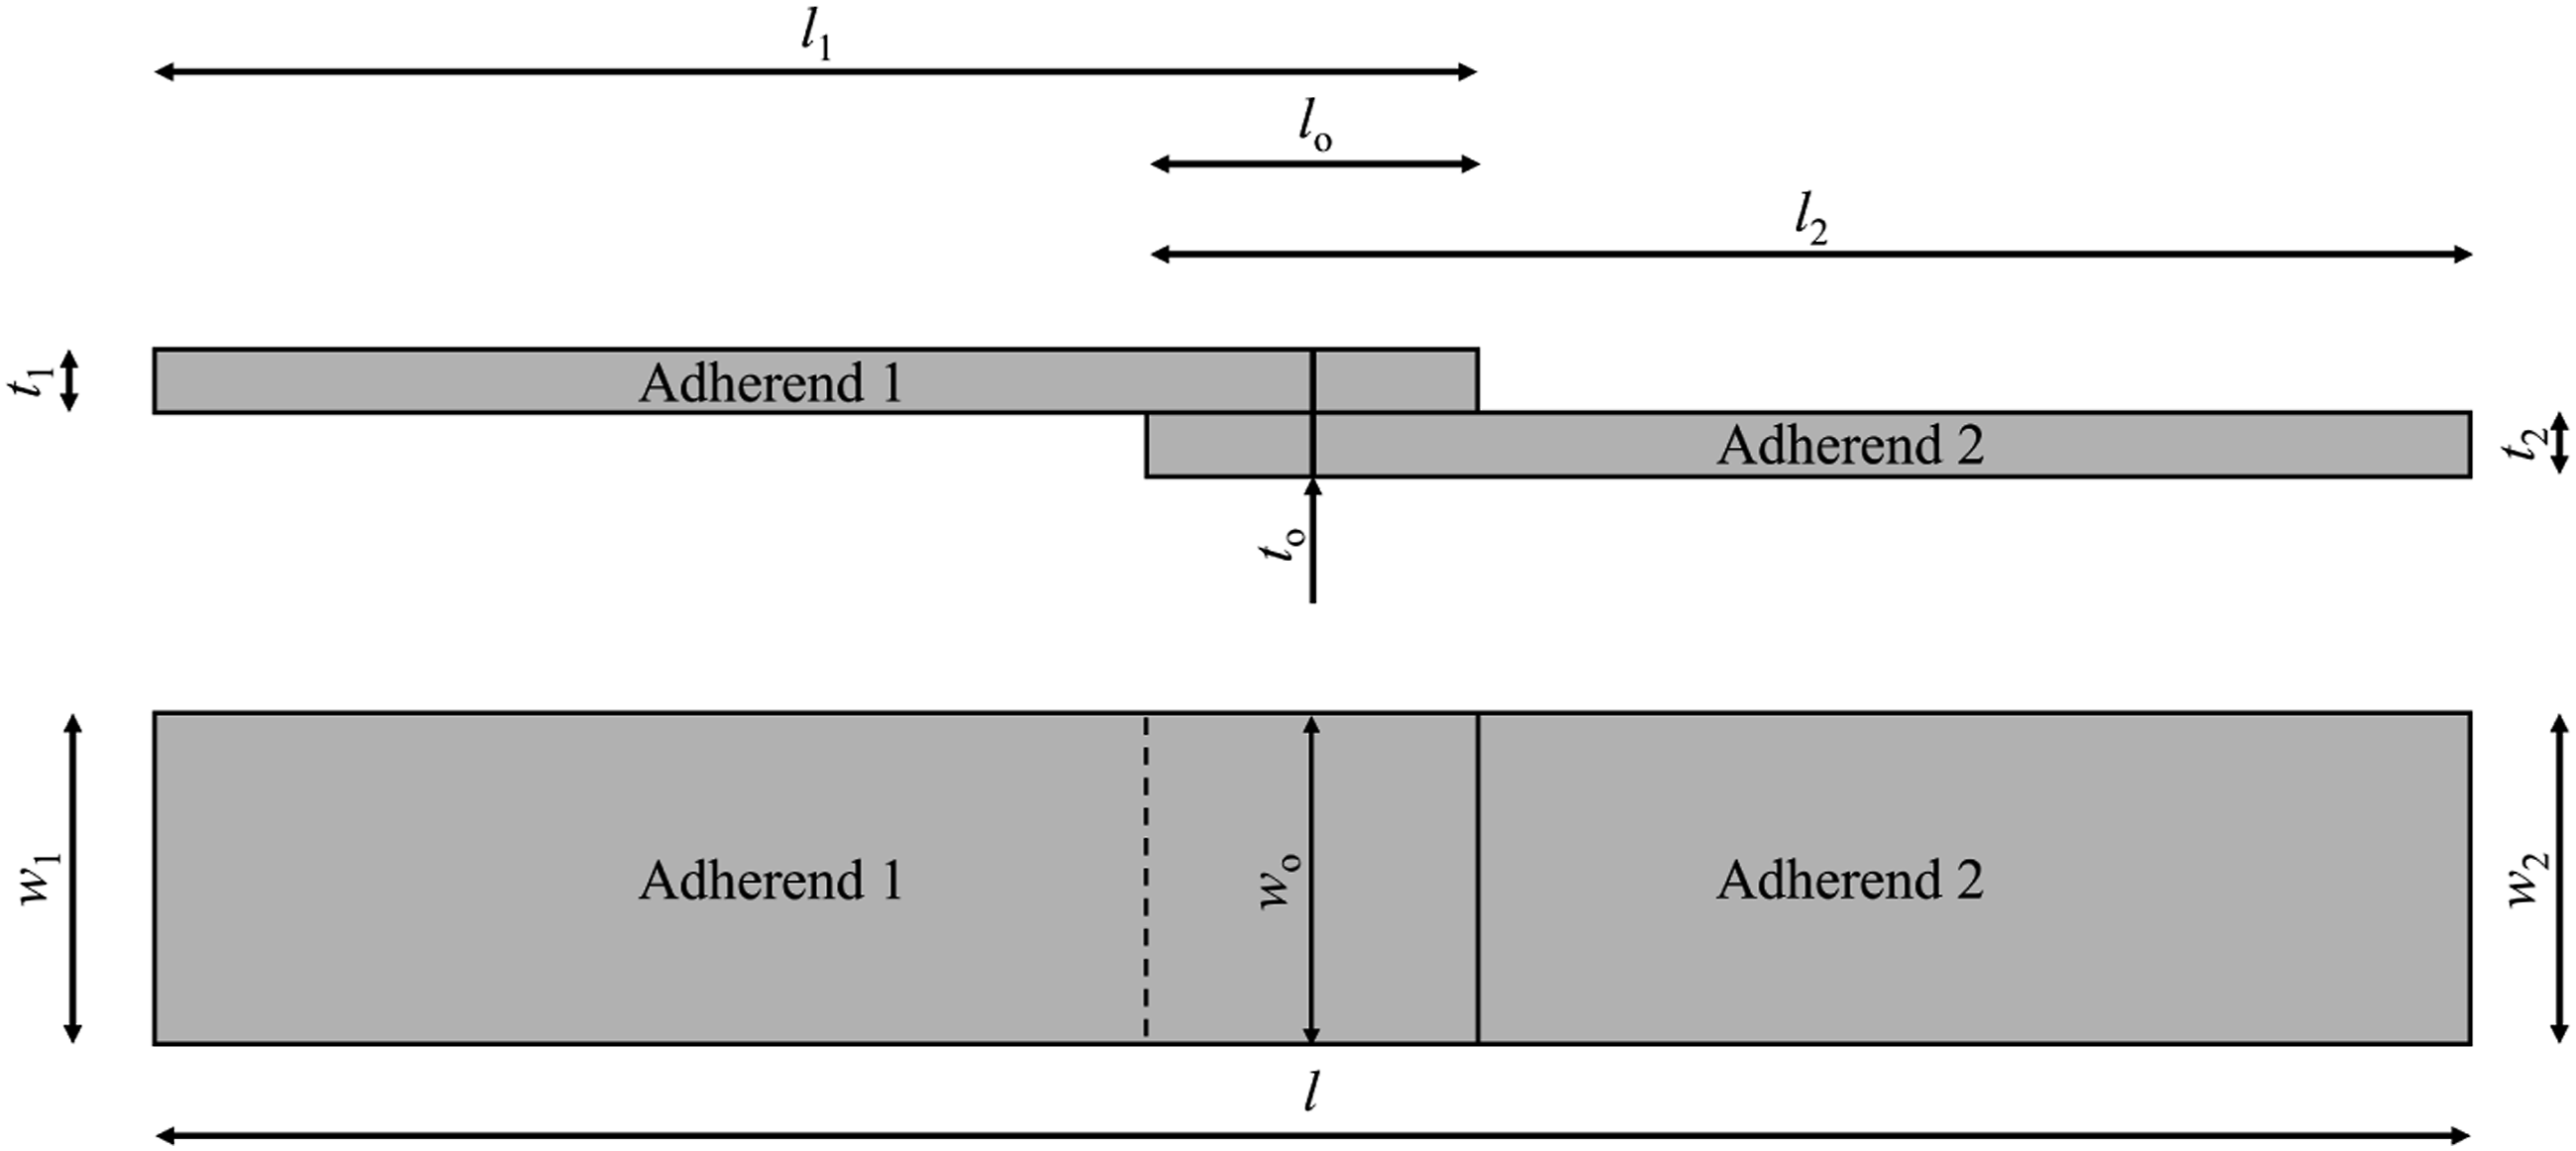
Geometry of the single-lap shear joints.
The specimens are prepared for testing by applying a black and white speckle pattern for digital image correlation (DIC) on their top surfaces. This speckle pattern is also applied on one side of the specimens. On the other side, a scalpel is used to cut vertical lines into the paint along the length of the overlap. The cuts are spaced one mm apart and provide a reference for crack growth measurements. An overview of the prepared specimens is given in Figure 4. Five of the 13 recycled core T700/LM-PAEK specimens are presented. Overview of (a) virgin T300/PPS (type A), (b) recycled core T300/PPS (type B), (c) virgin T700/LM-PAEK (type C), and (d) some recycled core T700/LM-PAEK (type D) specimens.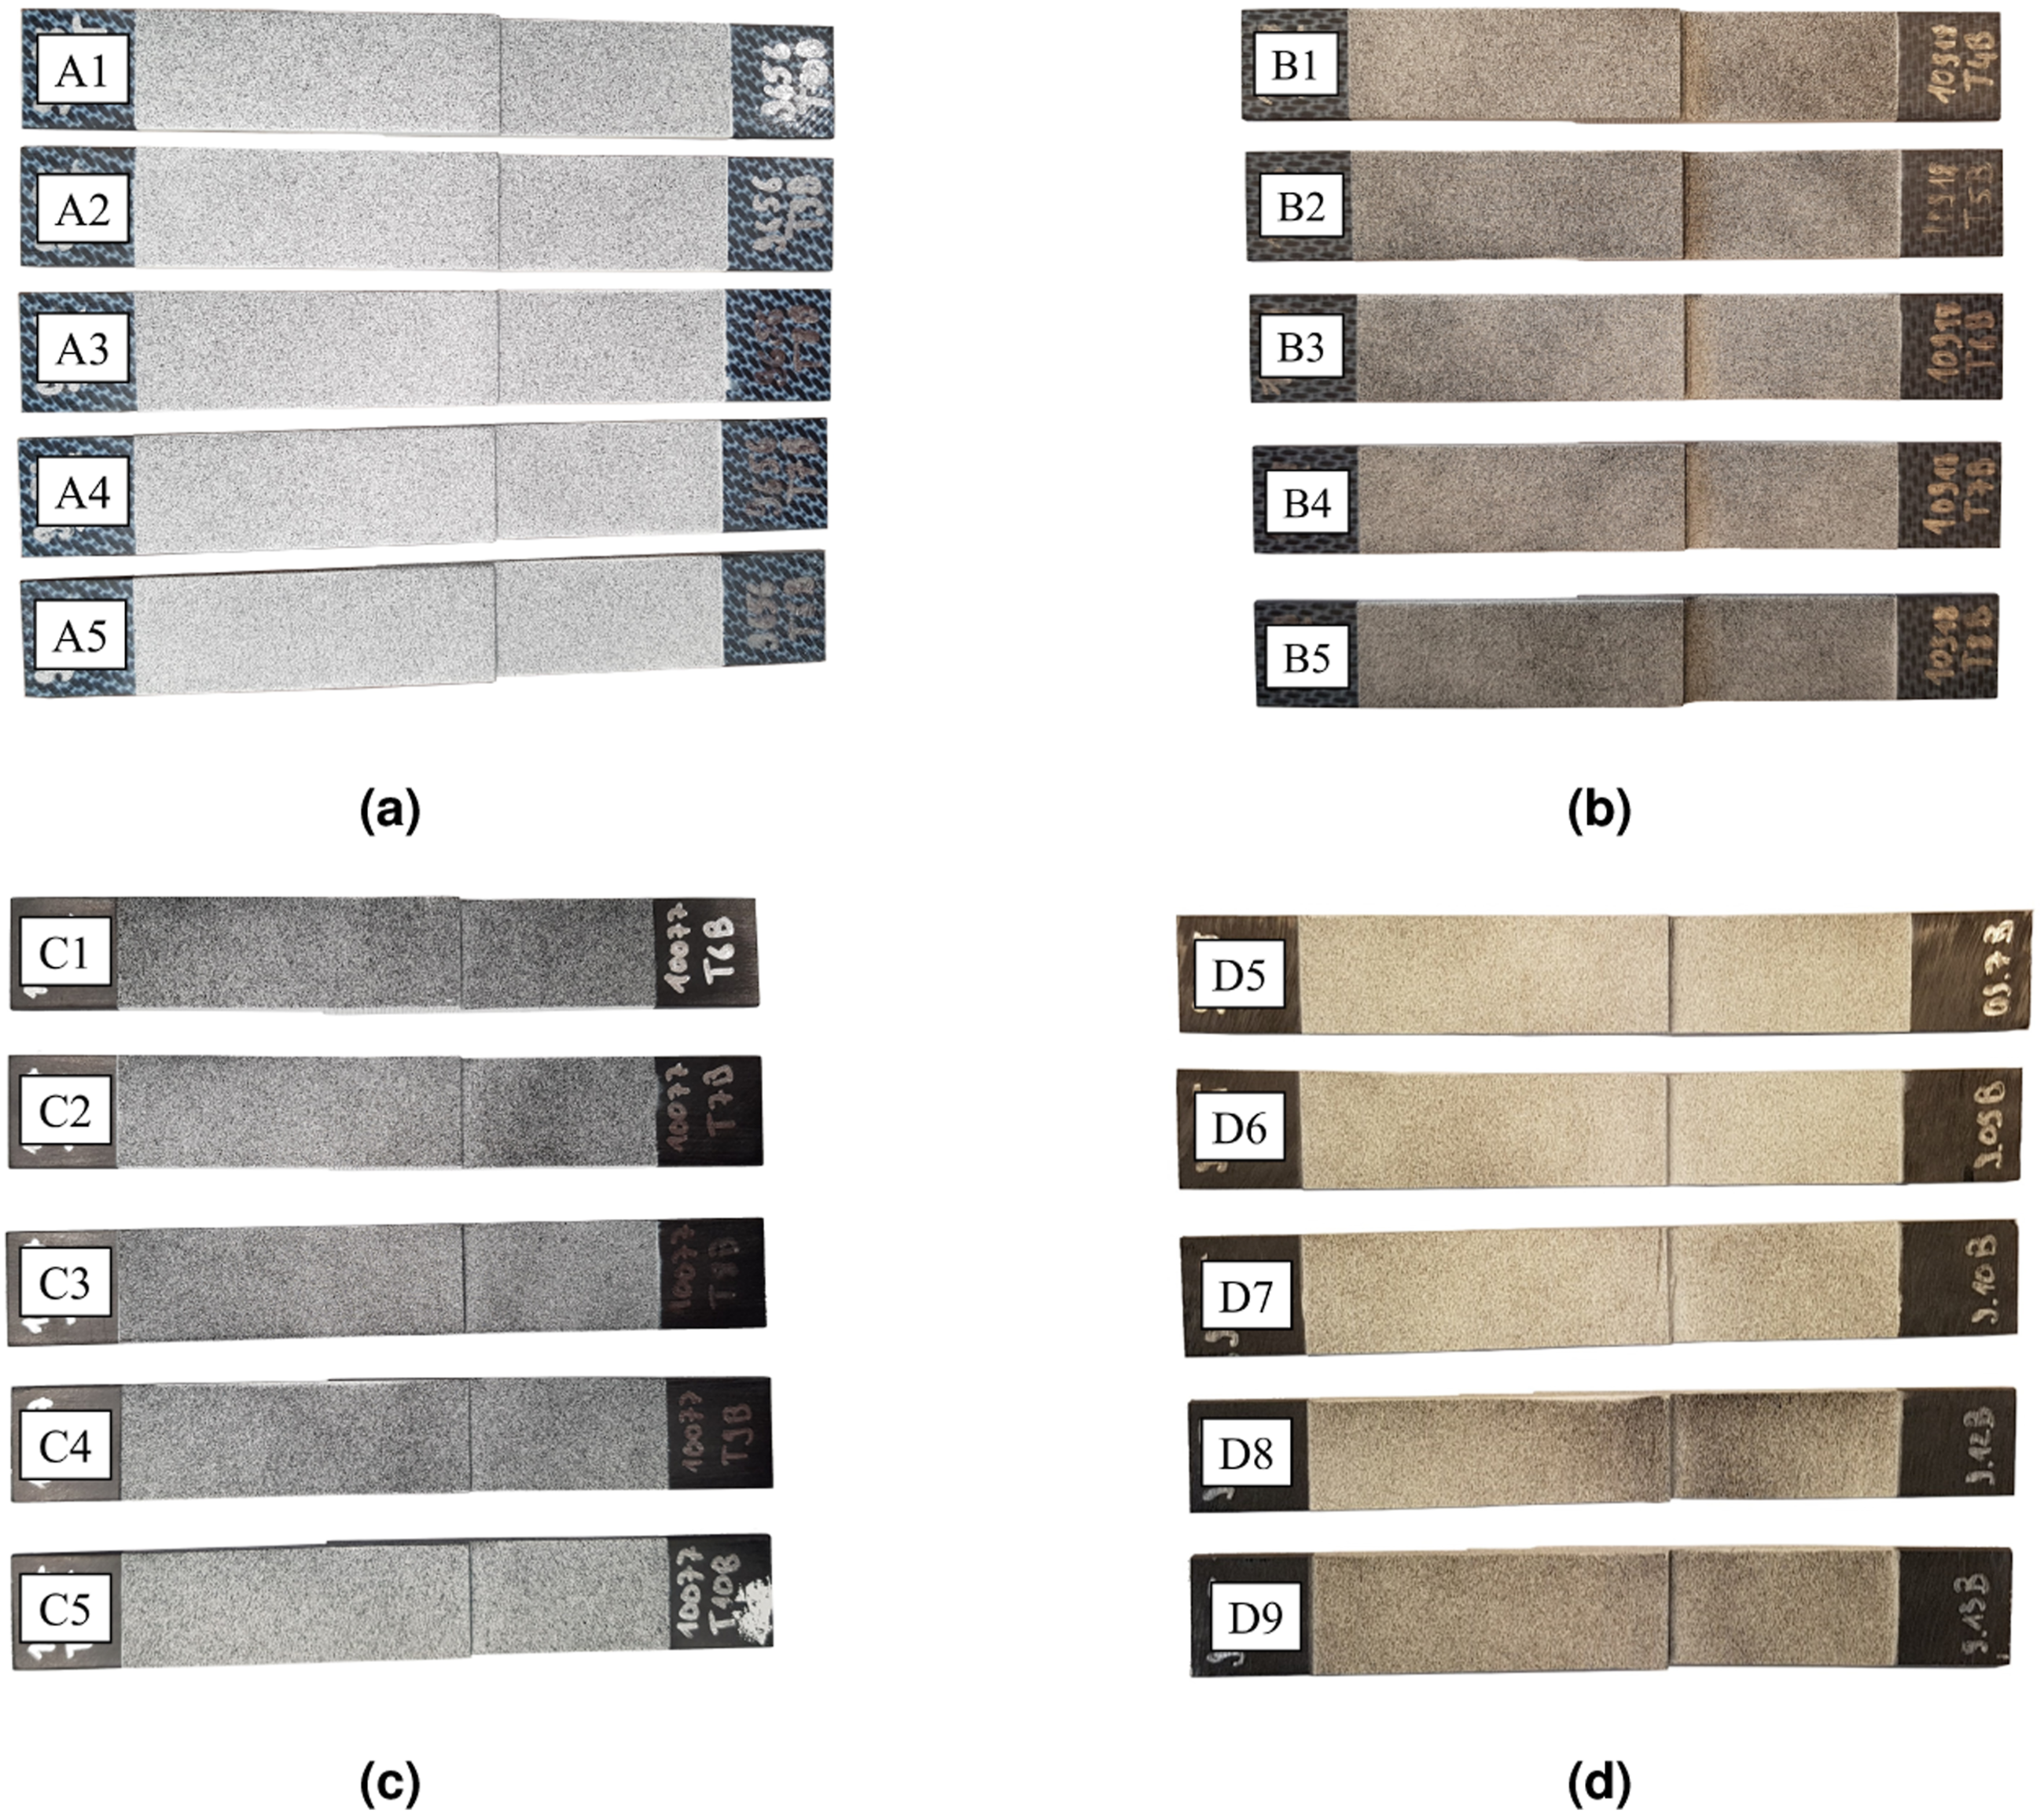
Figure 5 shows typical side views of the four different joint types. While the virgin T300/PPS specimens (type A) in Figure 5(a) resemble the ideal rectangular joint geometry depicted in Figure 3, deviations are observed for the other three types. The reyclced core T300/PPS specimens (type B) in Figure 5(b) are indented on the bottom of adherend 2. In addition, a fillet at the right overlap end is present. Both conduction welded T700/LM-PAEK joints (types C and D) are visibly bent which is attributed to thermal stresses introduced during the manufacturing process. The bulge at the left overlap end forms during welding when a hot metal stamp is pressed into the adherends. The polymer flows out of the overlap region and reconsolidates in a less constrained position. For the recycled core T700/LM-PAEK specimens in Figure 5(d), the bulge is smaller because there are fewer virgin plies, but it is accompanied by a second fiber-polymer layer that consists of the recycled material. Side view of (a) virgin T300/PPS (type A), (b) recycled core T300/PPS (type B), (c) virgin T700/LM-PAEK (type C), and (d) recycled core T700/LM-PAEK (type D) specimens with slightly varying magnification factors.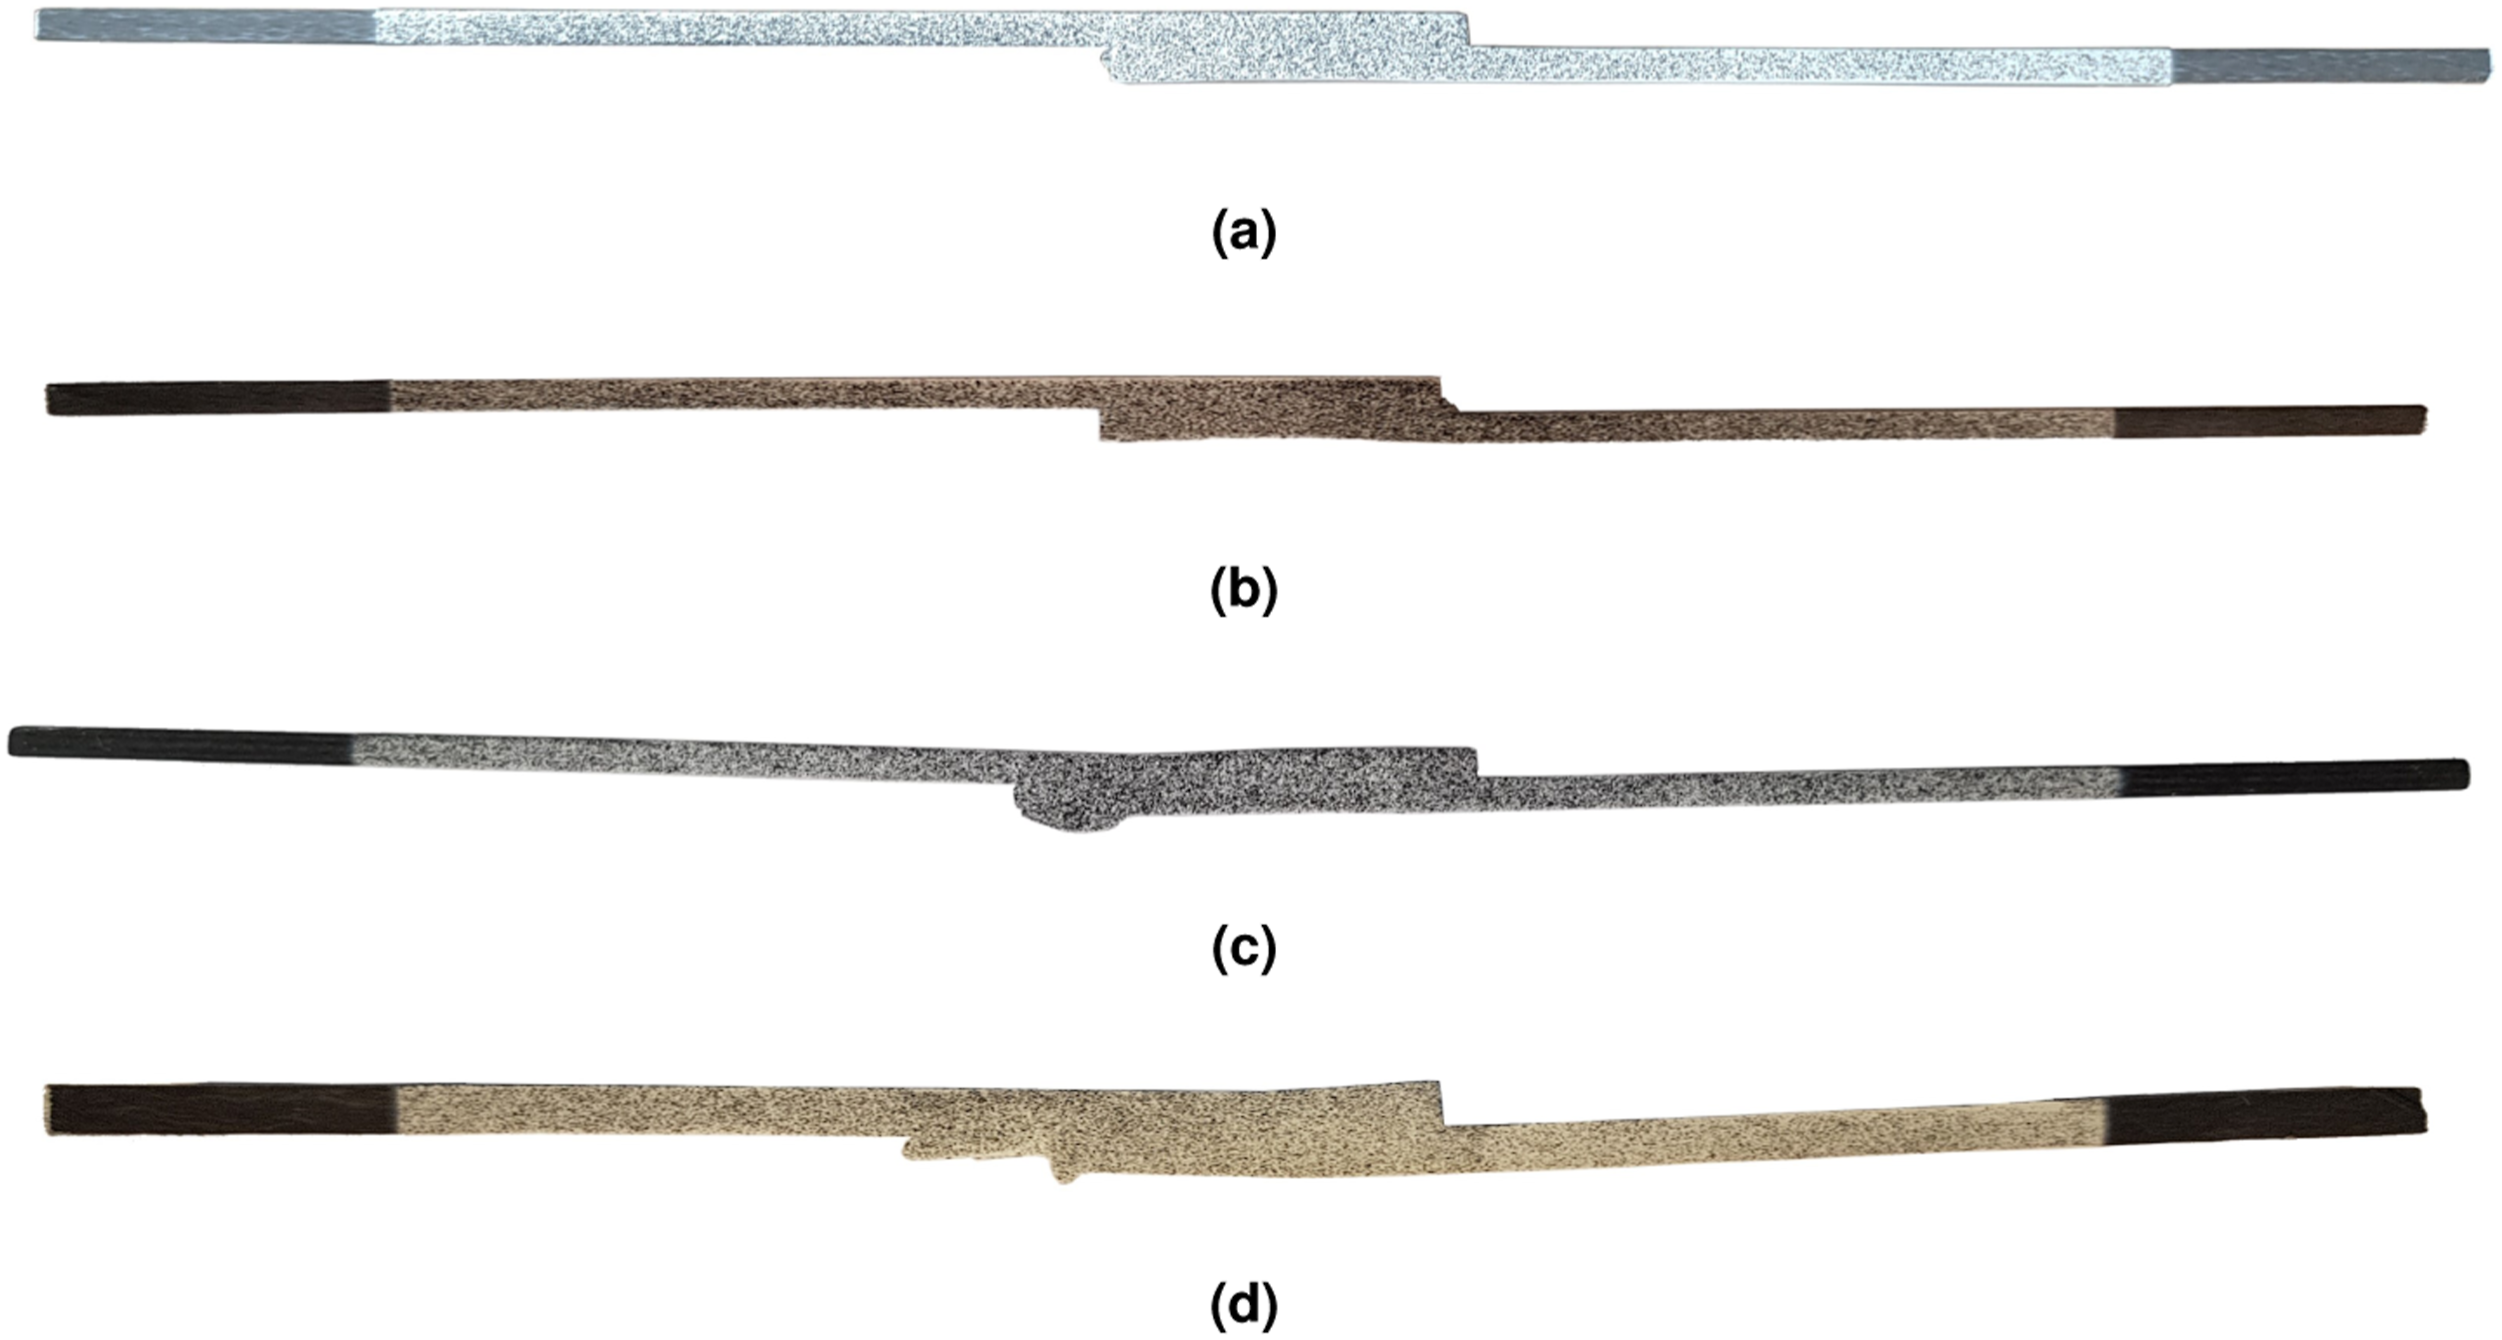
The single-lap shear experiments are conducted on a ZwickRoell Universal Test Machine with adjustable grips. The test setup is shown in Figure 6. The test bench measures force with a 250 kN load cell and displacement with a linear variable differential transformer (LVDT). Load is applied in displacement control at a speed of 0.2 mm/min for specimen type A (induction welded virgin T300/PPS joints). The loading speed is reduced to 0.1 mm/min for all subsequent experiments (types B, C, and D). Since dynamic effects only become relevant at much higher loading speeds (>13 mm/min), this does not influence the test results. Single-lap shear test setup: (a) front view and (b) rear view.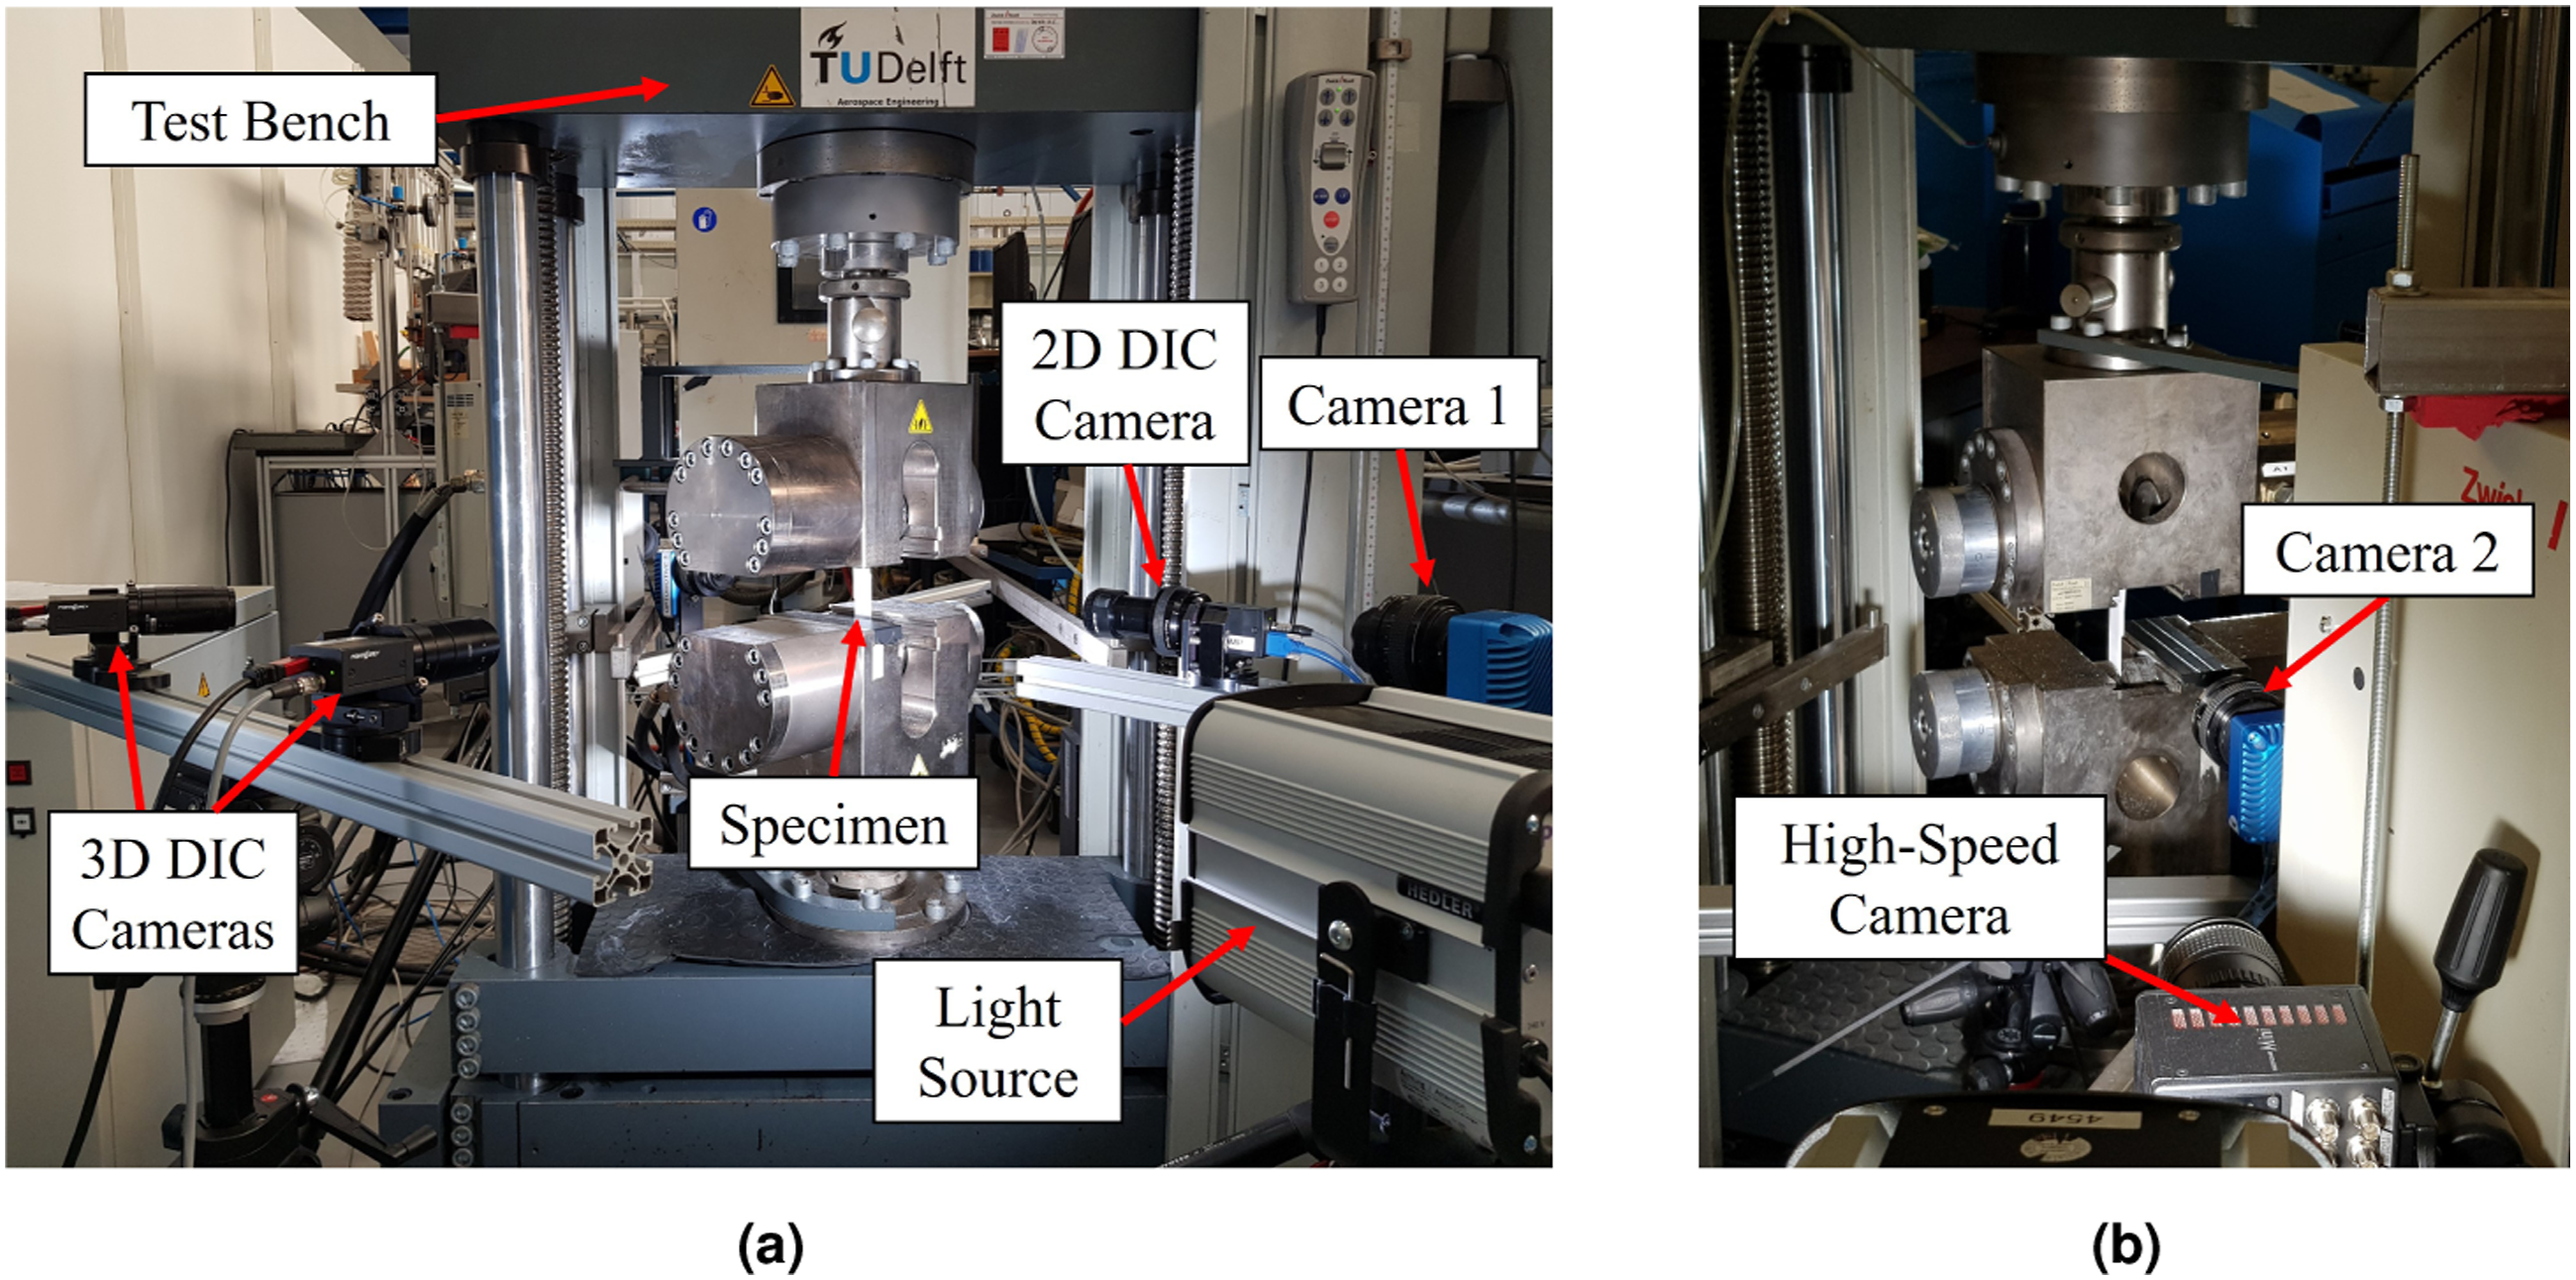
Two 3D DIC cameras are pointed at the frontal specimen surface to measure in-plane and out-of-plane deformations. A single 2D DIC camera tracks the in-plane deformations in the overlap region on one side of the specimen. Camera 1 captures isometric images of the experiments. On the side opposite of the 2D DIC camera, Camera 2 takes pictures of the crack growth within the overlap region. All cameras operate at a frequency of 1 Hz. In addition, a high-speed camera records the last 3 seconds of every test with a resolution of 50,000 frames per second in order to record specimen failure.
The test bench starts recording the load-displacement data when a preload of 50 N is reached which means that a force of 0 N does not correspond to a displacement of 0 mm. Therefore, a linear least squares regression analysis is run to determine the initial joint stiffness. This value is then converted to a displacement offset that is added to all displacement data points so that the corrected load-displacement data assigns zero force to zero displacement. Only the corrected load-displacement data is presented here.
The DIC images are post-processed in Vic-2D 6 and Vic-3D 8. 24 to determine the displacement and strain fields on the side and front of the specimens. Since displacement discontinuities (cracks) lead to high local displacement gradients (strains), the strain field information can be used to visualize the damage growth in the overlap region of the joints. After the tests, images of the fracture surfaces are taken with a Keyence 5000 VR digital microscope.
Structural Response of the Tested Single-Lap Shear Joints
Average maximum load Fmax, average lap shear strength τmax, and average initial joint stiffness kinit (±standard deviation) for all specimen types.
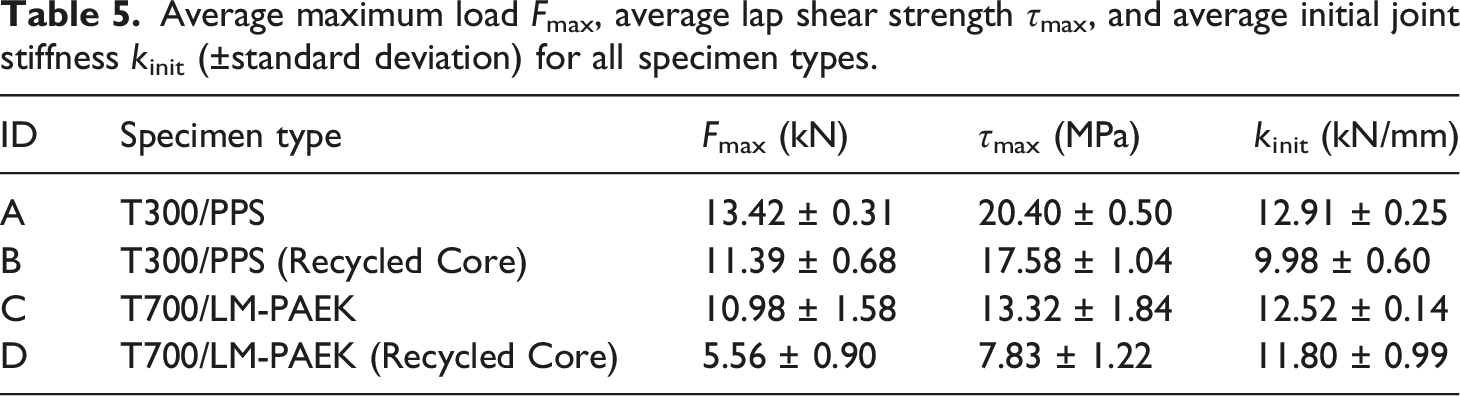
It is evident that the inclusion of recylate material in the adherends impacts the structural performance of the joints compared to the virgin adherends. The average maximum load, average lap shear strength, and average initial joint stiffness of the induction welded fabric T300/PPS specimens decrease by 15.1%, 13.8%, and 22.7% from type A (virgin T300/PPS) to type B (recycled core T300/PSS). The corresponding values for the conduction welded unidirectional T700/LM-PAEK joints show a reduction of 49.4%, 41.2%, and 5.8% from type C (virgin LM-PAEK/T700) to type D (recycled core LM-PAEK/T700). The stiffness of the LM-PAEK/T700 joints drops by only 5.8% because the type D specimens are on average 1.3 mm thicker than the type C joints as reported in Table 4.
Evaluating the test scatter shows that the relative standard deviation of the average joint strength is approximately 2.4 times higher for the recycled core T300/PPS specimens than for their virgin counterparts. The relative stiffness standard deviation increases by a factor of 3.1. For the T700/LM-PAEK joints, the relative strength and relative stiffness standard deviations are 1.1 and 7.5 times higher for type D than for type C.
The reduction of the load-carrying capacity of the recycled core specimens is attributed to the mechanical properties of discontinuous fiber-reinforced polymers. First, strength and stiffness decrease because short fibers cannot be loaded to the same level as continuous fiber-reinforced plastics due to their length. Second, neither the distribution, nor the orientation of the recyclate material in the adherends is sufficiently random to create a homogeneous microstructure. Hence, strength and stiffness vary considerably throughout the joint. This scatter in material properties can lead to stress peaks in unfavorable locations which reduces the maximum load the recycled core specimens may sustain and also increases the variance of the test results.
Structural Response of T300/PPS Joints
The load-displacement curves of the induction welded virgin T300/PPS joints (type A) are presented in Figure 7. The structural response of the specimens is typical for single-lap shear joints. Initially, the stiffness of the joint increases as the overlap region aligns itself with the loading axis of the test machine due to secondary bending. Then, the joint stiffness decreases as damage accumulates until the joint fails. The type A joints show a consistent structural response in terms of stiffness and maximum load which is reflected in the small standard deviations in Table 5. Load-displacement curves of virgin T300/PPS joints.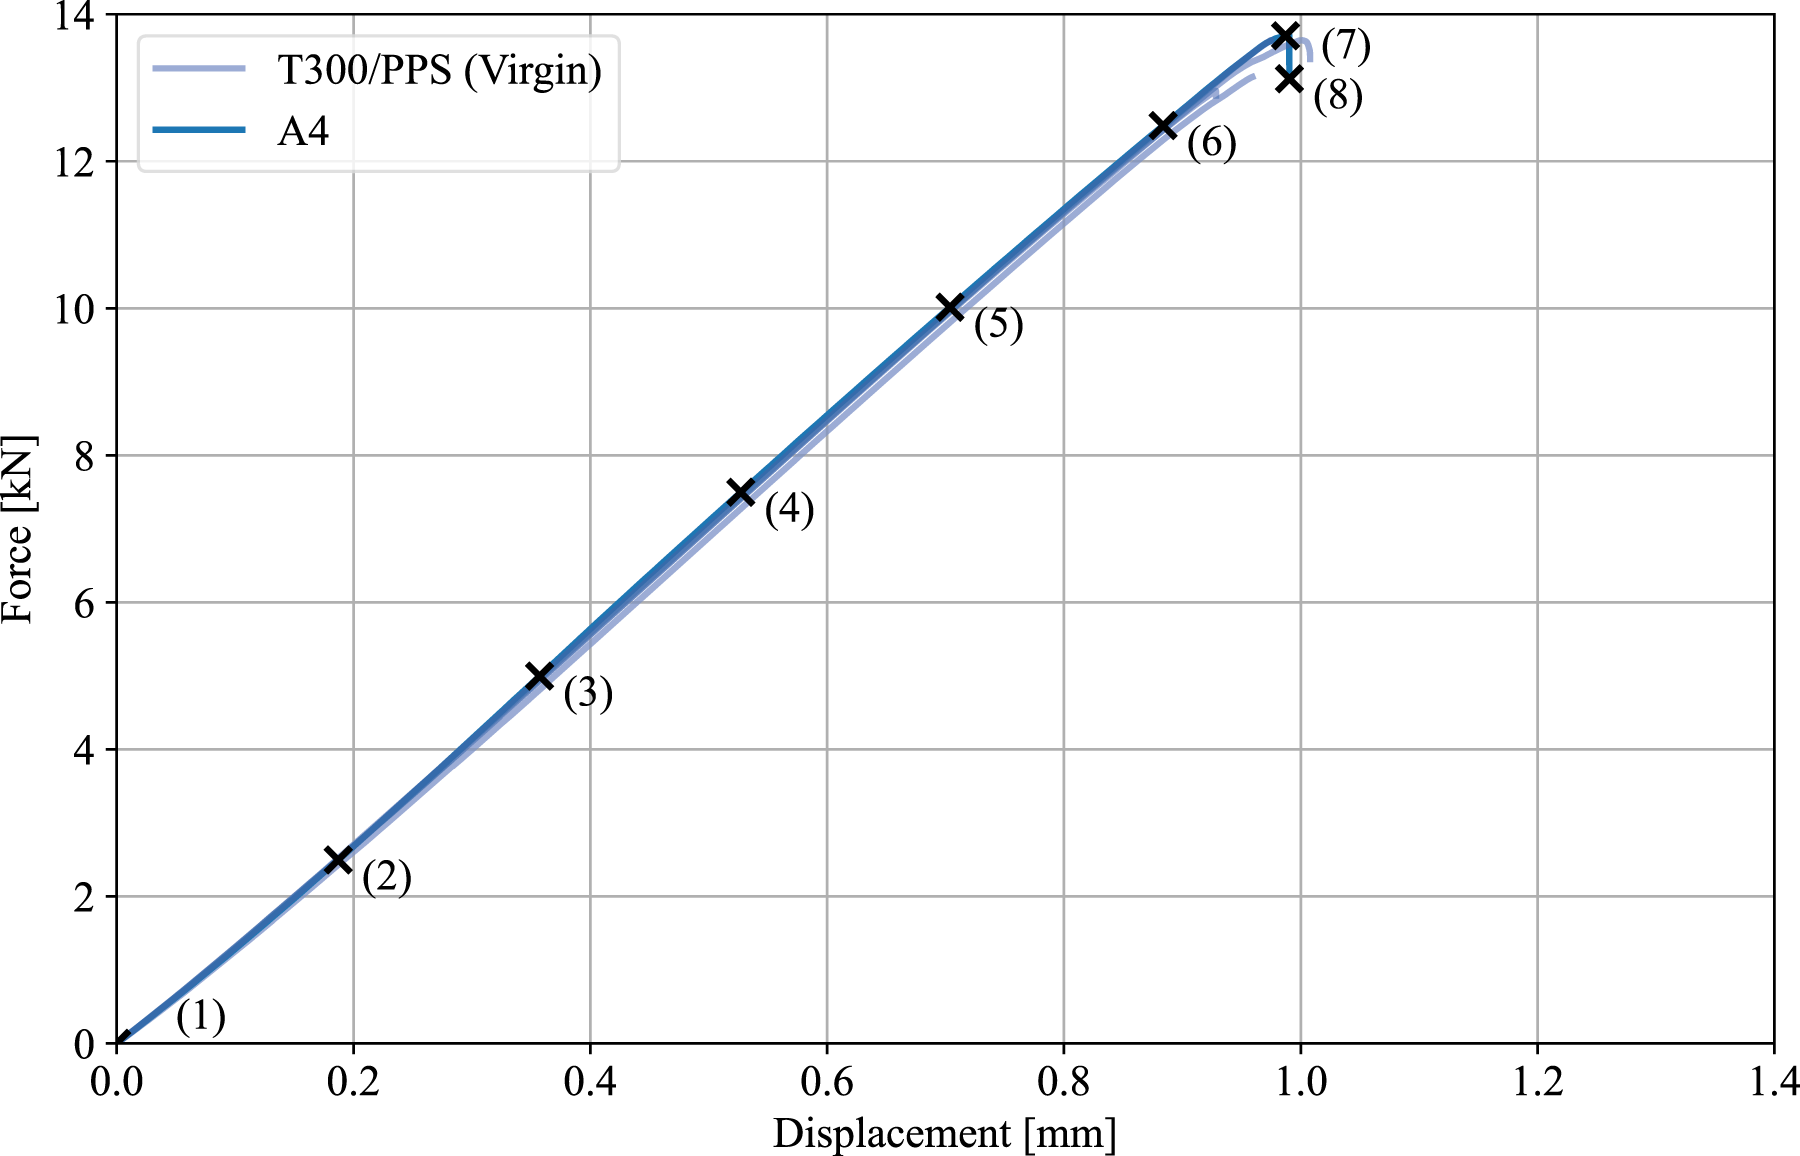
The damage evolution of the type A joints is discussed based on the example of specimen A4 in Figure 8. The images are taken at the points highlighted in the load-displacement curve in Figure 7. The shear strain ɛ
xy
is used to visualize damage in the form of cracks in the overlap region. Material that exhibits a shear strain of 5% is considered cracked. This value is chosen as the rounded average of the strain measurements at the crack tips in the last DIC images before failure. As such, the 5% strain threshold value is empirical. However, Kralovec et al.
25
show that DIC-based crack length measurements can be largely independent of the exact damage threshold value. For the present dataset it is verified that changing the strain threshold value for damage by 1%pt. in either direction has a negligible influence on the crack length measurements. Therefore, the choice of the 5% strain threshold value for damage detection is robust. Damage in the overlap region of the virgin T300/PPS specimen A4 visualized with 2D DIC using the shear strain ɛ
xy
.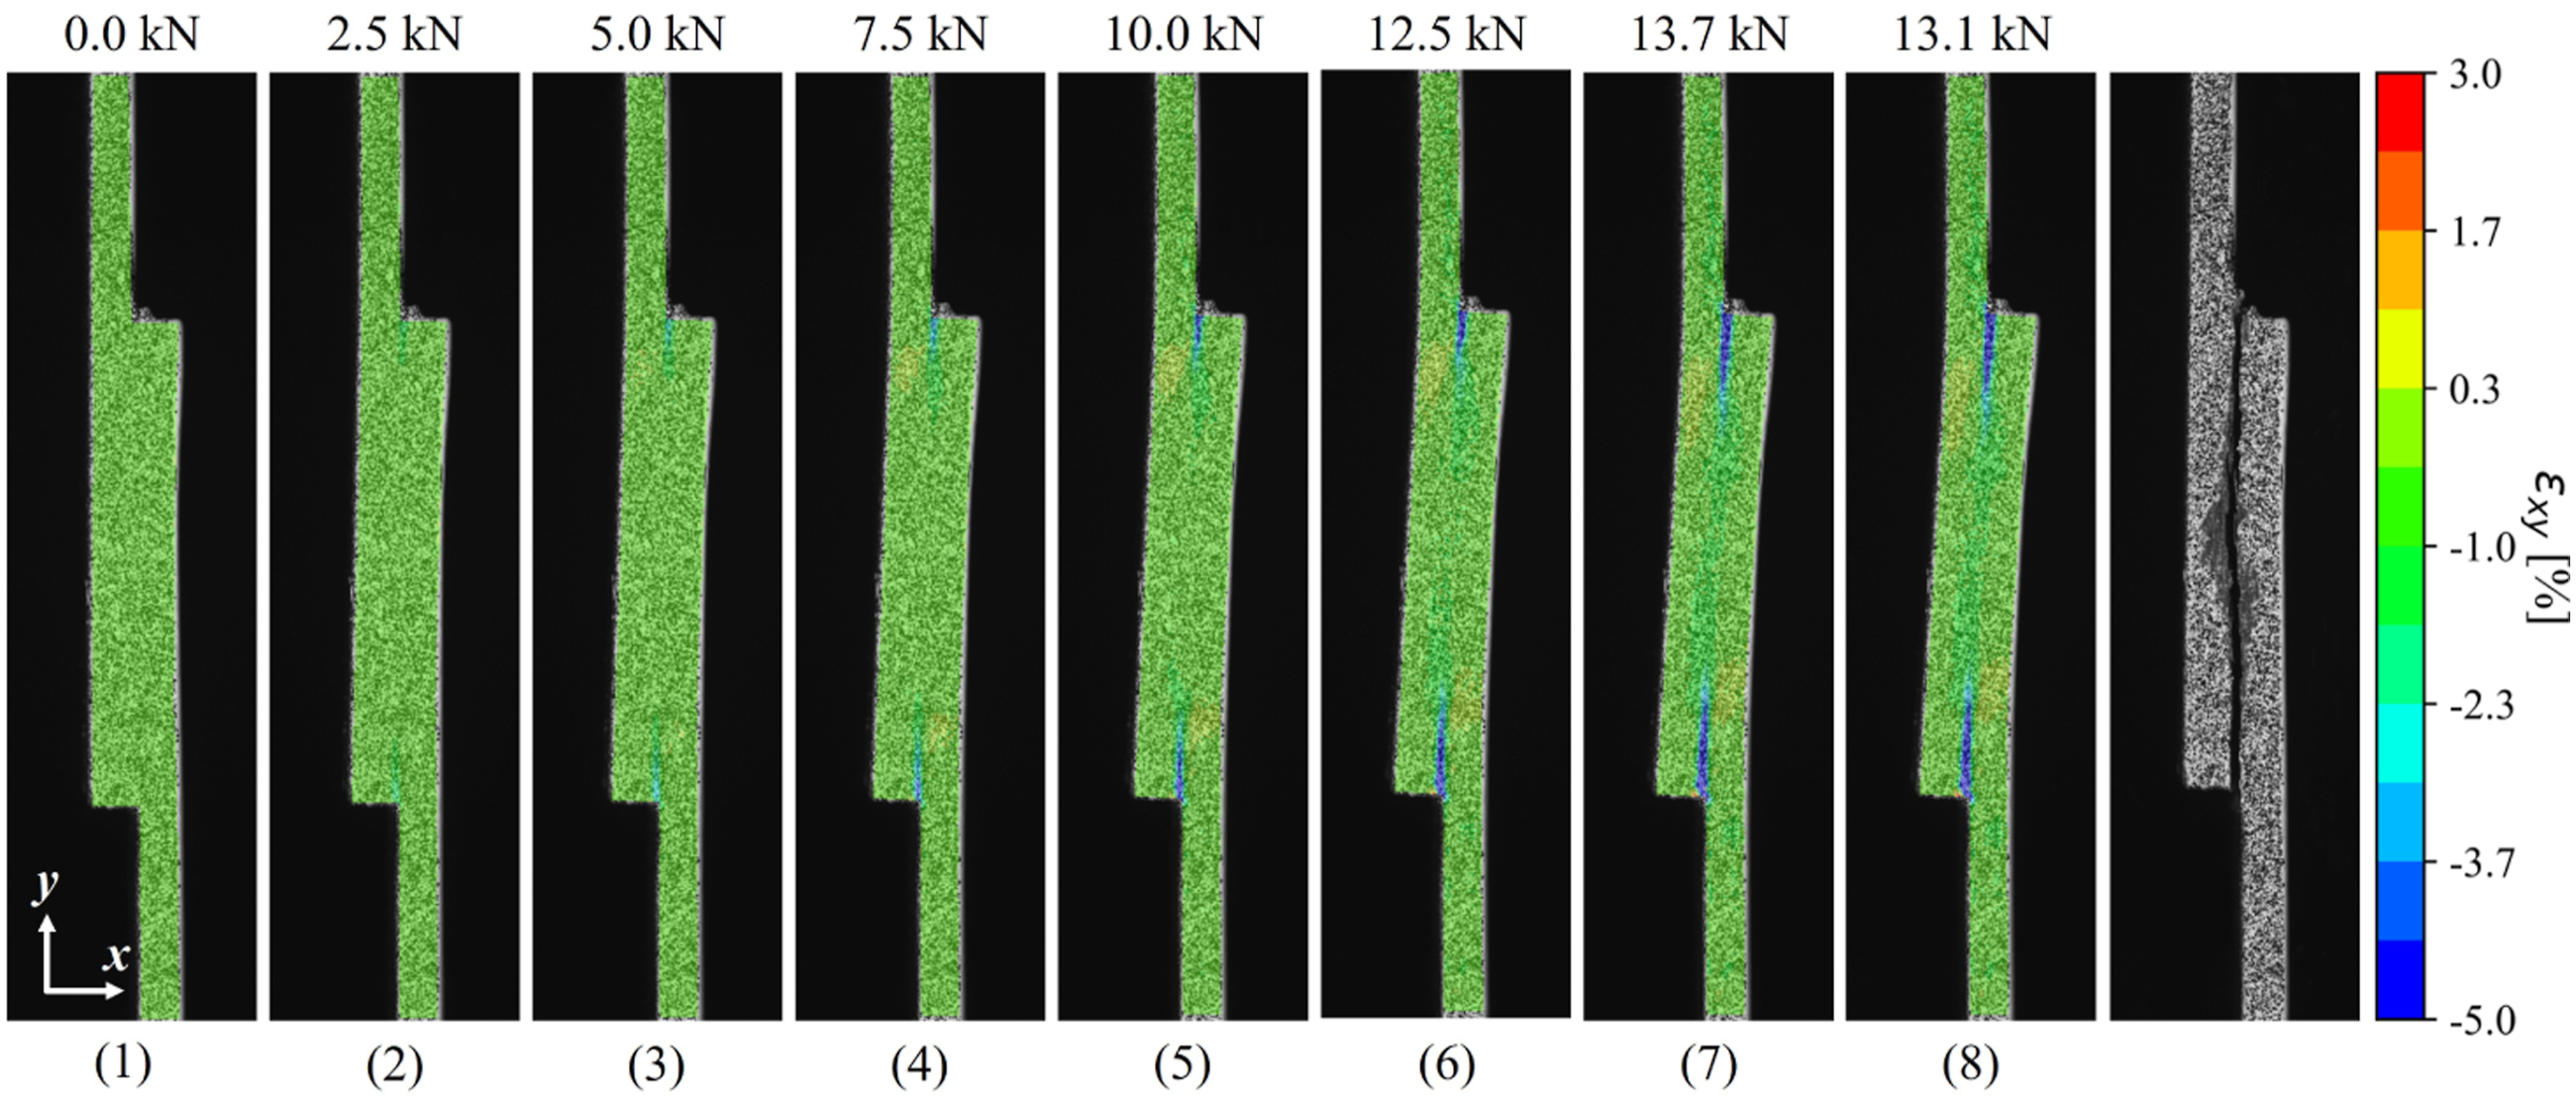
At the beginning of the test, the specimen is at point (1). Between points (1), (2), and (3), the stiffening effect of secondary bending in the slope of the load-displacement curve is observed. Small strain concentrations are visible at both overlap ends at point (2) which imply damage at a reaction force as low as 2.5 kN. The intensity of the strain concentrations increases through point (3) as the specimen is loaded further. The cracks propagate along the welded interface from point (4) to points (5) and (6) towards the center of the joint. This damage pattern is also typical for adhesively bonded single-lap shear joints. The strain concentration at the bottom overlap end extends further than at the top which indicates a longer crack length at the bottom. Crack growth is slow and stable as small load increments result in short crack extensions. The maximum load of the joint is reached at point (7). One second later, the picture at point (8) is taken which shows significant crack propagation along the welded interface compared to the image at point (7). Immediately afterwards, the joint fails. Hence, crack growth after the maximum load is unstable, but damage remains restricted to the welded interface.
The load-displacement curves for the recycled core T300/PPS joints (type B) are plotted in Figure 9. Compared to type A specimens, type B specimens feature curves that are less linear, especially at higher load levels where damage accumulation leads to a reduction of the joint stiffness. The influence of the recyclate material on the overall joint stiffness and maximum load is observed when comparing the load-displacement curves for the two specimen types. It can also be seen that the stiffness of the type B joints follows the order B2 > B1 > B3 > B4 > B5. Since the naming scheme of the specimens corresponds to their position during welding, a systemic influence of the manufacturing process on the test results is likely. This can partly explain the increase of the relative standard variation for the initial joint stiffness between type A and type B joints. Load-displacement curves of recycled core T300/PPS joints.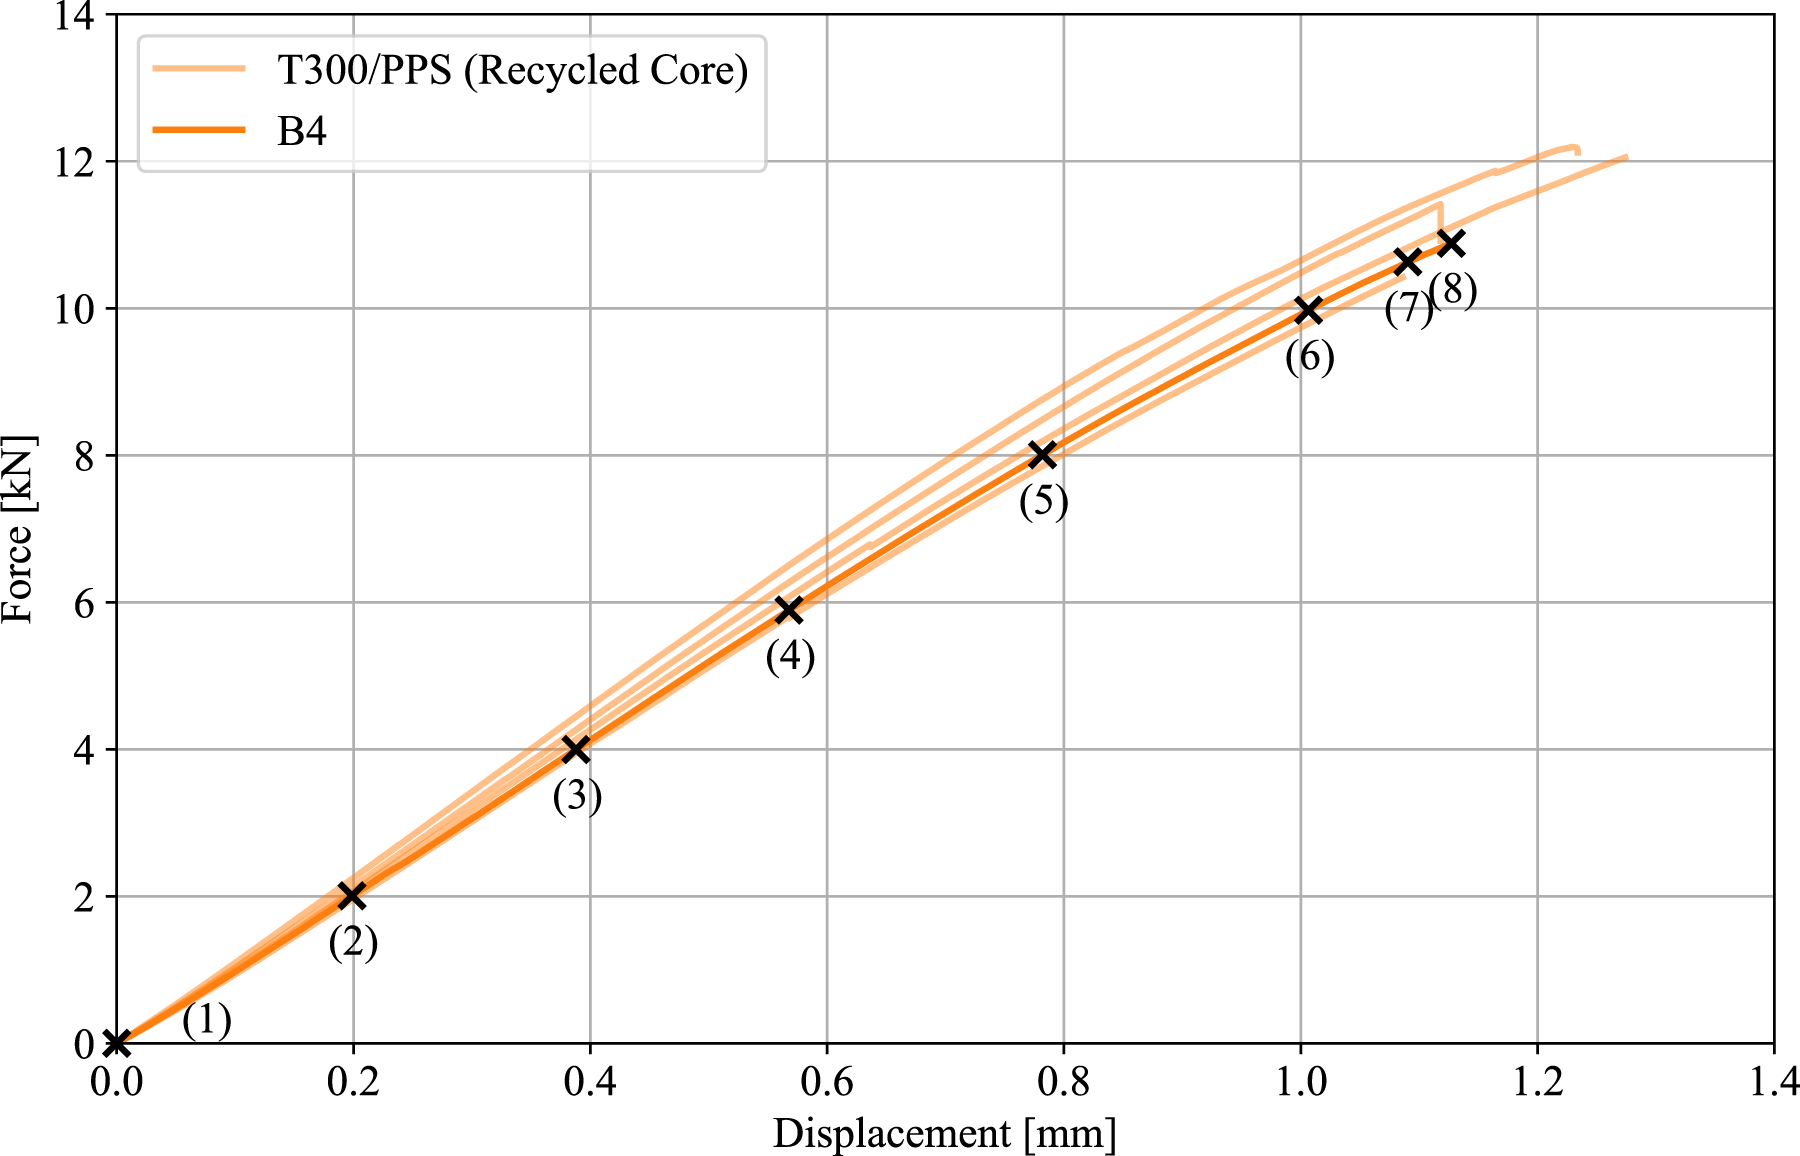
Specimen B4 is taken as an example to discuss the damage evolution of the type B joints. 2D DIC imnages using the shear strain ɛ
xy
and photos taken during the tests are shown in Figure 10. The DIC and the crack growth images are taken on opposite sides of the overlap region and at the points marked on the load-displacement curve in Figure 9. Damage in the overlap region of the recycled core T300/PPS specimen B4 visualized with (a) 2D DIC using the shear strain ɛ
xy
and with (b) crack growth images.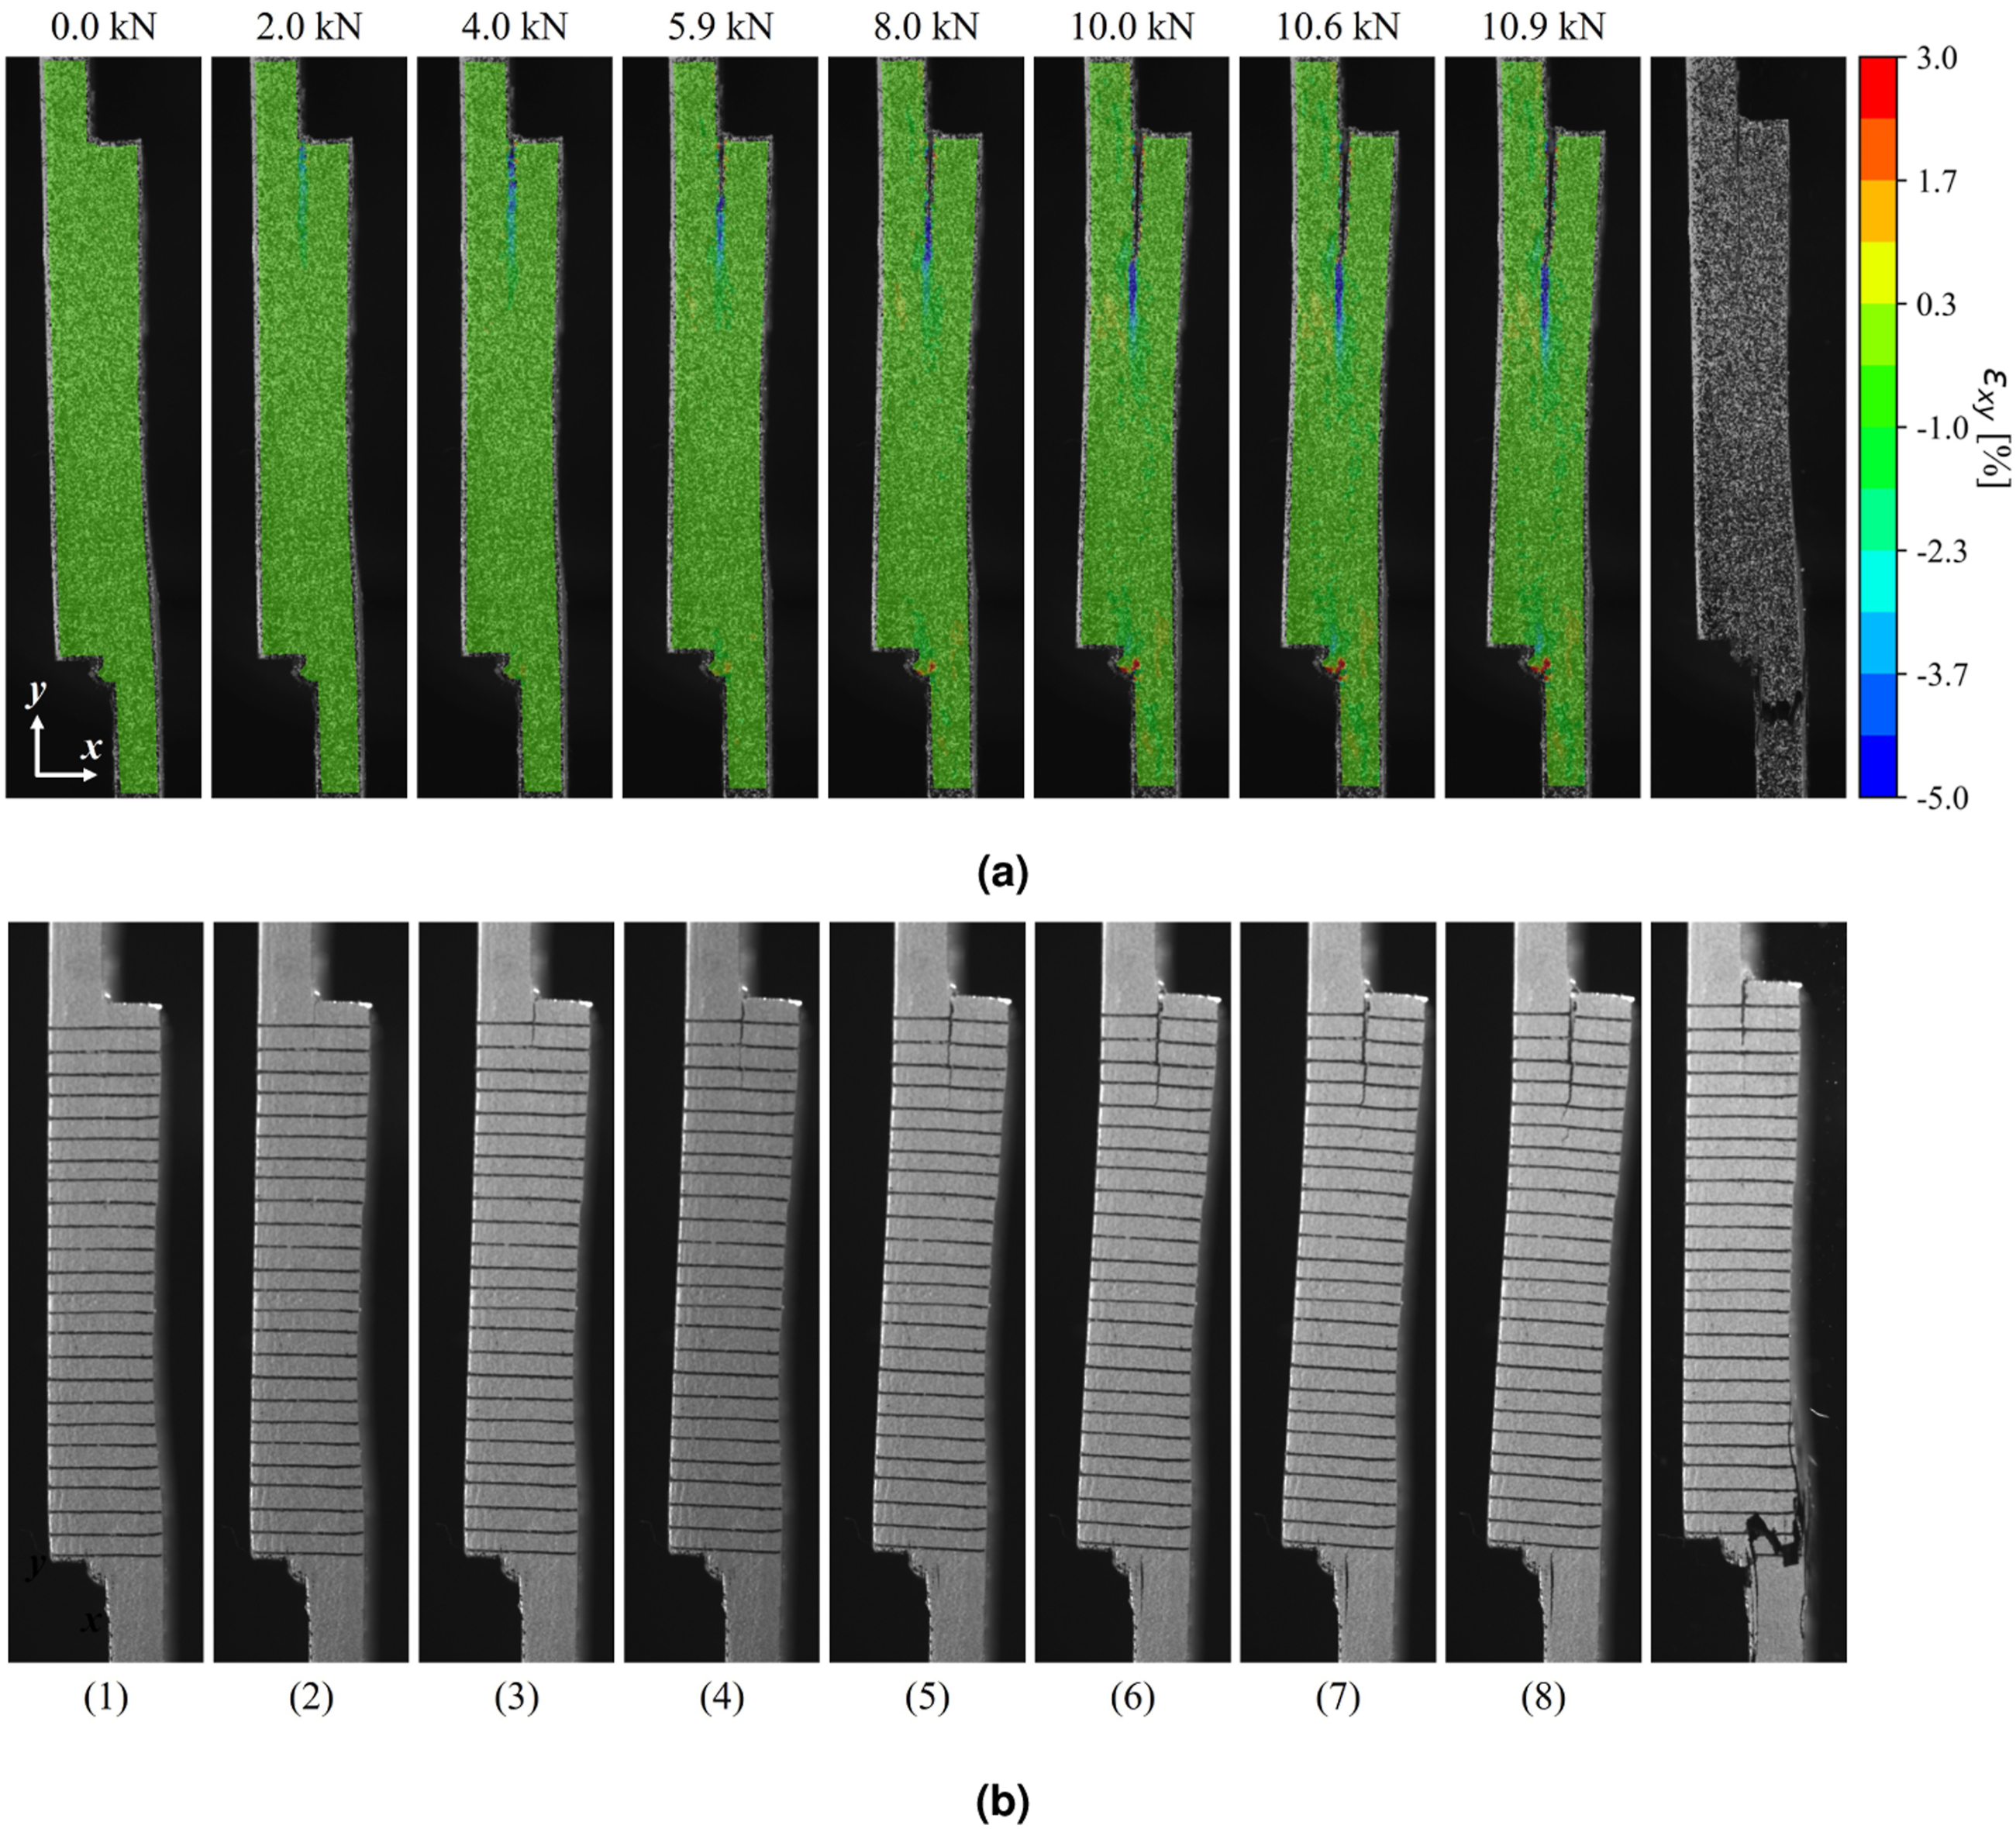
No load is applied to specimen B4 at point (1). A strain concentration at the top overlap end is already visible at point (2) for a load of 2 kN. This crack propagates significantly at point (3). A delamination between the virgin outer ply and the recycled core material develops at the bottom overlap end at point (4) and the crack at the top overlap end continues to extend along the welded interface towards the center of the overlap region.
As the joint is loaded through points (5), (6), and (7), the crack at the top overlap end and the delamination at the bottom overlap end propagate. Both the crack and the delamination growth are slow and stable. The DIC images also indicate a crack at the bottom overlap end at point (5) which cannot be seen in the crack growth images. Instead, the crack growth images show the development of a new crack tip ahead of the original crack at the top overlap end at point (6) more clearly. This distinction cannot be made in the DIC images, but the location of the current crack tip is still predicted accurately. Specimen B4 reaches its maximum load at point (8) and fails immediately afterwards. The final failure mode is not fracture along the weld interface like for the type A joints, but rather the migration of the shear crack at the bottom overlap end into the delamination which leads to adherend failure in the bottom adherend.
Structural Response of T700/LM-PAEK Joints
Figure 11 shows the load-displacement curves of the conduction welded virgin T700/LM-PAEK joints (type C). The large scatter in terms of the maximum load is evident. Like for the stiffness of the type B joints, this variation is also correlated to the position of the joints during welding. In particular, the specimens can be sorted in order of decreasing maximum load as C4 > C5 > C3 > C2 > C1. Thus, a portion of the maximum load and shear strength standard variations in Table 5 may be explained with a systemic influence. Load-displacement curves of virgin T700/LM-PAEK joints.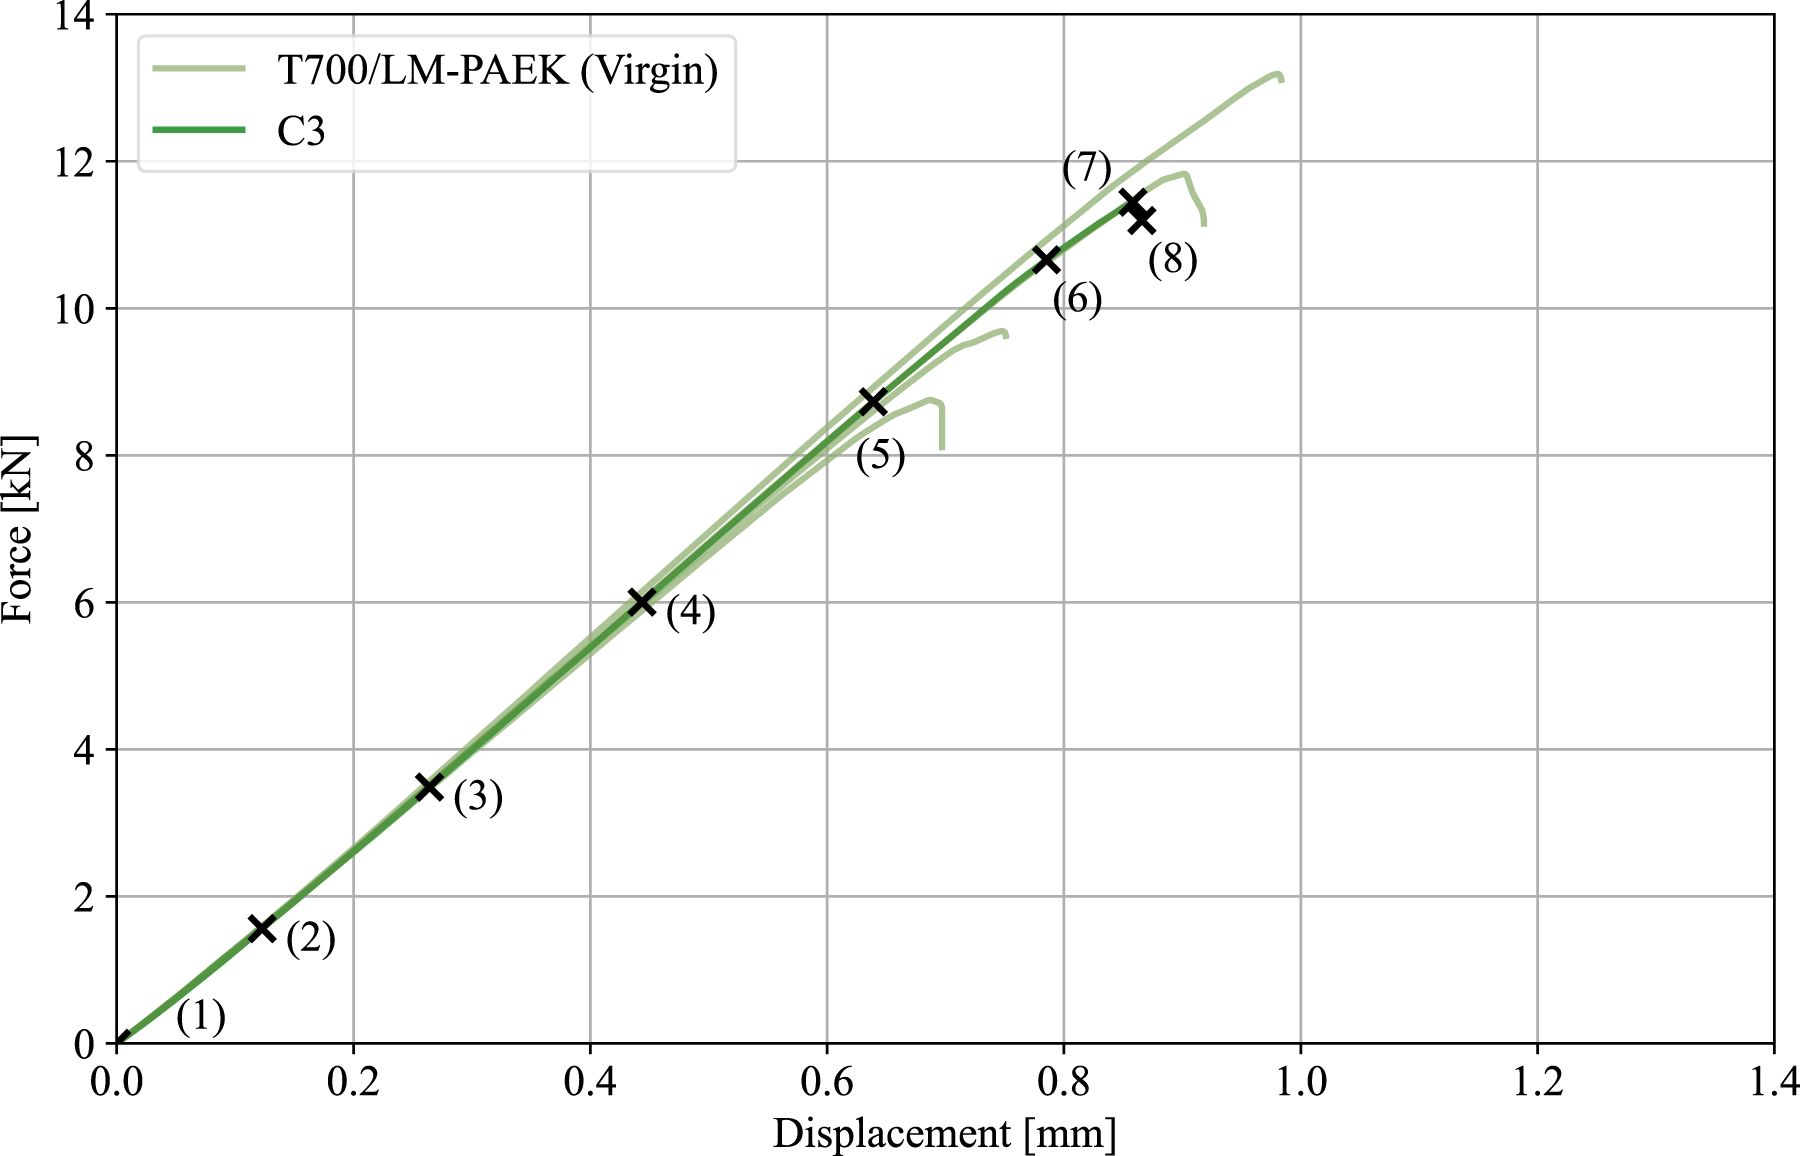
The damage evolution of the type C joints is exemplarily discussed based on specimen C3. The images in Figure 12 correspond to the points highlighted in Figure 11. Overall, damage initiation and propagation are similar to specimen A4. Damage in the overlap region of the virgin T700/LM-PAEK specimen C3 visualized with (a) 2D DIC using the shear strain ɛ
xy
and with (b) crack growth images.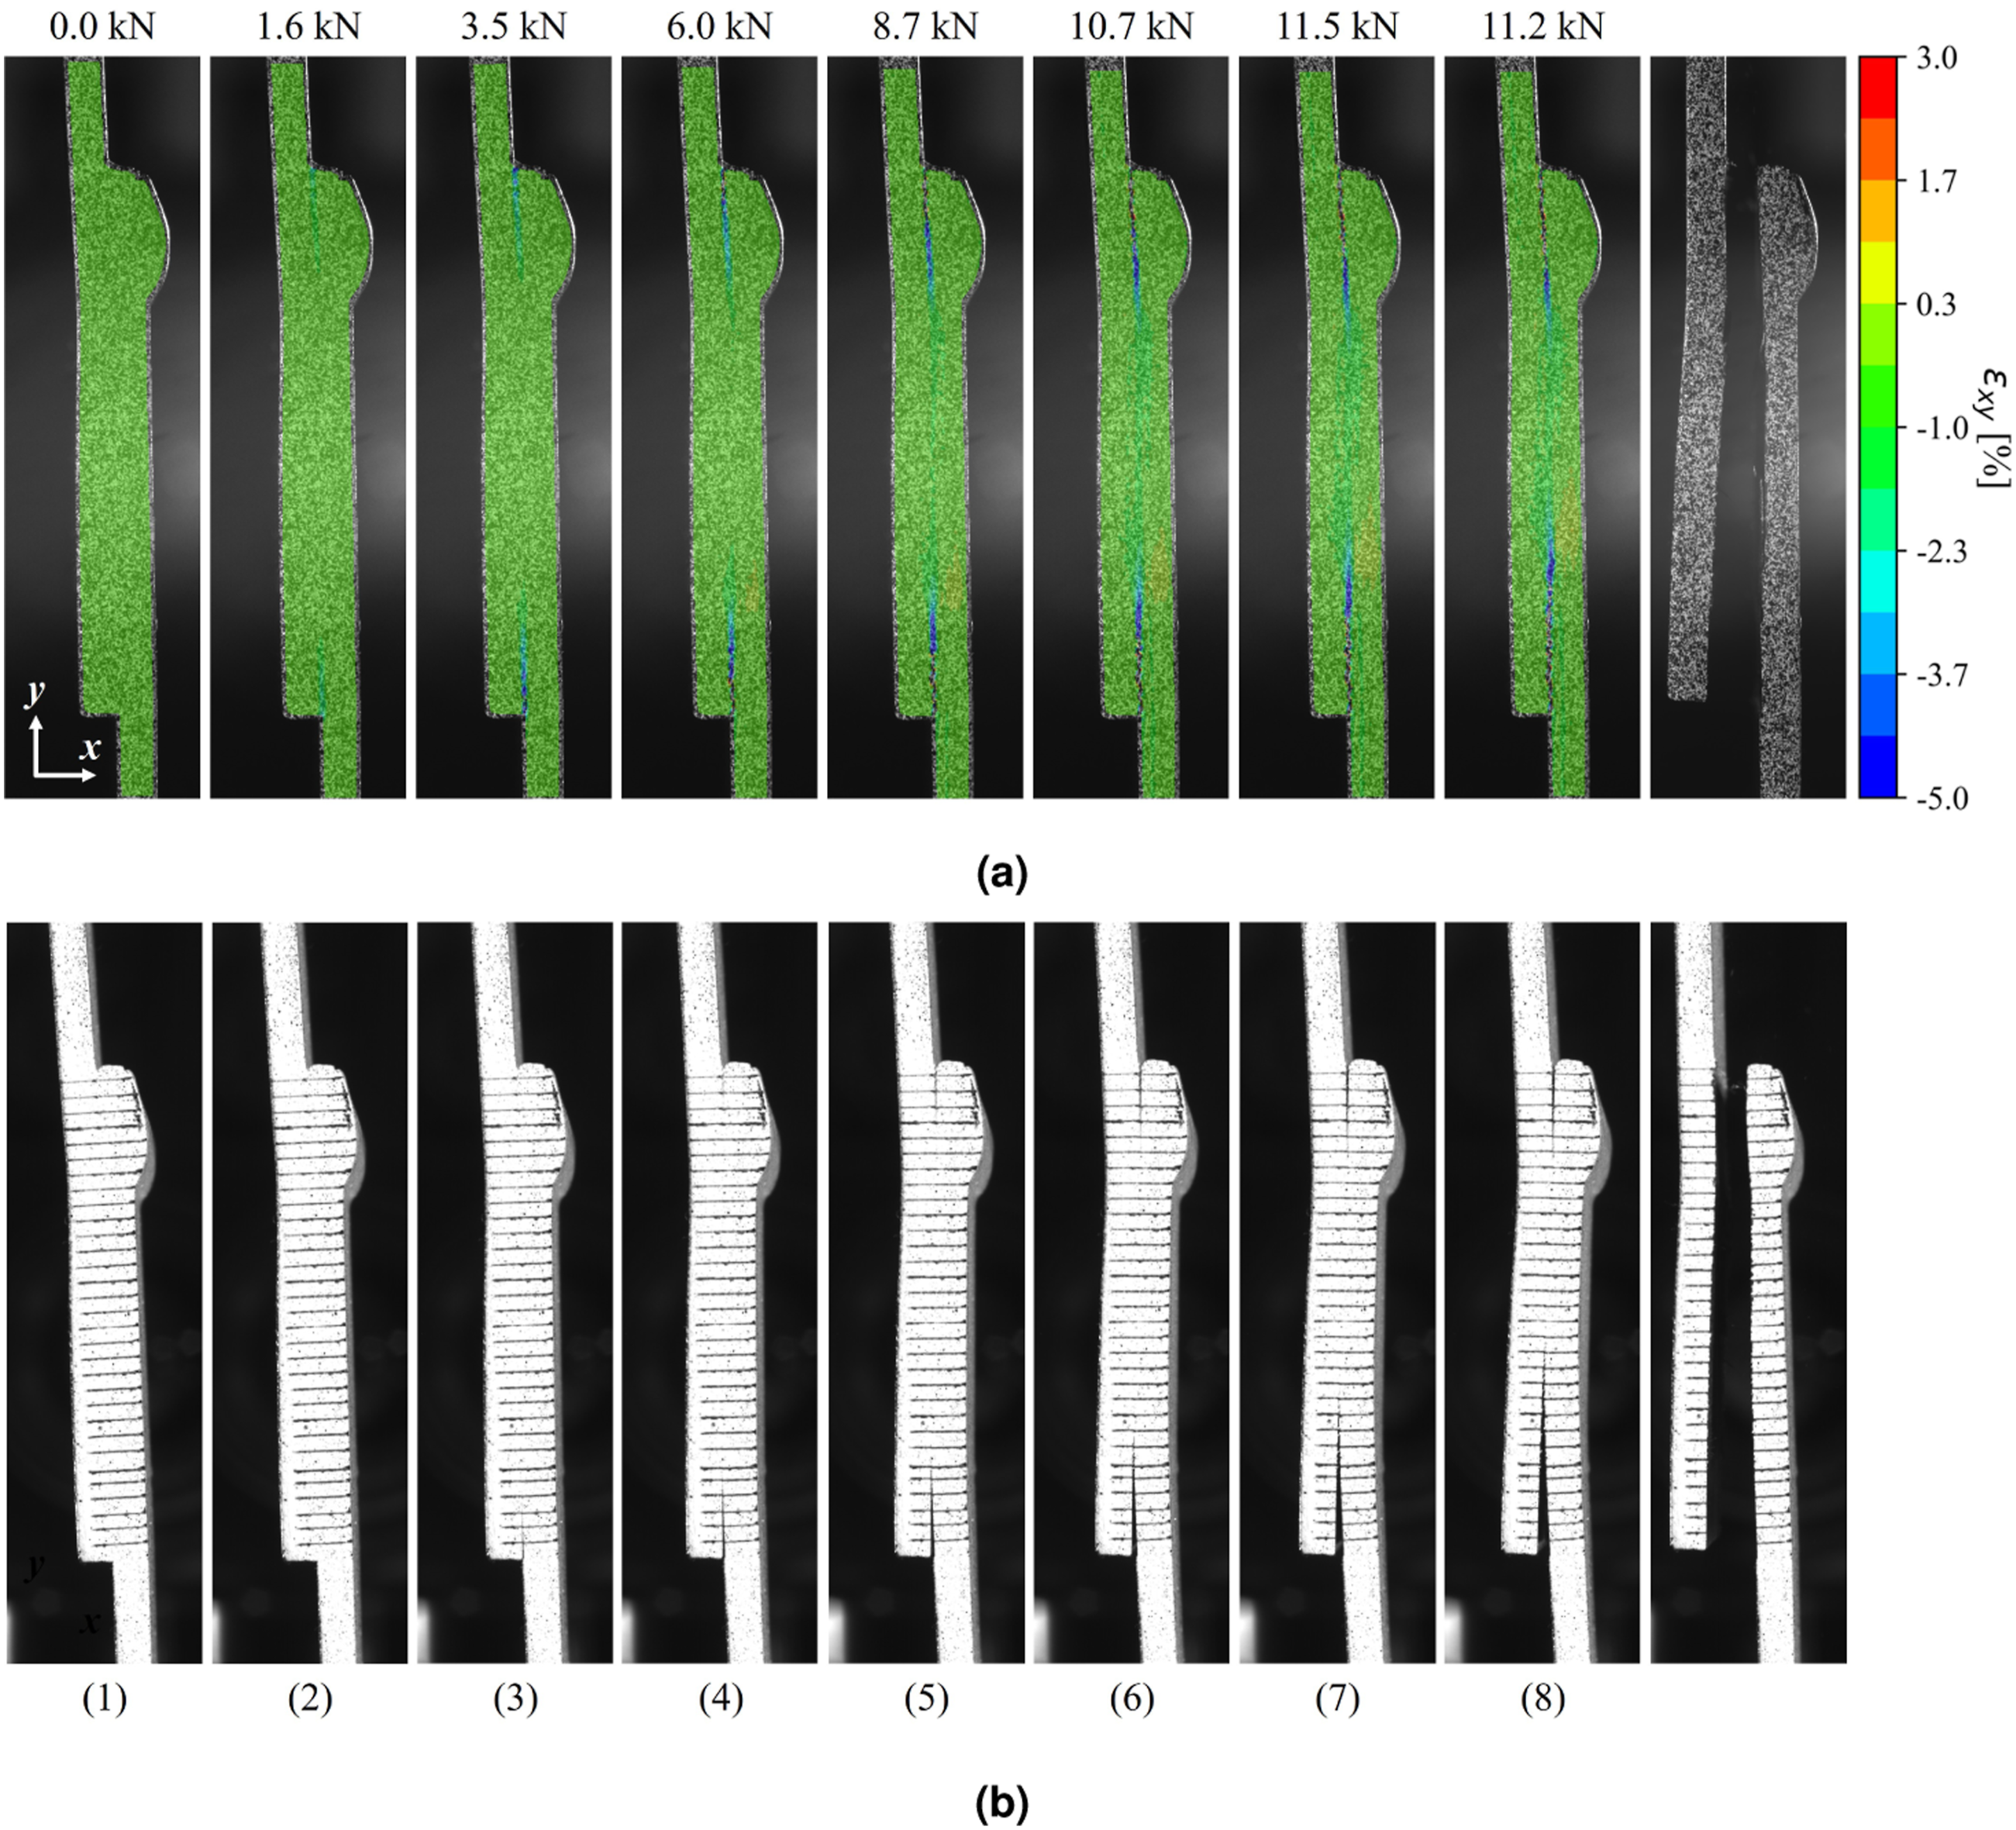
Specimen C3 is not loaded at point (1). First strain concentrations at the top and bottom overlap ends are observed in the DIC images at point (2) for a load of 1.6 kN. A visible crack has developed at the bottom overlap end in the crack growth images at point (3). Increasing the applied displacement load leads to more bending of the specimen and crack growth along the welded interface at points (4), (5), and (6) towards the center of the overlap region. Again, crack growth is slow and stable. Specimen C3 experiences its maximum load at point (7). In the 5 seconds between points (7) and (8), an additional axial displacement of 0.05 mm is applied to the specimen and the reaction force drops by 0.3 kN from 11.5 kN to 11.2 kN. The crack at the top overlap end extends by approximately 0.5 mm, while the crack at the bottom overlap end propagates by more than 3 mm, indicating unstable crack growth after the maximum load is reached. The joint fails immediately afterwards. Like the virgin type A specimen, the virgin type C joint experiences damage growth exclusively along the welded interface.
Throughout the test, both the DIC images and the crack growth images indicate that the crack at the bottom overlap end is longer than at the top overlap end. A direct comparison between the crack length measurements of the two approaches is not possible, however, because the outer plies of the adherends create a +45°/+ 45° weld interface. Hence, crack propagation through the width of the joint occurs at an angle and is not the same on both sides.
The load-displacement curves of the recycled core T700/LM-PAEK joints (type D) are presented in Figure 13. As shown in Figure 5(d), their geometry is closer to a stepped-lap joint at one overlap end and closer to a single-lap joint at the other one. Hence, the structural response of the type D specimens varies considerably from the previously discussed examples. Load-displacement curves of recycled core T700/LM-PAEK joints.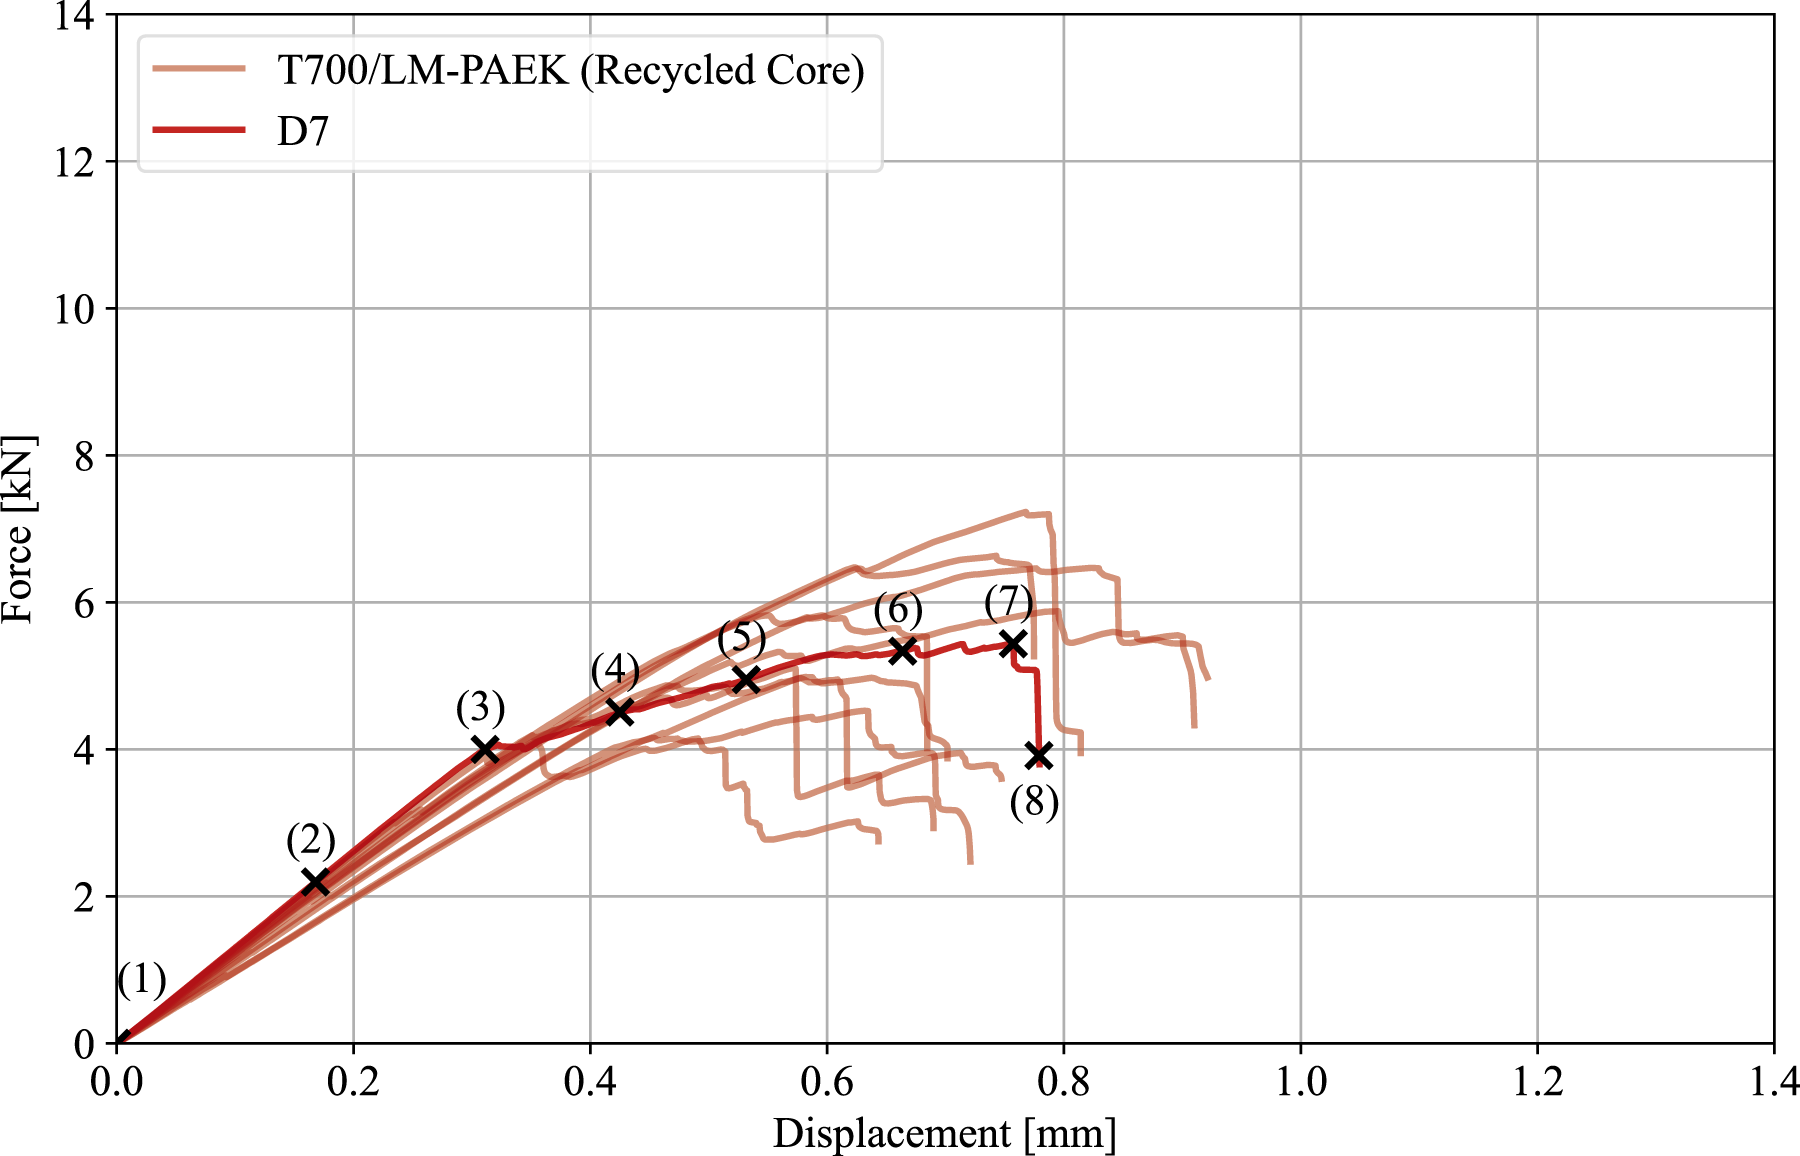
To better understand the reason for the shape of the load-displacement curves, it is important to evaluate them together with the damage evolution images in Figure 14, here for specimen D7. The images in Figure 14 are taken at the points marked in Figure 13. Damage in the overlap region of the recycled core T700/LM-PAEK specimen D7 visualized with (a) 2D DIC using the shear strain ɛ
xy
and with (b) crack growth images.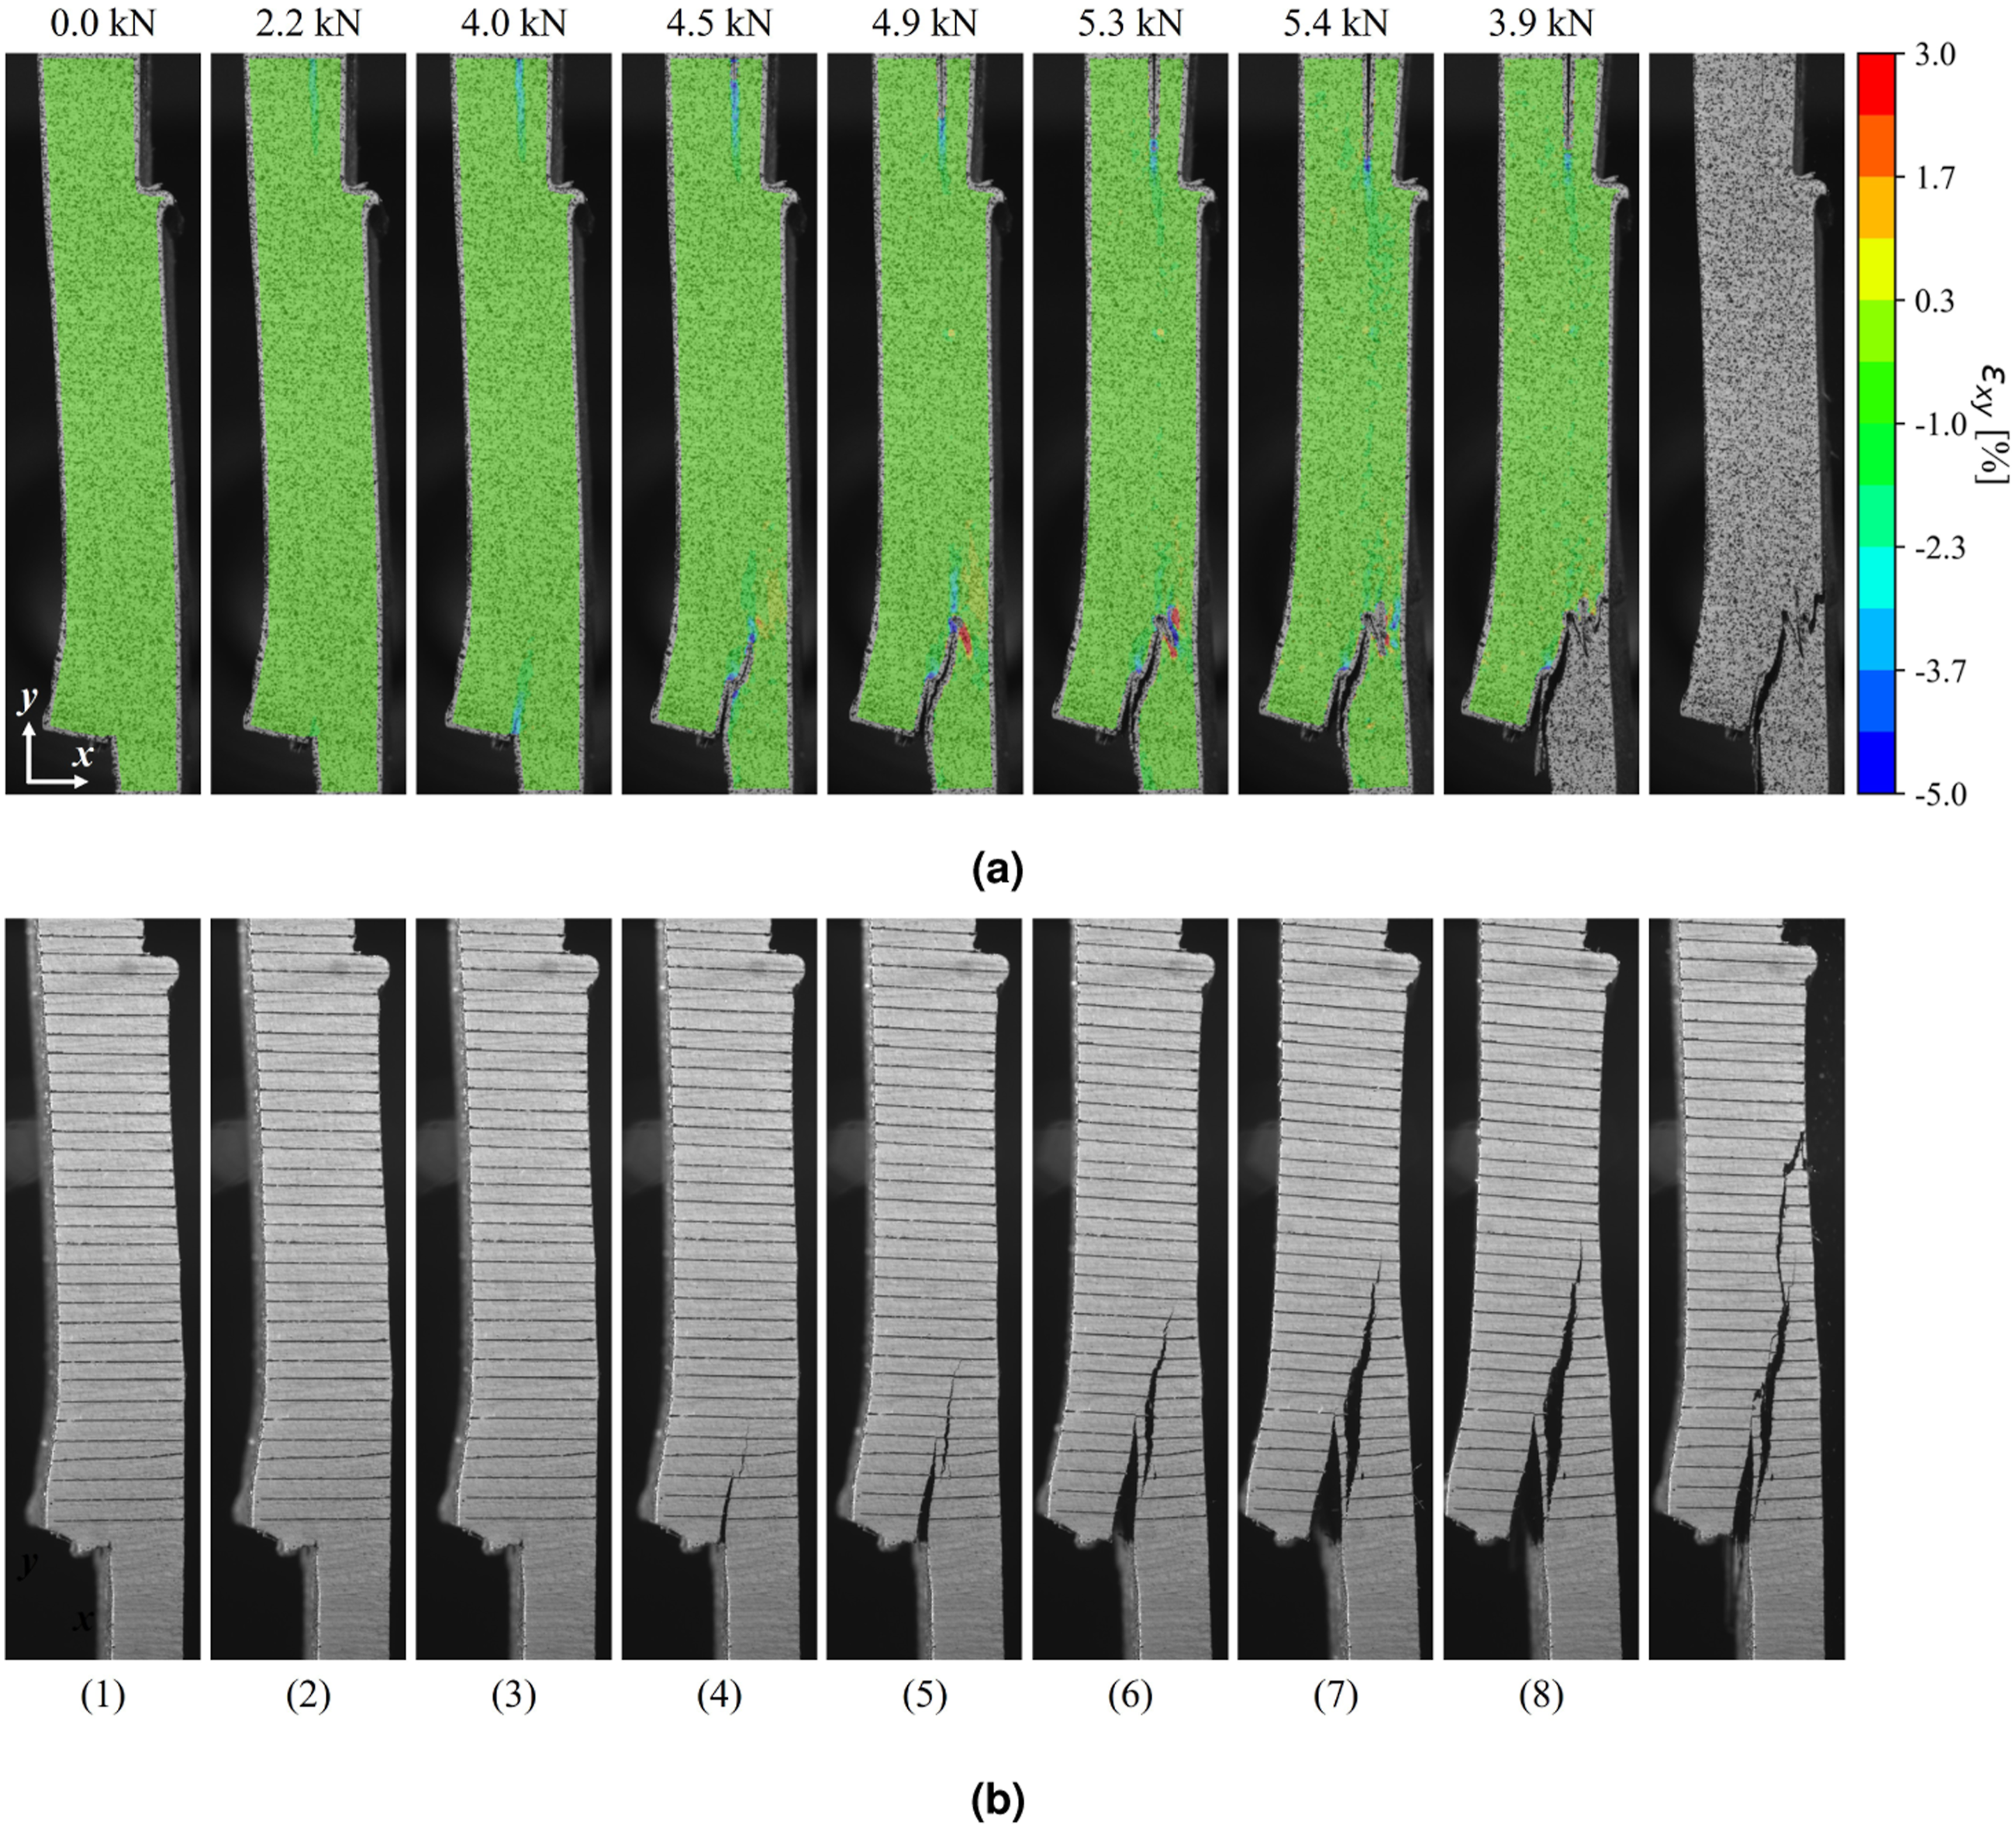
The test begins at point (1). At point (2), the load is equal to 2.2 kN and strain concentrations are visible at both overlap ends with the one at the top being more pronounced. The damage initiation at the top overlap end occurs outside the field of view of Figure 14 at the first thickness variation on the left side of Figure 5(d). Damage at the bottom overlap end is clearly visible at point (3) in the crack growth images. Just after point (3), the load drops as a secondary crack inside the recycled core region of the bottom adherend initiates and propagates through point (4).
The primary crack at the bottom overlap end continues to open as the top adherend rotates around the bottom adherend at point (5). Multiple smaller load drops occur while the secondary crack inside the recycled core region extends at point (6). Crack growth at the top overlap end can only be observed in the DIC images. The maximum load of specimen D7 is reached at point (7). The adherends on the DIC side are completely separated at point (8). Failure occurs when the primary and secondary cracks on the other side link up. The final crack paths on both sides of the specimen are different due to the highly varying material properties of the recycled core material.
All type D joints show a similar damage evolution like specimen D7. Higher maximum loads are the result of a longer propagation phase of the primary crack along the welded interface before the crack in the recycled core region causes load drops and failure. The scatter in the test results is therefore a function of the local variation of the material properties of the recycled core material.
Failure Modes
While the virgin joints types A and C exhibit failure modes common for single-lap shear joints with crack initiation at the overlap ends and crack propagation along the welded interface, fracture in the recycled core specimens B and D is more unconventional and warrants further investigation.
Figure 15 shows images of the moments at which the recycled core T300/PPS (type B) specimens fail. The images are taken with a high-speed camera at 50,000 frames per second which makes it possible to capture multiple pictures during the fracture process. A change of the failure modes is clearly visible from specimen B1 in Figure 15(a) to specimen B5 in Figure 15(e). Specimen B1 fails exclusively along the welded interface. The shearing between the two adherends is reflected in the misalignment of the crack growth markings. Specimen B2 in Figure 15(b) shows less shearing. While the crack originating from the top overlap end propagates along the entire length of the welded interface, the bottom adherend shows signs of through-the-thickness damage. Still, failure is dominated by shearing in the weld line. Specimen B2 does not separate completely after failure and the paint cloud on the bottom adherend indicates that specimen B2 releases more energy than specimen B1. Failure modes of recycled core T300/PPS joints (a) B1, (b) B2, (c) B3, (d) B4, and (e) B5.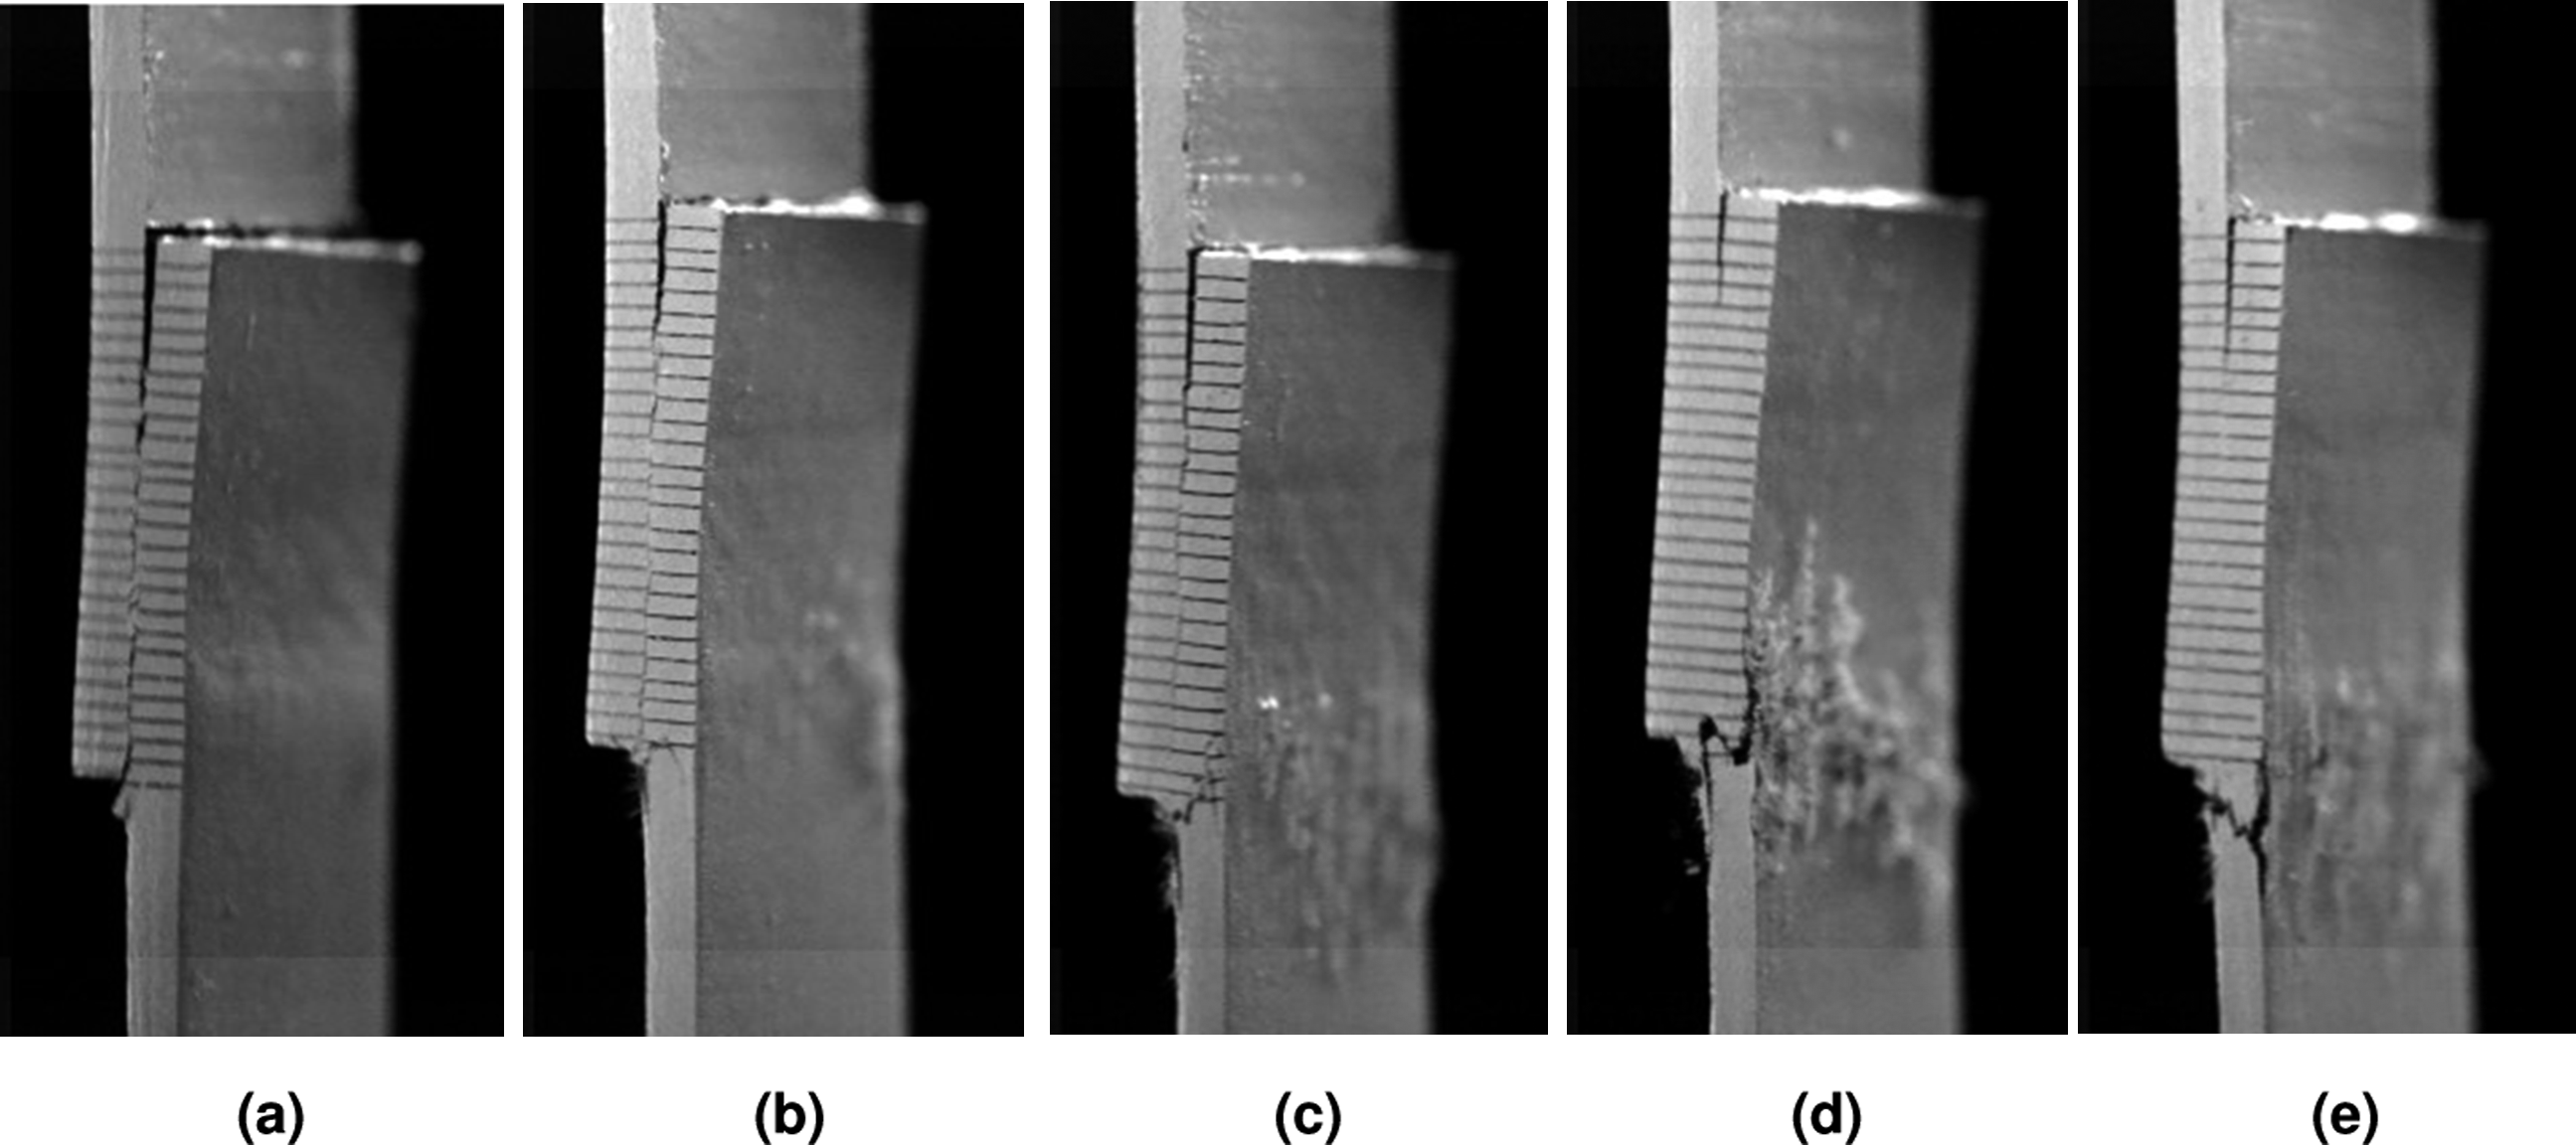
For specimen B3 in Figure 15(c), the crack that initiates at the top overlap end does not extend across the entire overlap length. Instead, the damage at the bottom overlap end leads to adherend failure in the cross-section of the bottom adherend. The energy released during fracture is larger than for specimen B2. The most violent failure is observed for specimen B4 in Figure 15(d). Compared to specimen B3, the crack at the top overlap end barely propagates before failure. The failure mode of specimen B5 in Figure 15(e) is similar to that of specimen B4. However, the crack that leads to adherend failure does not initially extend towards the overlap region, but in the opposite direction instead.
The reason for the observed change in failure modes is the damage pattern at the bottom overlap end where a small, unintended polymer fillet is present. Crack initiation occurs on both sides of the fillet. The upper crack propagates into the weld line, whereas the lower crack migrates towards the delamination between the virgin outer ply and the recycled core material. This delamination is only present for the specimens B3, B4, and B5 where adherend failure occurs. For specimens B1 and B2, where a delamination is not visible in the crack growth images, failure occurs along the welded interface.
While the target welding temperature for the type B joints in Table 3 is reported as 365°C, some temperature variation was measured during the welding process. The welding temperature of specimens B1 and B2 was 365°C, for specimens B3 and B4 366°C, and for specimen B5 378°C. Hence, it could be argued that the variation of the welding temperature leads to an increased fracture toughness along the weld line so that the path of least resistance for crack growth is migration towards the delamination. However, this effect is statistically insignificant when the correlation coefficient between the welding temperatures and the respective lap shear strengths is considered. Indeed, the temperature difference between specimens B1 and B2 compared to B3 and B4 was only 1°C, so it is unlikely that this variation has a significant influence on the failure modes. Instead, it is believed that specimens B3, B4, and B5 feature a stress concentration in the region of the delamination growth due to an unfavorable accumulation of recycled core material next to the virgin outer ply. In other words, the observed difference in failure modes is attributed to a coincidental variation of material properties.
Figure 16 shows a selection of the recycled core T700/LM-PAEK specimens at failure. Fracture always occurs due to a through-the-thickness crack in the bottom adherend. The welding area defined by the conduction welding stamp is clearly visible in Figure 16(a) for specimen D5. The through-the-thickness crack has a tendency to propagate across the specimen width by following the lower boundary of the weld stamp where the polymer bulge is located as seen also in Figure 16(b) for specimen D6. However, this is not always the case as shown in Figure 16(c) for specimen D6. However, this is not always the case as shown in Figure 16(c) for specimen D7. The crack path through the bottom adherend does not follow a clear pattern and appears to be heavily influenced by the random variation of material properties in the recycled core region. Crack propagation along the weld stamp boundary indicates that the fracture toughness in this region is lower than in the welded area. Failure modes of recycled core T700/LM-PAEK joints (a) D5, (b) D6, and (c) D7.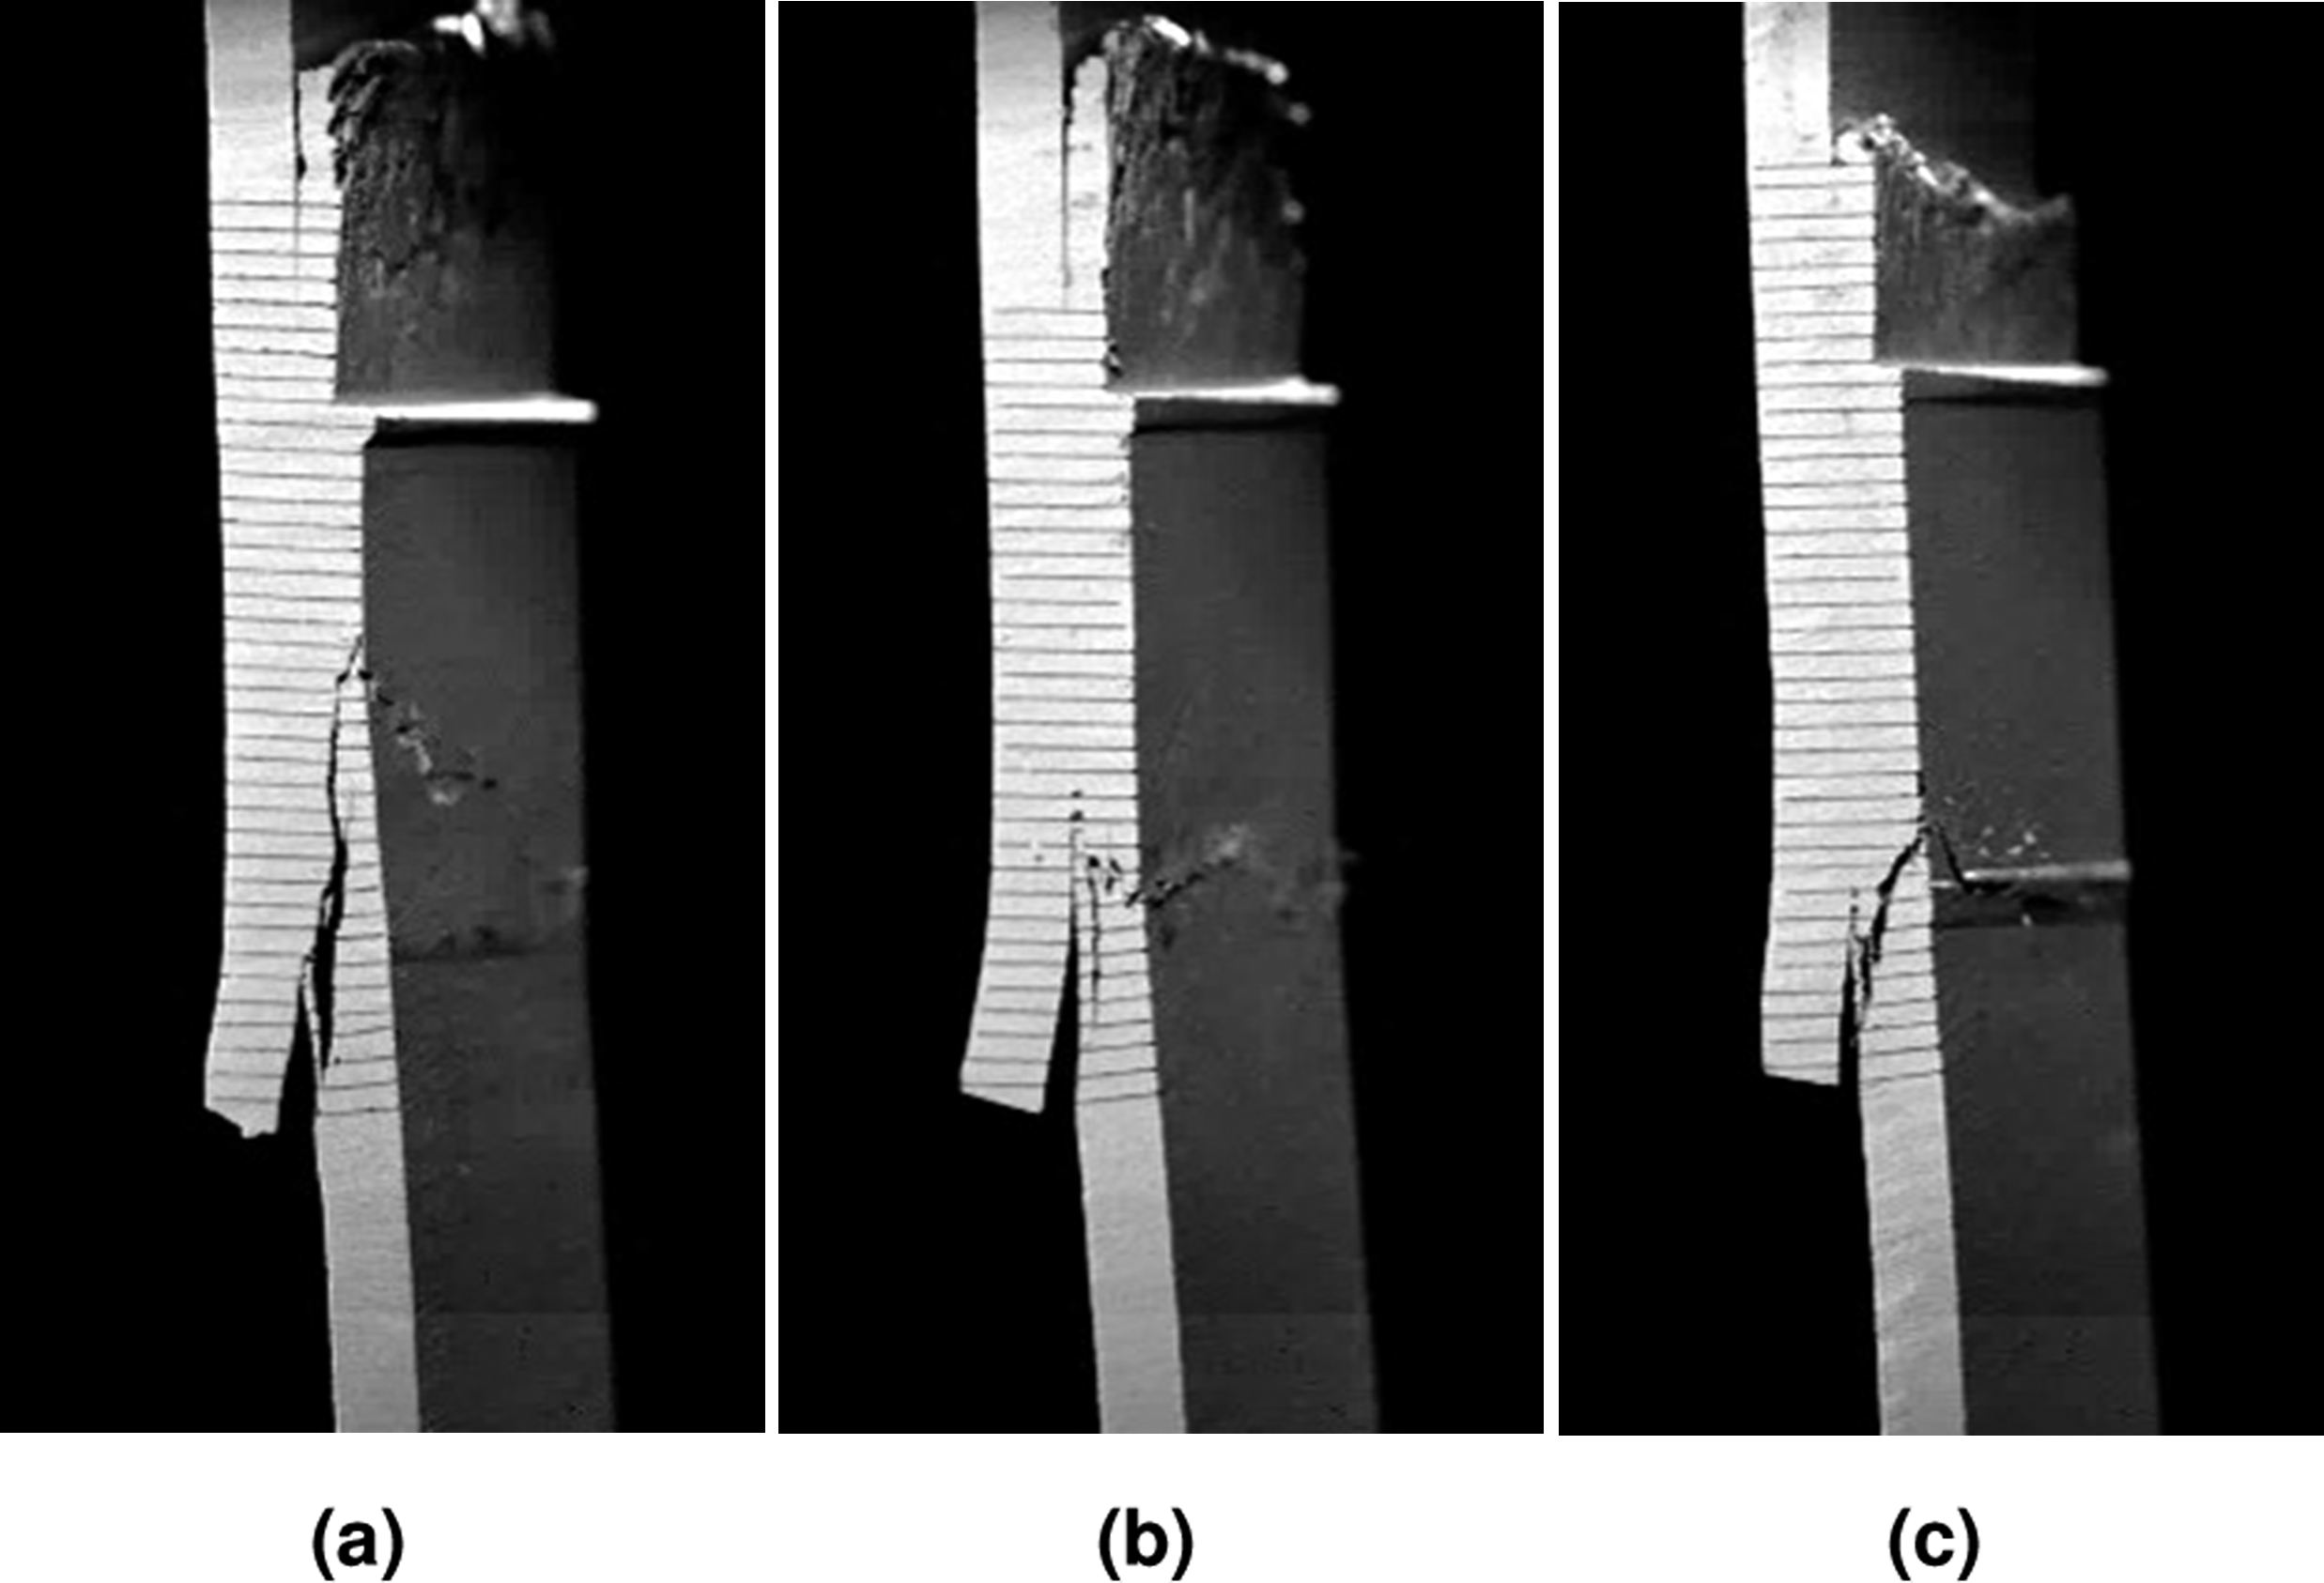
Fracture Surfaces
The evaluation of the fracture surfaces of the different joint types provides additional insight into the observed structural behavior. The fracture surfaces of the previously discussed specimens are presented in Figure 17. Since the weld interface provides the most information about the structural response of the specimens, the fracture surface for specimen B1 is shown instead of that of specimen B4 which fails due to a through-the-thickness crack. The adherends of the type D joints are still partly connected after failure, so specimen D7 is pulled apart in the test bench after the experiment to allow microscopy of the fracture surface. Fracture surfaces of (a) virgin T300/PPS specimen A4, (b) recycled core T300/PPS specimen B1, (c) virgin T700/LM-PAEK specimen C3, and (d) recycled core T700/LM-PAEK specimen D7.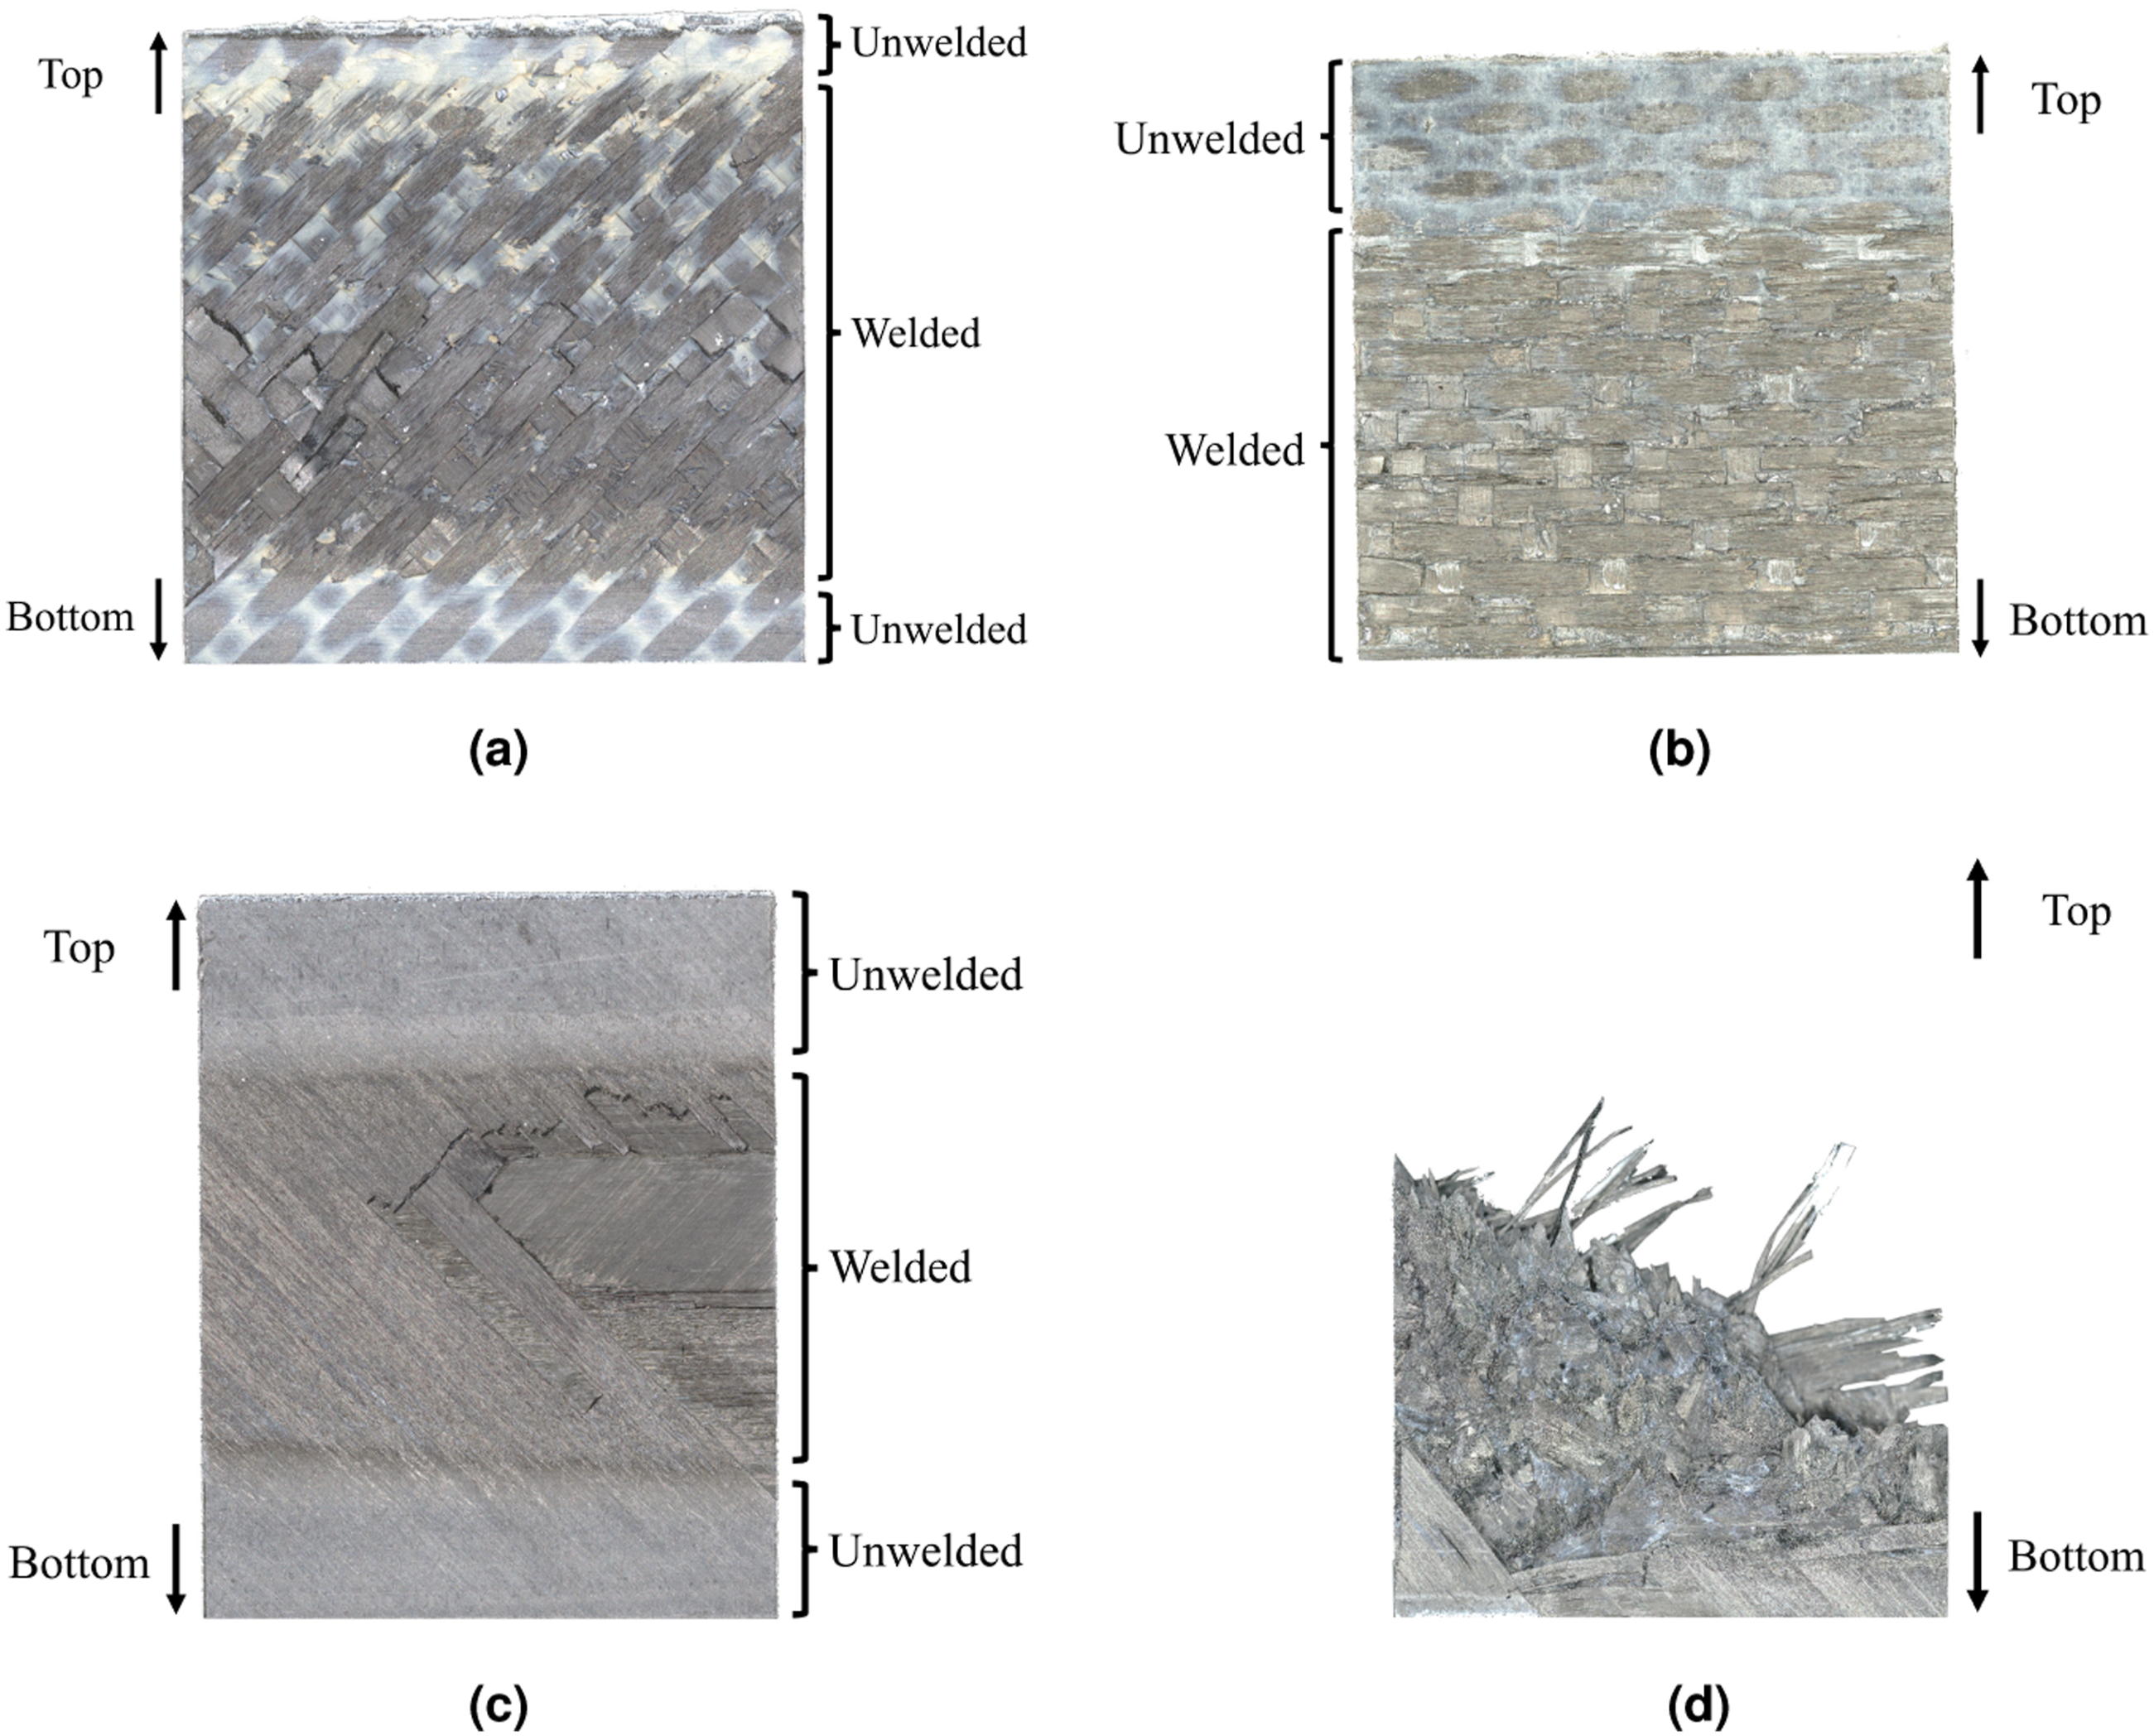
Looking at three of the four fracture surfaces, it is apparent that the single-lap shear joints are not completely welded across their entire overlap. The virgin joints A4 and C3 feature unwelded areas at each end of the overlap region. In contrast, only the top end of specimen B1 is unwelded. Due to the adherend failure of specimen D7, it is not possible to investigate the extent of the welded area. The location of the unwelded regions at the overlap ends explain the low damage initiation loads observed in the DIC and crack growth images. Furthermore, they provide a reason for the damage growth of specimen B4 in Figure 10. Since the fracture toughness of the unwelded region is much lower, damage initiation and propagation occur predominantly at the top overlap end.
The fracture surfaces also show the orientation of the outermost adherend plies, namely
Industrial Applicability and Certification Implications
The recycled SLS joints feature strength and stiffness reductions between 6% and 41% compared to their virgin counterparts as reported in Table 5. Therefore, potential applications for the recycled structures are limited to cases where high mechanical properties are not the deciding factor for the material selection. Examples are aircraft structures with complex geometries like brackets where discontinuous fiber-reinforced composites, which are microscopically similar to the mechanically recycled joint regions, may even be preferred over continuous fiber-reinforced polymers because the former can assume complex shapes more easily. Additionally, the strength and stiffness losses of mechanically recycled parts are less severe compared to virgin structures made from discontinuous fibers.
The inherent inhomogeneity of the microstructure in mechanically recycled fiber-reinforced composites leads to additional challenges during design and certification. First, the higher data scatter in the mechanical properties of recycled joints reduces the achievable design values. Second, the qualification of thermoplastic welded joints relies on pre-defined process windows to produce structures with a consistent quality that can be certified. Allowable process windows are influenced by the substrate material properties, laminate architecture, interface materials, joint design, and welding process parameters. 26 Since these elements are not the same for virgin and recycled thermoplastic welded joints, the inclusion of recycled material in the substrates necessitates additional efforts to determine suitable ranges for the aforementioned parameters such that qualification, and subsequently certification, can be successful.
Conclusions
The structural behavior of thermoplastic welded single-lap shear joints made from a recycled core placed between two facesheets of virgin plies was tested experimentally under quasi-static conditions. It was compared to thermoplastic welded single-lap shear joints entirely made from laminates consisting of virgin material. The joint adherends consisted of induction welded fabric T300/polyphenylene sulfide (T300/PPS) and conduction welded unidirectional T700/low-melt polyaryletherketone (T700/LM-PAEK). The average maximum load, average lap shear strength, and average initial joint stiffness of the recycled core T300/PPS joints were 15.1%, 13.8%, and 22.7% lower than for their virgin counterparts. The reduction for the recycled core T700/LM-PAEK joints was 49.4% for the average maximum load, 41.2% for the average lap shear strength, and 5.8% for the average initial joint stiffness. The random distribution of the recyclate material in the core region of the recycled joints leads to higher variance in the test results.
All specimens, except for the recycled core T700/LM-PAEK joints, featured slow and stable crack growth until the maximum load was reached. Crack growth after the maximum load was unstable and lead to sudden failure. Damage initiation and propagation in the virgin thermoplastic welded specimens were similar to that of adhesively bonded single-lap shear joints. Damage initiated at both overlap ends at relatively low loads and propagated along the weld line towards the joint center. Shearing along the weld line was the final failure mode. Some of the recycled core T300/PPS joints also experienced delaminations between the outer virgin plies and the recycled core material close to one of the overlap ends. The geometry of the recycled core T700/LM-PAEK joints lead to increased bending deformation of the specimens during loading which caused adherend failure in the overlap region.
Even though recycled thermoplastic welded single-lap shear joints do not carry loads as efficiently as their virgin counterparts, the reduction in strength, especially for the T300/PPS joints, is not too drastic to completely discard their use, considering also their positive impact on the circularity in aviation.
Footnotes
Acknowledgements
The authors thank Collins DTC and the NLR for specimen production.
Declaration of conflicting interests
The author(s) declared no potential conflicts of interest with respect to the research, authorship, and/or publication of this article.
Funding
The authors disclosed receipt of the following financial support for the research, authorship, and/or publication of this article: This research was funded by European Union’s Horizon 2020 research and innovation programme under grant agreement number 101006952.
Data Availability Statement
The datasets generated during and/or analyzed during the current study are available in the Zenodo repository at ![]() .
27
.
27