




Abstract
The rising popularity of online surveys in marketing research precipitates a flood of e-mail invitations requesting participation from potential respondents. As a result, response rates are diminishing, reflecting a decline in the willingness to participate in web surveys. To compare the effectiveness of different response-enhancing techniques in a list-based web survey, an experiment with a full factorial between-subjects design varying the factors sender, number of contacts, and questionnaire layout was set up. A total of 1,563 members from a list of information technology (IT) managers employed at Austrian companies were assigned randomly to one of eight experimental conditions. Their willingness to participate was measured in terms of total response and break off. The results indicate that using a prenotification message and a female sender for contacting male sample members increases response rates; using an advanced questionnaire layout significantly reduces break offs, but does not influence total response.
Introduction
Gaining cooperation of contacted individuals to participate in surveys is essential to the success of self-administered data collection methods. Low response rates potentially introduce nonresponse bias (Groves, 1987), jeopardizing the validity of research studies’ results and their practical implications. Declining response rates and the challenge of nonresponse have been unresolved issues in survey research for decades now (Steeth, 1981). The introduction of new web-based methods does not solve the problem. On the contrary, Lozar Manfreda, Bosnjak, Berzelak, Haas, and Vehovar (2008) show in a meta-analysis of 24 experimental studies, that, on average, traditional survey methods lead to 11% higher response rates than web-based survey methods.
Due to the rising interest in using web technologies for contacting potential respondents and surveying them online, researchers run the risk of contacting Internet users too frequently, thereby undermining their willingness to participate in web surveys. This development is a minor threat to studies conducted through online access panels, where members have voluntarily signed up for regularly filling questionnaires. When samples for web surveys come from other sources like closed communities, the nonresponse problem might be more pronounced, though. These so-called list-based samples of high-coverage populations (Couper, 2000, p. 485) are drawn from a frame of members who registered their e-mail addresses for communication within a group based on some mutual interest. Members of professional associations or customer loyalty clubs, employees, students, and other groups that have high or even complete Internet coverage are increasingly popular targets of intra-organizational web surveys, as they can be contacted quite easily.
Researchers try various different ways of increasing the response rate for web surveys, most of them following established techniques of self-administered offline surveys. Thus far, no single standard technique is available. Therefore, finding ways that help increase respondents’ willingness to participate in web surveys is necessary. This article addresses the problem of decreasing response rates in list-based web surveys by empirically testing techniques that seek to increase participation.
Literature Review and Hypotheses
Dillman’s Tailored Design Method seeks to minimize all possible sources of error in self-administered surveys by establishing trust among sample members that they will benefit from participating in the survey at low personal cost (Dillman, Smyth, & Christian, 2009). Two of the main elements of this method are the number of contacts, and a respondent friendliness of the survey design.
Contact Strategy
A survey’s contact strategy can be subdivided into qualitative and quantitative components (Jackob & Zerback, 2006). A qualitative component of the contact strategy in web surveys that relatively few studies have considered thus far is the role of a survey invitation’s sender. Compared to mailed pieces that have the advantage of numerous visual cues (e.g., colored envelope, printed logos, handwritten address, special issue stamp), survey invitations sent via electronic mail offer only limited features to induce the addressee to open the mail (Tuten, 1997). Together with the text of the subject line, the name and the e-mail address of the sender are the only pieces of information the recipient of an electronic mail sees in advance. Cues like the name and the sender’s gender might therefore play a crucial role in the decision process. Although there is ample evidence in the survey literature that women are more likely than men to complete surveys (e.g., Curtin, Presser, & Singer, 2000; Groves & Couper, 1996), a meta-analytic review of the social psychological literature on general helping behavior by Eagley and Crowley (1986) reveals that men more often show helpful behavior toward women than toward other men. Althoff, Greif, Griel, and Batinic (2006) present findings that partly confirm this phenomenon for senders of survey invitations by demonstrating that a female sender can generate a higher response rate in a male-dominated target group than a male sender. In a list-based web survey where the list members have only limited or no prior contact with the researcher sending out the survey invitation, recipients have just a few external cues that can support their decision whether to participate in the survey or not. The sender’s gender is one of them and might therefore attract special attention.
Hypothesis 1: In a list-based web survey in a male-dominated population, the use of a female sender leads to a higher response rate than using a male sender.
The quantitative component of a survey’s contact strategy is the number of single contacts with sample members. Meta-analyses of online studies using e-mail for contacting potential respondents show that a multiple-contact strategy highly influences the response rate (Cook, Heath, & Thompson, 2000; Lozar Manfreda et al., 2008). In contrast to follow-up reminders, which are very popular with researchers in mail and web surveys alike, list-based web surveys usually ignore prenotification messages. While prenotifying potential respondents of an upcoming survey proves to be very effective in offline studies (Kindra, McGown, & Bougie, 1985), the results in the online realm are inconclusive (Haas, Bosnjak, Bandilla, Couper, & Galesic, 2009; Kent & Brandal, 2003). Prenotification by means of other media like postcards (Kaplowitz, Hadlock, & Levine, 2004) and mobile text messages (Bosnjak, Neubarth, Couper, Bandilla, & Kaczmirek, 2008) prove to be effective techniques to enhance response rates in web surveys.
The theory of cognitive dissonance explains the positive influence of prenotification messages on survey participation in offline studies. A short message about an upcoming survey induces a feeling of dissonance in the invitee, “a dissonance that could be resolved by returning the questionnaire to the researcher” (Hackler & Bourgette, 1973, p. 277). No apparent reason exists why this mechanism should not apply to electronic mail as well, especially in closed populations, where the primary purpose of the community is not to fill questionnaires.
Hypothesis 2: In a list-based web survey, sending a prenotification e-mail leads to a higher response rate than when there is no prenotification.
Questionnaire Design
A wide body of scientific literature discussing different features of web questionnaire design already exists (e.g., Couper, 2008; Dillman et al., 2009). Compared with other elements of questionnaire design, such as use of graphic scales, multimedia features, interactive respondent feedback, and so on, the visual layout of web questionnaires receives only minor attention in empirical studies. This fact is rather striking, since factors such as color, attractive layout, and other features of questionnaire appearance have the potential to affect respondents’ perception of the survey’s professionalism (Childers & Skinner, 1996). The weak to nonexisting effects of different questionnaire layout features like pictures and static graphics (Heerwegh & Loosveldt, 2006) or background color (Baker & Couper, 2007) on response rate in web surveys seem to suggest that using them in isolation does not influence respondent behavior. Childers and Skinner (1996) argue, though, that “such factors as paper color, booklet format, and printing may not in themselves have a significant effect, but may provide the basis upon which other effects are founded” (p. 196). Respondents might therefore view a survey projecting a professional image in a more positive light, resulting in a higher response rate. Dillman, Tortora, Conrad, and Bowker (1998) created a “fancy design” (their term) web questionnaire that includes various graphics as well as different background and text colors. The authors show that the use of this layout leads to a substantial increase in response time and number of premature break offs compared with a “plain design” questionnaire. However, their results are likely attributable to the then low bandwidth and the therefore long downloading times for these additional features. More recently, Waltson, Lissitz, and Rudner (2006) show that the respondents to a pop-up survey rate the survey better in terms of attractiveness and stimulation if they receive a “graphic” (their term) web questionnaire that is professionally designed, incorporating various colors, font types, and font sizes as well as pictures. Still, the authors find no positive influence of questionnaire appearance on survey completion.
Internet users, especially those who register their e-mail addresses in some sort of directory, might get flooded with invitations to participate in web surveys of highly diverse quality. For survey respondents “it will become increasingly difficult to distinguish the good from the bad” (Couper, 2000, p. 465), and they might more than ever base their decision to participate on such factors as questionnaire layout, entertainment factor, and survey topic.
Hypothesis 3: In a list-based web survey, using an advanced questionnaire (i.e., color, enhanced navigational elements, enlarged font size) layout leads to a higher response rate than using a basic layout (i.e., black and white, standard HTML elements).
Methodology and Experimental Design
Sample Composition and Questionnaire
In cooperation with an Austrian information technology (IT) services provider, 1,926 IT managers employed at Austrian companies were selected from the sponsor’s list of current and prospective customers and invited by e-mail in April 2008 to participate in a web survey about their attitude toward and their use of different IT services. One of the idiosyncrasies of the sample is the uneven distribution of gender in the sampling frame, as 93.5% of the IT managers are male.
The contacted individuals received a personalized URL along with an e-mail invitation. A click on the link automatically transferred respondents to a web questionnaire containing a total of 70 items presented on 32 pages, including the introductory and the end page. On average, respondents completed the entire questionnaire in 13.5 minutes. The survey was online for 3 weeks, and the invitees who did not respond to the survey within 1 week after the initial contact received one reminder.
Experimental Treatments
To test the effect of different survey design features on response rate, three factors were experimentally varied. To assess the influence of the contact strategy, one half of the target group received a short prenotification message by e-mail, announcing the upcoming survey 1 week before the actual invitation was sent. The other half did not receive such a prenotification message.
In all, 50% of the sample members were contacted by a female sender, 50% by a male. The contact remained the same for the whole survey. E-mails were processed through the senders’ university accounts with their names visible in the sender line of the message.
The final experimental treatment has to do with the manipulation of the web questionnaire’s layout. Half of all e-mail invitations contained a link to a web questionnaire with a professionally designed layout and the other half to a basic version. The basic layout version consisted of black text on white background, standard HTML radio buttons, and check boxes as well as gray navigation buttons known from many web applications. The advanced questionnaire was used to give the survey a more professional look. A muted, bluish-purple frame with a white globe in the upper left corner gave the questionnaire a more structured look. The question text was in the same color as the frame, on a white background. If a respondent selected an item, the radio button next to the item was marked with a red check mark instead of the more common black dot. Modified navigation buttons and an adapted progress bar mirror the new layout. Both layout versions were completely identical in all other elements of the questionnaire such as length, question wording, and instructions as well as answer categories and scales.
The full factorial 2 (Female Sender vs. Male Sender) × 2 (With Prenotification vs. Without Prenotification) × 2 (Advanced Layout vs. Basic Layout) design of the experiment led to eight versions of the survey. The 1,926 IT managers were randomly assigned to one of the eight survey groups. After the exclusion of a total of 363 erroneous and ineligible addresses, the sampling frame consisted of 1,563 sample members eligible for the study.
Dependent Variables
Response rate is operationalized according to the American Association for Public Opinion Research’s (AAPOR 2009) RR5: the number of fully completed questionnaires divided by the number of all eligible list members. The study classifies those who did not finish the survey or only viewed the questionnaire without answering a single question as nonrespondents. For further analysis, complete respondents and nonrespondents received the codes 1 or 0, respectively. To assess the break off rate, the study classifies individuals who accessed the introductory page by clicking on the link in the e-mail invitation as either having terminated the survey at any point while filling the questionnaire (1) or having completed the survey by reaching the final page of the web questionnaire (0).
Results
Table 1 shows the experiment’s outcome for the different treatment groups in terms of response and break off rate. Of the 1,563 invited IT managers, 460 completed the survey by reaching the final page of the web questionnaire (RR5: 29.4%). Of the 591 individuals who accessed the introductory web page of the questionnaire by clicking on the link in the e-mail message, 22.2% terminated the web questionnaire prematurely.
Response Rates for Different Experimental Treatments

Logistic regression determines whether significant differences in participation behavior across survey conditions exist. Dummy variables for sender’s gender (female, coded 1), number of contacts (with prenotification, coded 1), and questionnaire layout (advanced layout, coded 1) serve as predictors for participation behavior. To test for potential moderation, the analysis considers 2- and 3-way interaction terms as well. Several models are calculated for each of the two dependent participation variables, starting with a full model including main effects and all possible interaction terms. Models are then reduced by excluding interaction effects stepwise, until only the basic model remains. Model selection is based upon a chi-square test for the difference in −2 log likelihood between models of different complexity. Raising e to the power of the coefficient calculates odds ratios and allows for interpretation of the effects the independent variables have on the probability of participation and break off.
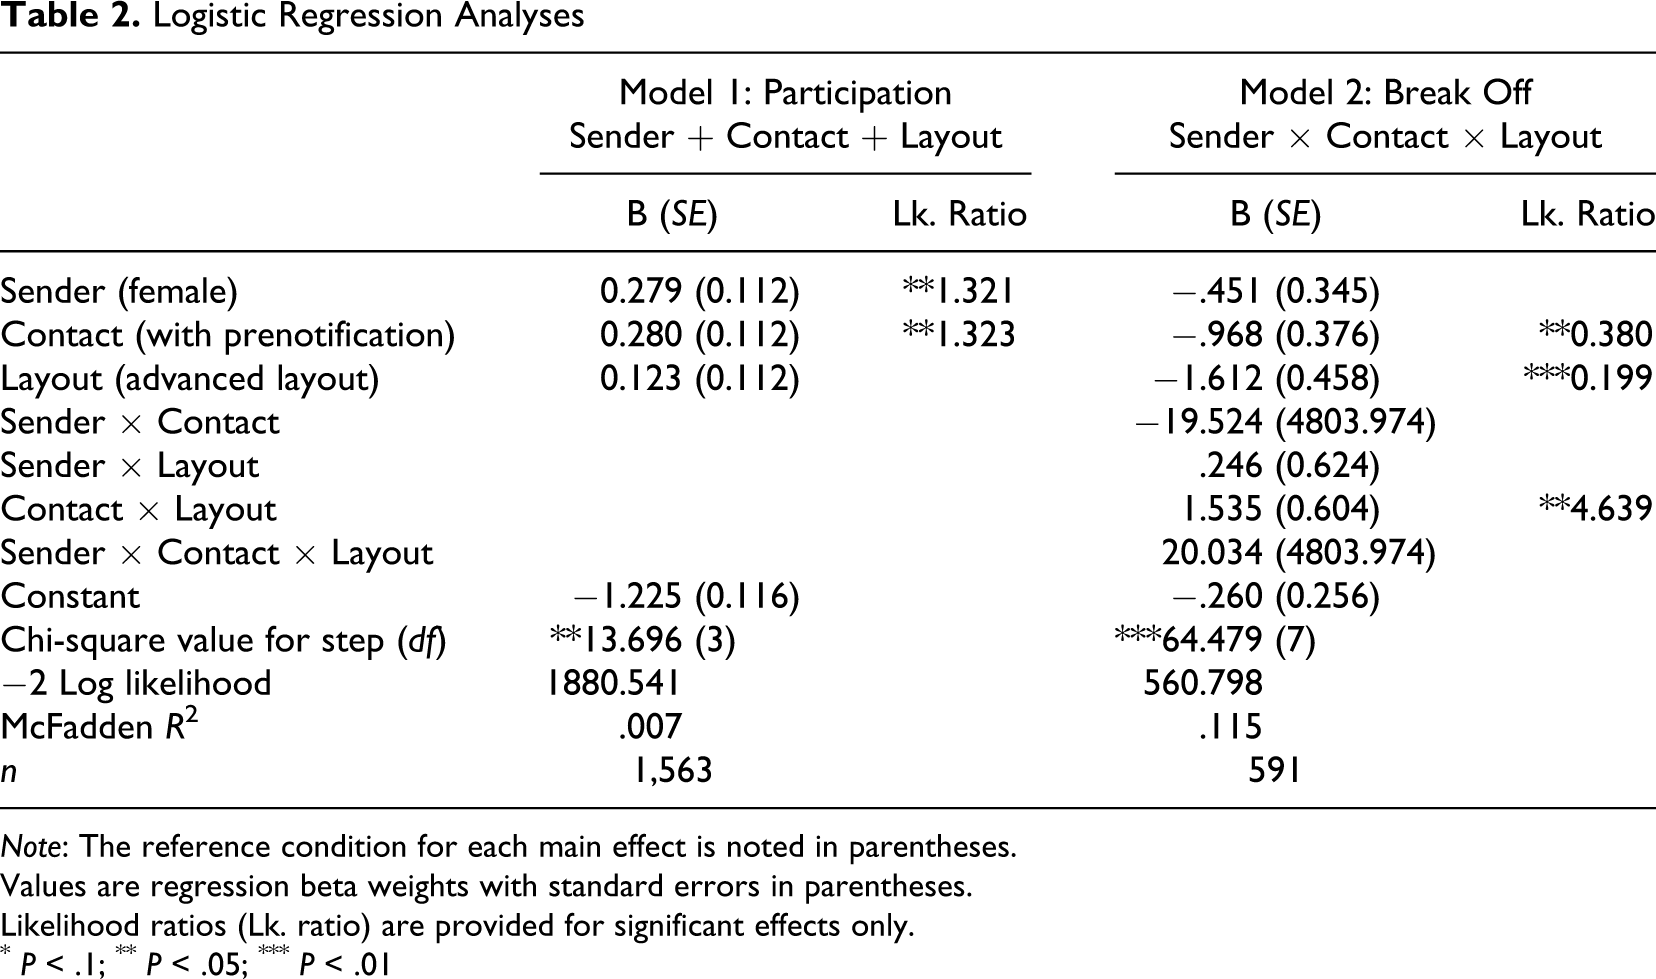
A comparison of the logistic regression models used to predict whether an invited sample member participates in the web survey or not shows that reducing the full model to a reduced model including just the three main effects does not lead to a significant change in −2 log likelihood, χ2 = 6.602, df = 4, p > .05. Model 1 in Table 2 shows that the sender’s gender (B = 0.279) and the number of contacts (B = 0.280) have a significant influence on response rate, confirming Hypothesis 1 and Hypothesis 2, respectively. More invited IT managers completed the survey if contacted by a female researcher (32.2% for female sender vs. 26.5% for male sender), or if they received a prenotification e-mail (32.3% with prenotification vs. 26.6% without prenotification). Expressed in terms of odds ratios, these results mean that the odds of fully participating are 32% higher for the female sender versus the male sender or with prenotification versus without. Contrary to the assumption in Hypothesis 3, questionnaire layout does not significantly influence the response rate in this study.
Logistic Regression Analyses
Note: The reference condition for each main effect is noted in parentheses.
Values are regression beta weights with standard errors in parentheses.
Likelihood ratios (Lk. ratio) are provided for significant effects only.
* P < .1;
** P < .05;
*** P < .01
Reducing the full model predicting whether an individual broke off in the survey that includes the 3-way and all 2-way interactions leads to a significant loss of information, χ2 = 12.270, df = 1, p < .001. Therefore, interpretation rests upon the full model containing the three main effects and all possible interaction effects. Model 2 in Table 2 endorse highly significant main effects for questionnaire layout (B = −1.612) and prenotification (B = −0.968). More individuals who started the survey broke off the questionnaire if they saw the basic layout (24.7% for basic layout vs. 19.7% for advanced layout) and if they did not receive a prenotification message (19.0% with prenotification vs. 25.6% without prenotification). The odds of breaking off are therefore 80% lower for respondents who received the advanced layout and 60% lower with prenotification than without. Additionally, the interaction term between contact and layout is significant (B = 1.535). Figure 1 shows that the advanced layout is very effective in reducing the break off rate among individuals who did not receive a prenotification. However, it can also be seen that more individuals broke off the survey in the prenotification group if presented with the advanced layout compared to the basic layout.
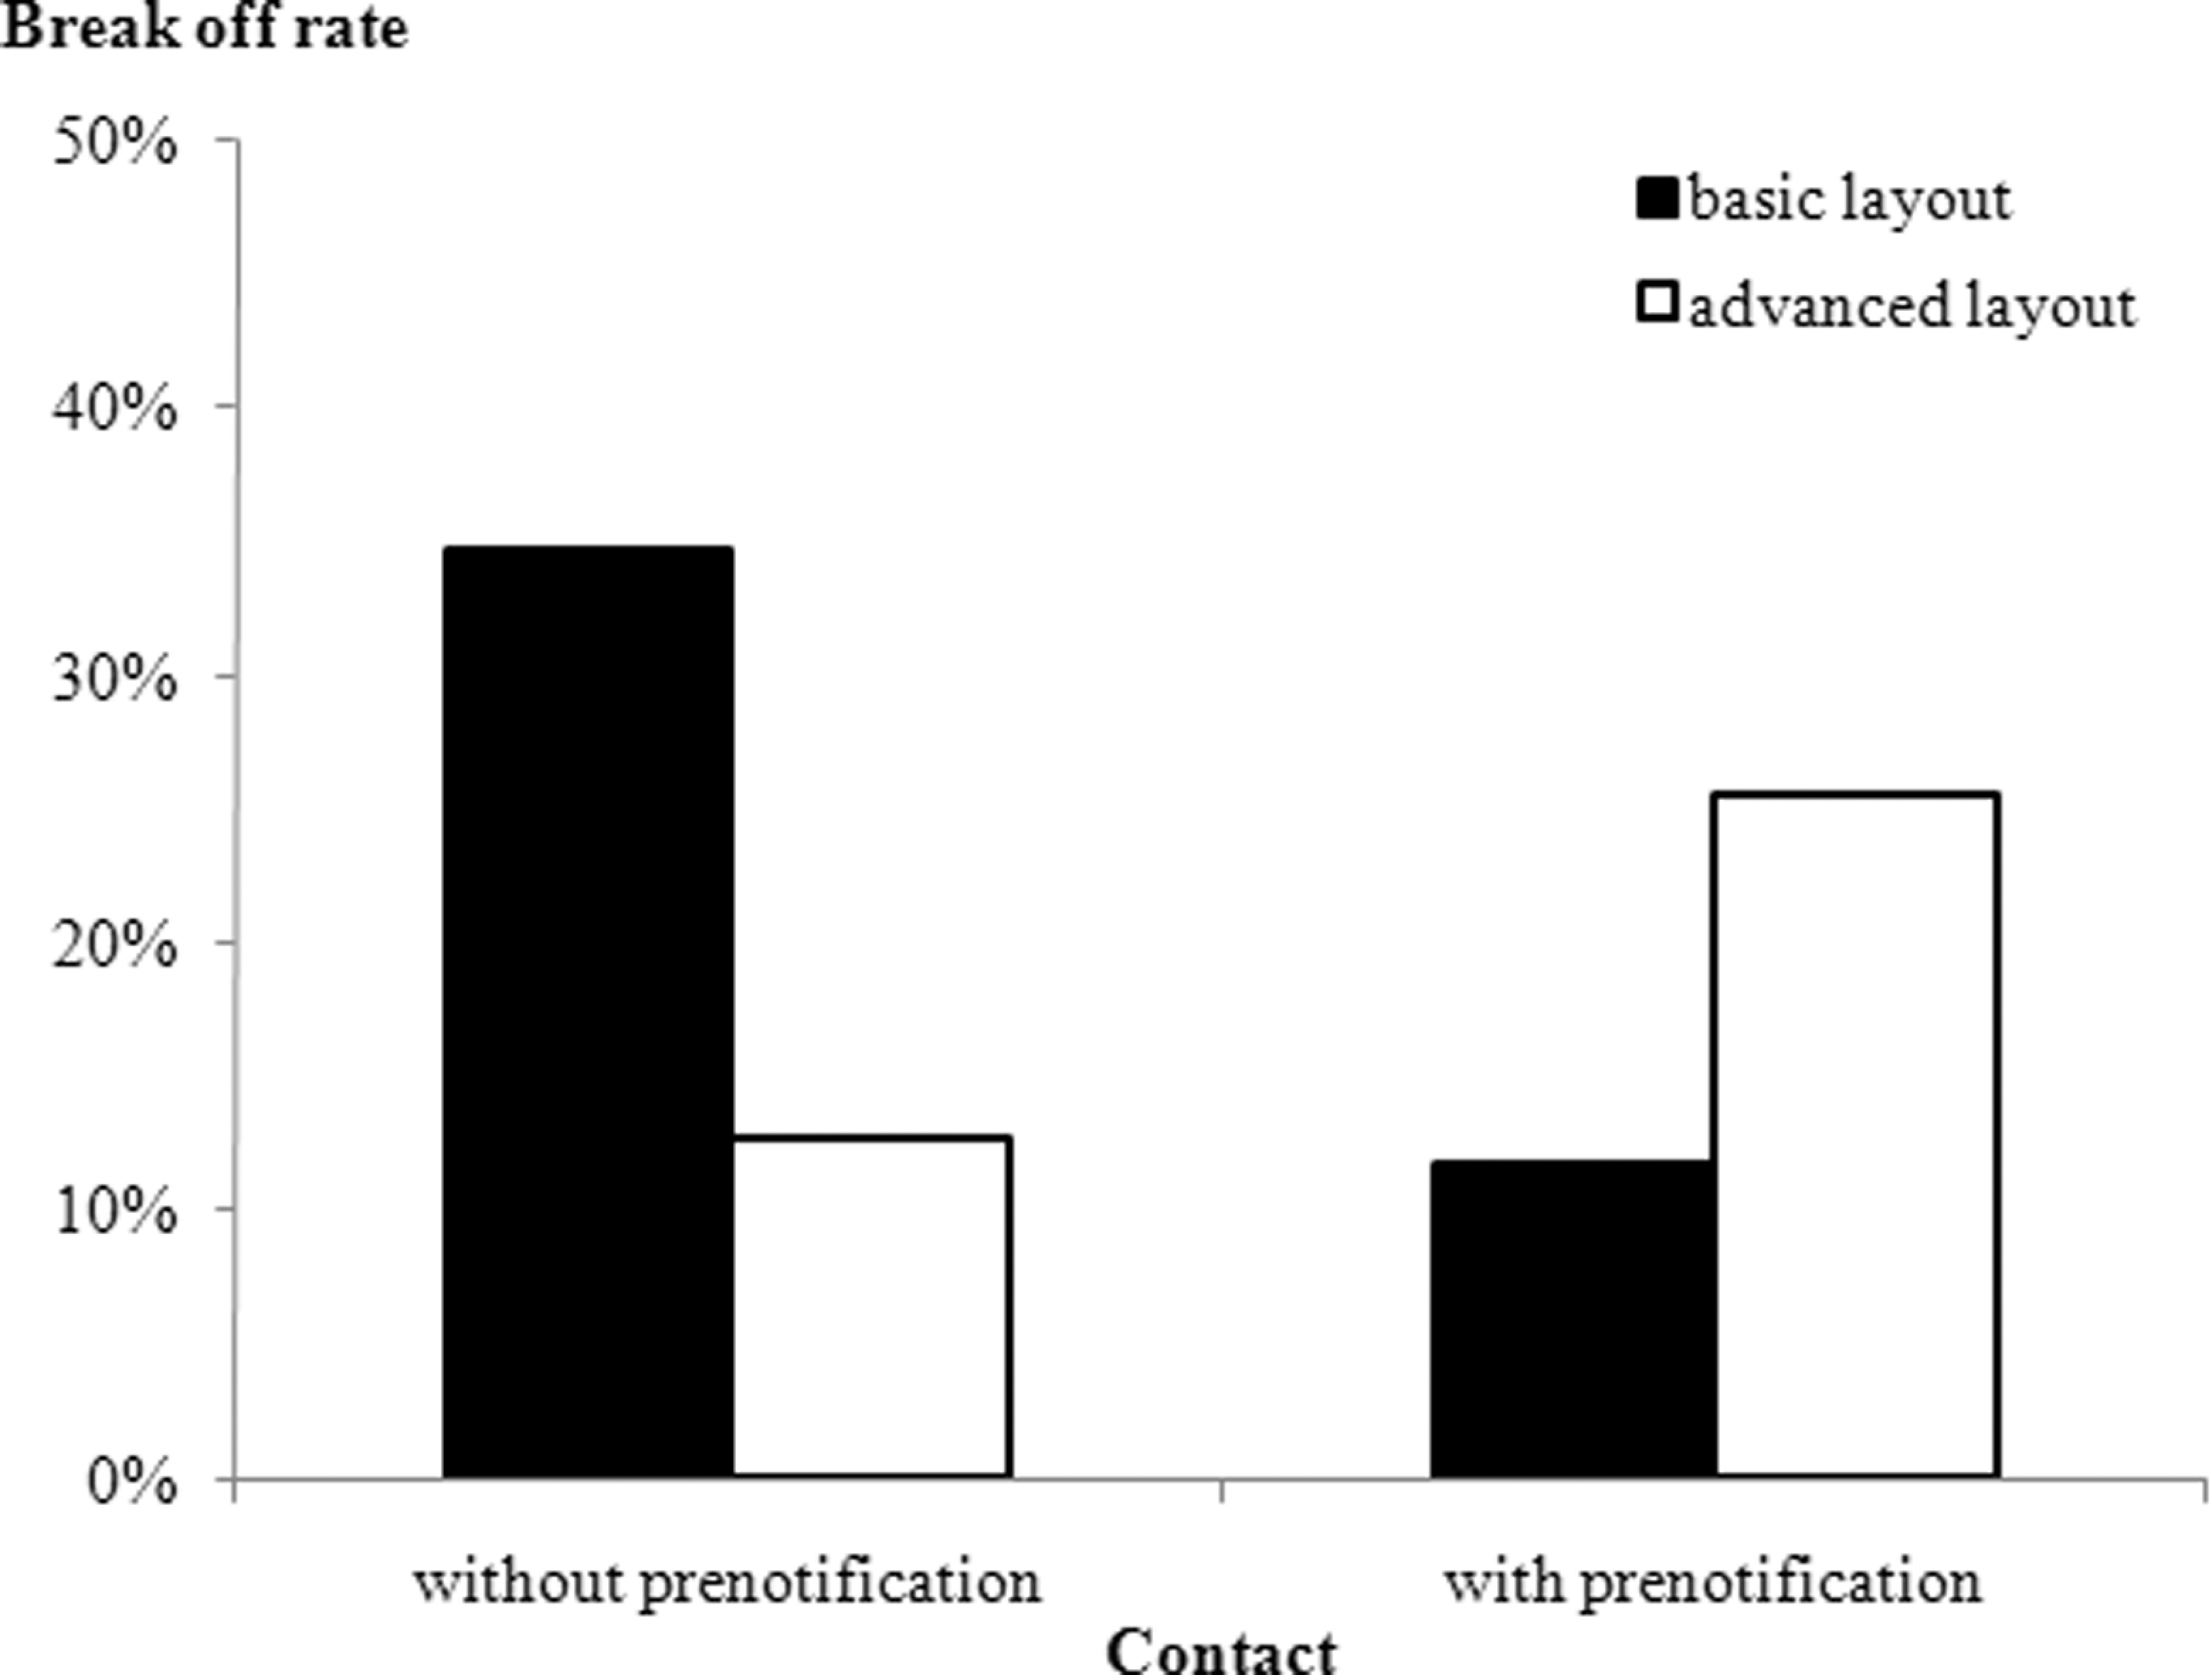
Break-off Rate - Interaction Between Contact and Layout
Discussion
Although the current study is limited by the very specific nature of the population, the findings of the large-scale experiment bear numerous interesting implications that should remind web survey designers that a dynamic, truly tailored design will yield the best result.
Confirming Hypothesis 1 and thereby extending the research on gender-related participation behavior in web surveys initiated by Althoff et al. (2006), the results show that contacting potential respondents in a male-dominated population from a female researcher’s e-mail account increased the overall response rate by 5.7 percentage points.
Nowadays, e-mail accounts usually overflow every day with tens or even hundreds of electronic messages from various senders containing a broad range of requests. Recipients can cope with this glut of information by implementing technical solutions like spam filters or firewalls; and there is also another type of filter at work: Recipients usually decide within only 3 s whether an e-mail message is interesting and therefore worth opening, or can be deleted without reading (MacElroy, 2003). Most e-mail clients restrict the information recipients can see in advance to the sender’s name along with the subject line of the message and the date of receipt. In male-dominated target populations, the survey invitation coming from a female researcher might therefore be helpful in attracting more respondents.
With regard to the number of contacts, the results of the experiment also show strong support for Hypothesis 2. Sending a short prenotification message increases the total response rate by the same amount over no prenotification, as does using a female sender over a male sender. The results of this study also verify whether the information provided in advance influences the decision to finish the entire web questionnaire, as the pre-contacted individuals broke off the survey to some lesser degree than individuals who received just the standard invitation.
Although the study confirms that sending out prenotification e-mails to members of list-based samples has a positive effect on web survey participation, this result does not imply that a higher number of contacts necessarily means more respondents: Sample members might consider more than three contacts (prenotification, invitation, and reminder) as spamming, which could therefore not only lead to diminishing returns but even runs the risk of damaging the survey sponsor’s image.
Finally, the results of the experiment do not support Hypothesis 3. No difference in the total response rate can be found for the two questionnaire layout versions. However, respondents receiving a questionnaire with a professionally designed layout were less likely to break off the survey than those assigned to the basic layout. Additionally, the advanced layout reduces the break off rate by more than 20 percentage points among individuals who had not received a prenotification message.
As the number of web surveys is rapidly growing, survey researchers have to clearly set their work apart from low-quality providers. Without a doubt, the first step of differentiation must always be the design of a respondent-friendly questionnaire that obeys the basic principles of survey research methodology with regard to question structure and wording, answer categories, scale selection, respondents’ guidance, and so on. The results of this study indicate that enhancing the visual appearance of the questionnaire is not only a way of demonstrating professionalism but also of showing respondents that the researcher has put a considerable amount of thought, time, and probably money in preparing the web questionnaire. The respondent might interpret that as a sign of respect for her or his personal effort and evaluate research of this kind as more relevant.
Footnotes
Author's Note
The author acknowledges and is grateful for the help of Helmut Kurz and Peter Penzkofer, Institute for Advertising and Marketing Research, WU, in conducting the field experiment. Comments by Thomas Reutterer, Institute for Retailing & Marketing, WU, and Alexander Zauner, Institute for Marketing Management, WU, as well as two anonymous reviewers on earlier drafts were extremely helpful in revising the paper.
Declaration of Conflicting Interests
The author declared no conflicts of interest with respect to the authorship and/or publication of this article.
Funding
The author received no financial support for the research and/or authorship of this article