
Abstract
The present article advances a joystick-based methodology for recording and studying time-dependent patterns as continuous phenomena. It is particularly useful for capturing moment-to-moment changes with regard to a state space defined by two orthogonal axes, as in studies involving the interpersonal circumplex or the mood circumplex. A joystick monitoring program (free, downloadable, executable software available at www.wlu.ca/science/psadler) is used. While watching a recorded interaction displayed on the computer screen, an observer moves the joystick to indicate a target person’s moment-to-moment behavior, and the X–Y coordinates are written frequently (e.g., twice per second) to a data file. The authors describe the software and the nature of the data obtained. The authors also suggest possible applications, such as studying subtle patterns of interpersonal behavior during interactions and studying individual differences in the perception of moment-to-moment variations in a target person’s affect.
Keywords
In psychology, many processes unfold over time, yielding variables with important time-dependent patterns. For example, if we observe two people interacting, we see ebb and flow over time in the behaviors of both partners. The present article advances a new methodology for recording and studying these time-dependent patterns as reasonably continuous phenomena.
To deal with fluctuations over time in behavior, researchers have often used either of two strategies. A relatively macroscopic approach is to take the average of the values of a variable across some period of time, thus characterizing the variable in terms of an overall level. Another, more microscopic approach is to segment the stream of behavior into discrete acts and characterize a variable in terms of its separate level for each such act.
A shortcoming of both these approaches is that they do not capture the continuous, fluid nature of many processes across time. For example, we may be interested in examining important rhythmic patterns in behavior that become entrained across partners, reflecting recurrent cycles of moment-to-moment adjustments in behavior (Sadler, Ethier, Gunn, Duong, & Woody, 2009; Sadler, Ethier, & Woody, 2011). For such purposes, we need a technique for capturing ongoing, moment-to-moment changes in behavior as reasonably continuous phenomena over time.
An important previous example of such a technique is the rating dial used by Hawkins, Carrère, and Gottman (2002). These researchers had married couples use a rating dial to record their continuous perceptions of their own affect and the affect of their spouse on a continuum from very negative to very positive. As other examples, Sheehan and McConkey (1982) used a rating dial to study participants’ subjective response during hypnotic suggestions, and Freeman and Ambady (2010) used a computer mouse to study mental processes in response to cognitive tasks.
Using such a technique yields a continuous, across-time trajectory for a single dimension of interest. However, there are some measurement applications for which it is advantageous to make continuous ratings of two dimensions simultaneously. These are measurements for which the relevant state space is a Cartesian plane.
To illustrate with regard to social behavior, interpersonal theory (Kiesler, 1996) proposes that much of the most important variation in interpersonal style occurs along two underlying, orthogonal dimensions: dominance versus submissiveness and affiliation versus hostility. The richness of this two-dimensional scheme is that a wide spectrum of distinguishable interpersonal styles, representing combinations of respective levels of the two defining axes, forms a circular structure, called the interpersonal circumplex. Kiesler (1983) identified 16 distinct interpersonal styles comprising this circular structure, whereas other researchers have advanced a coarser set of types, such as Wiggins’ (1982) octants. These categories of interpersonal style, whether finely or coarsely distinguished, have fuzzy boundaries and grade continuously into one another, in the same sense that discrete colors represent selections from a continuous spectrum of hues.
Moreover, Wiggins (1982, 2003) pointed out that these interpersonal styles (whether 8 or 16) represent a circularly structured set of prototypes or cognitive reference points for person perception (Rosch, 1975) and their use for processing social information typifies both laypeople and professionals (such as clinical psychologists and psychiatrists). Thus, rather than introducing unnecessary complexity, use of the Cartesian plane, encompassing both major axes at once, captures the natural circular structure of interpersonal perceptions and represents an intuitively appropriate representation for organizing and recording such ratings.
Accordingly, the present article advances a computer-joystick-based technique by which raters can continuously monitor interpersonal behavior as positions in the plane defined by the orthogonal axes of dominance and affiliation. The radial position with respect to the origin represents the type of interpersonal behavior (the position around the interpersonal circumplex), and the distance from the origin represents the intensity of that behavior. Thus, movements in the joystick position readily capture moment-to-moment changes in the observed type of behavior and its intensity.
There are many other measurement applications that may lend themselves to this two-dimensional rating technique. For example, mood also forms a continuous circumplex around two basic axes. Diverse other variables, too, have an inherently circular structure—for example, the position of the upper arm relative to the shoulder.
Tracking the Interpersonal Circumplex With a Computer Joystick
Using a computer joystick to capture a person’s moment-to-moment interpersonal behavior requires appropriate software. Hence, we developed a joystick monitoring program (executable software) that runs on Microsoft Windows XP, Windows Vista, and Windows 7 operating systems. The particular joystick we have used in our lab is the Microsoft Sidewinder Force Feedback 2; however, the software is also compatible with other Microsoft supported joystick devices (e.g., the Logitech Extreme 3D Pro Joystick).
As shown in Figure 1, the assessment technique involves watching a video of an interaction on a computer screen and rating a target person’s behavior (such as the behavior of the male in the video) using the computer joystick. As the observer watches the video, he or she can also monitor, in the small plot at the lower right corner of the screen, where the current joystick rating lies in the interpersonal plane.
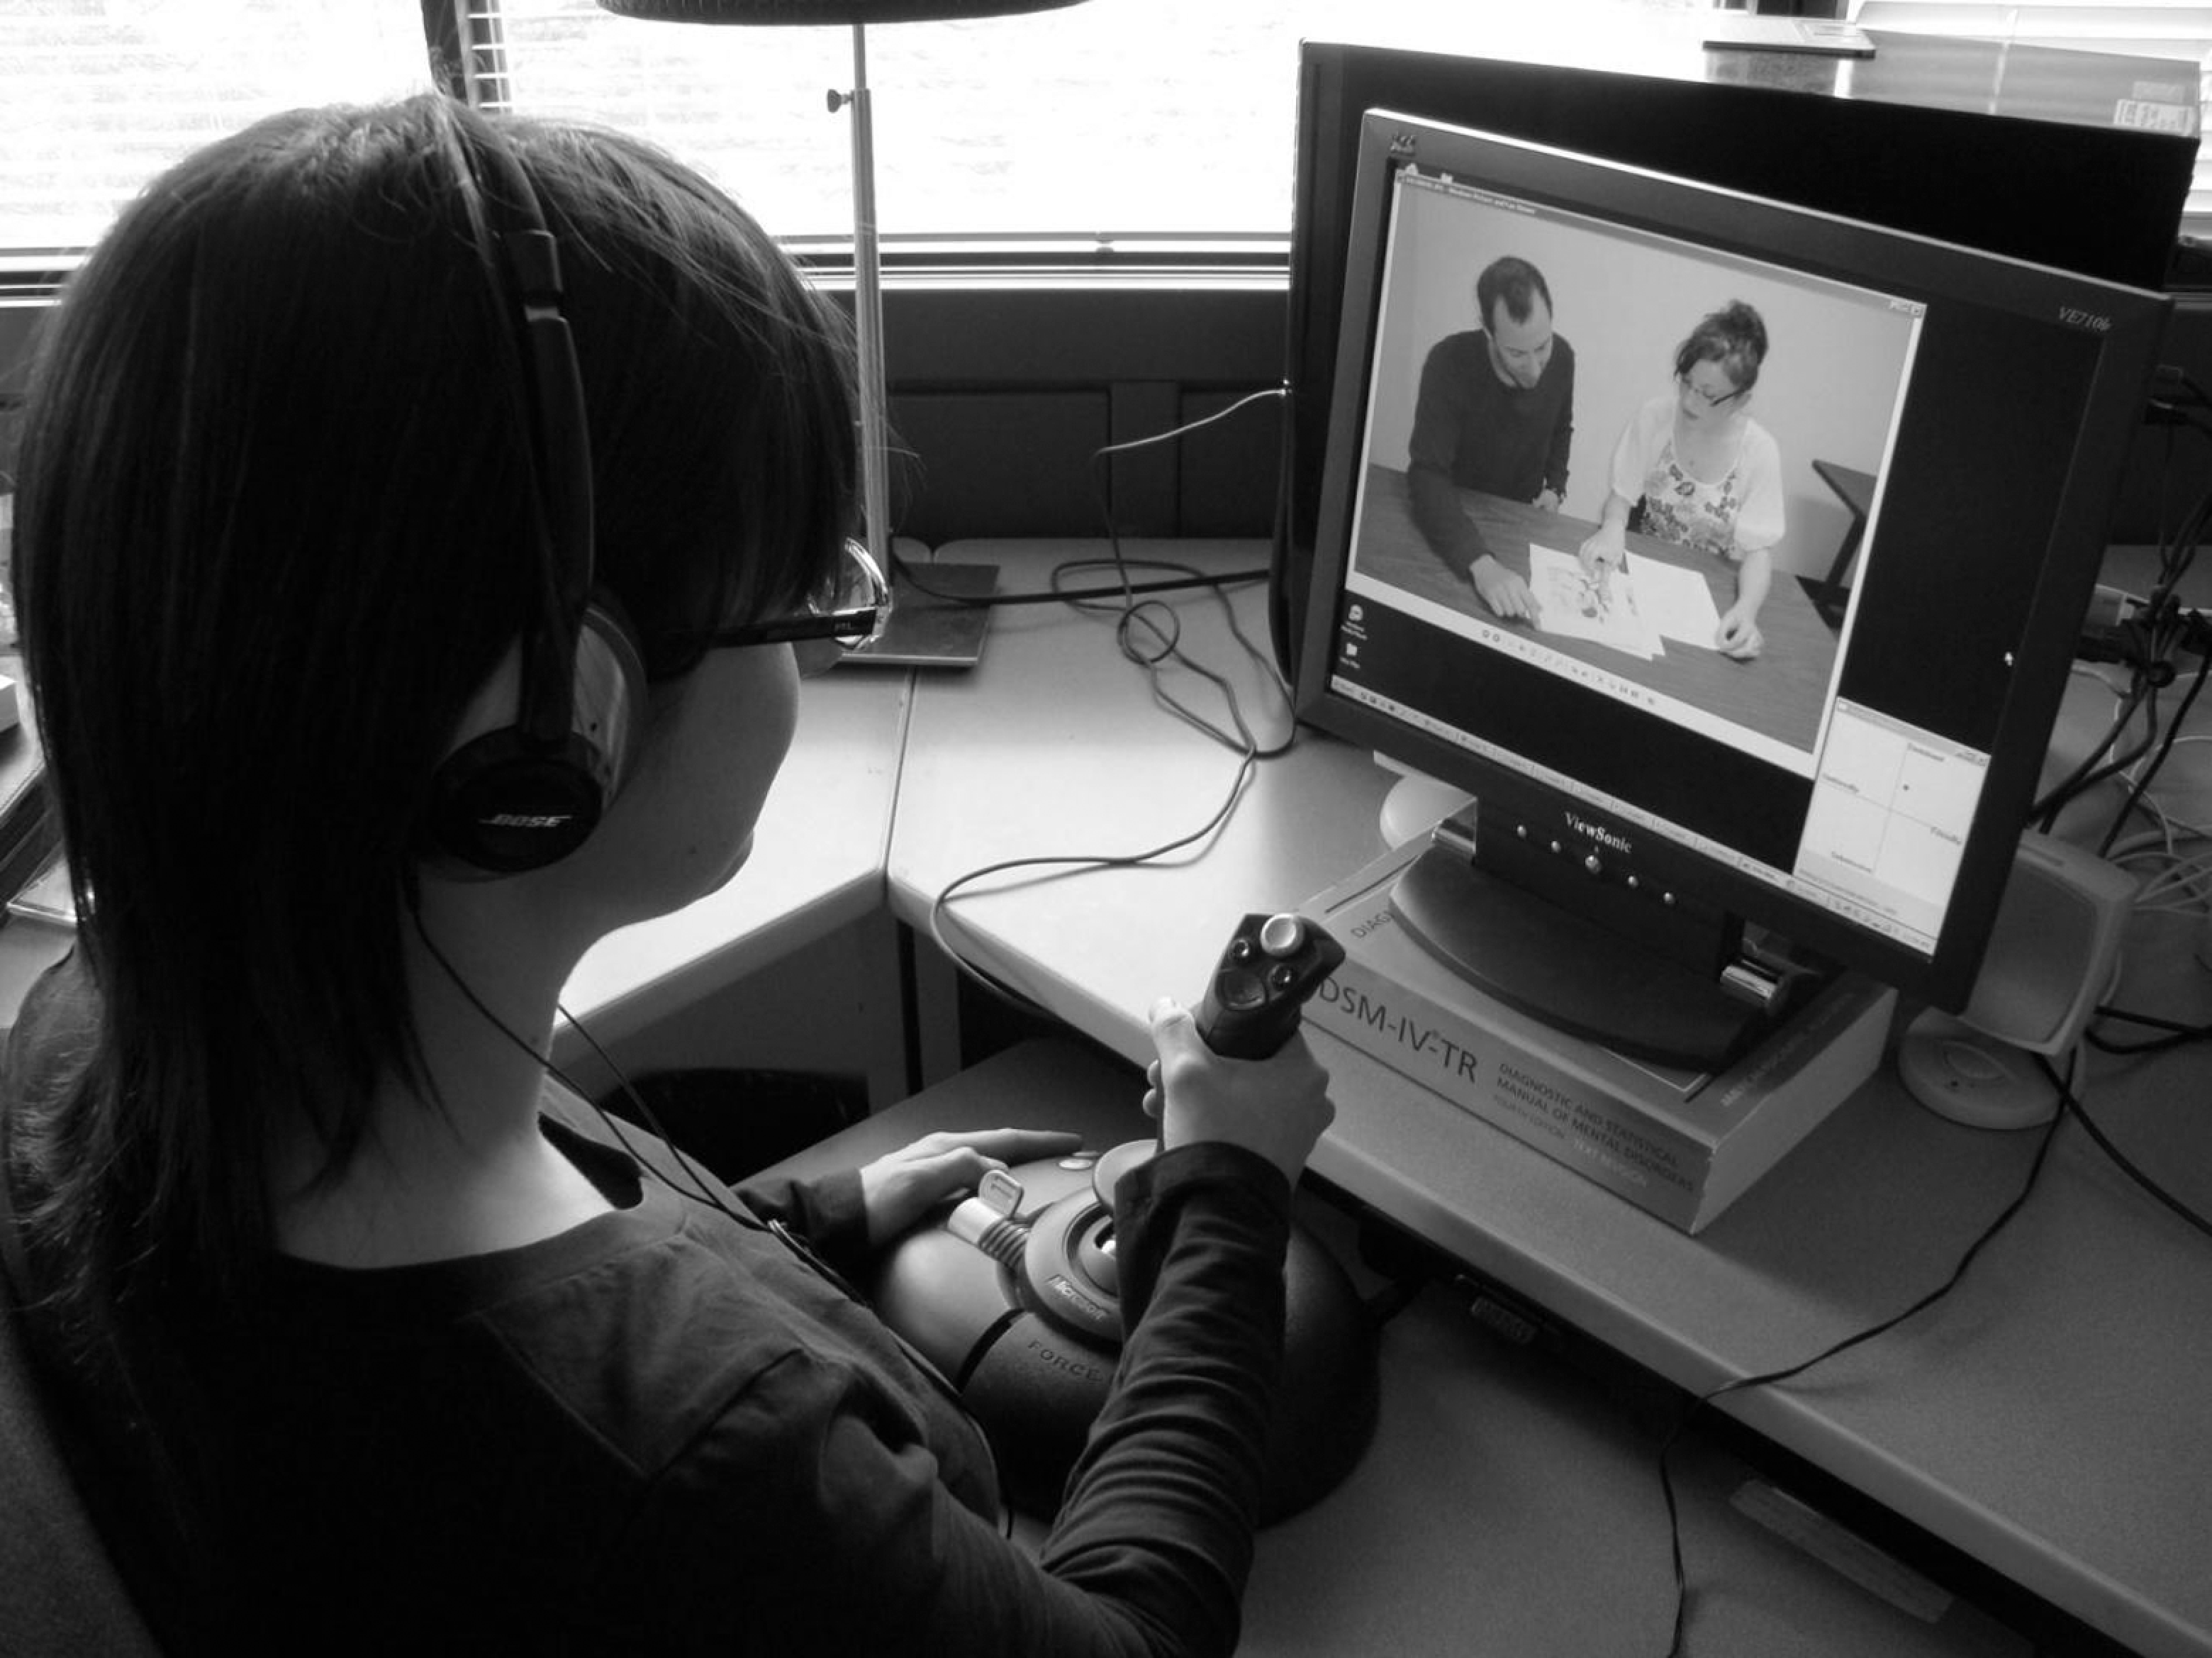
Computer-joystick apparatus. An observer watches a social interaction on the computer screen and simultaneously uses a computer-joystick apparatus to assess the moment-to-moment behavior of one of the interactants.
Figure 2 shows examples of this plot from the joystick monitoring program. The vertical dimension represents degrees of dominance, with the labels of dominant at the top and submissive at the bottom. The horizontal dimension represents degrees of affiliation, with the labels of friendly on the right and unfriendly on the left. Moving the joystick forward or backward represents changes in dominance, whereas moving the joystick to the right or left represents changes in friendliness. Once coding begins, a red dot within the interpersonal plane indicates the current (X, Y) position of the joystick. Additional feedback to help orient the rater comes from the “force feedback” feature of the joystick we use in our lab. Specifically, as the joystick is moved further away from the origin, it pushes more against the rater’s hand, providing tactile feedback about the joystick position. During coding, the joystick monitoring program records the joystick (X, Y) position frequently (e.g., twice per second) to a data file.
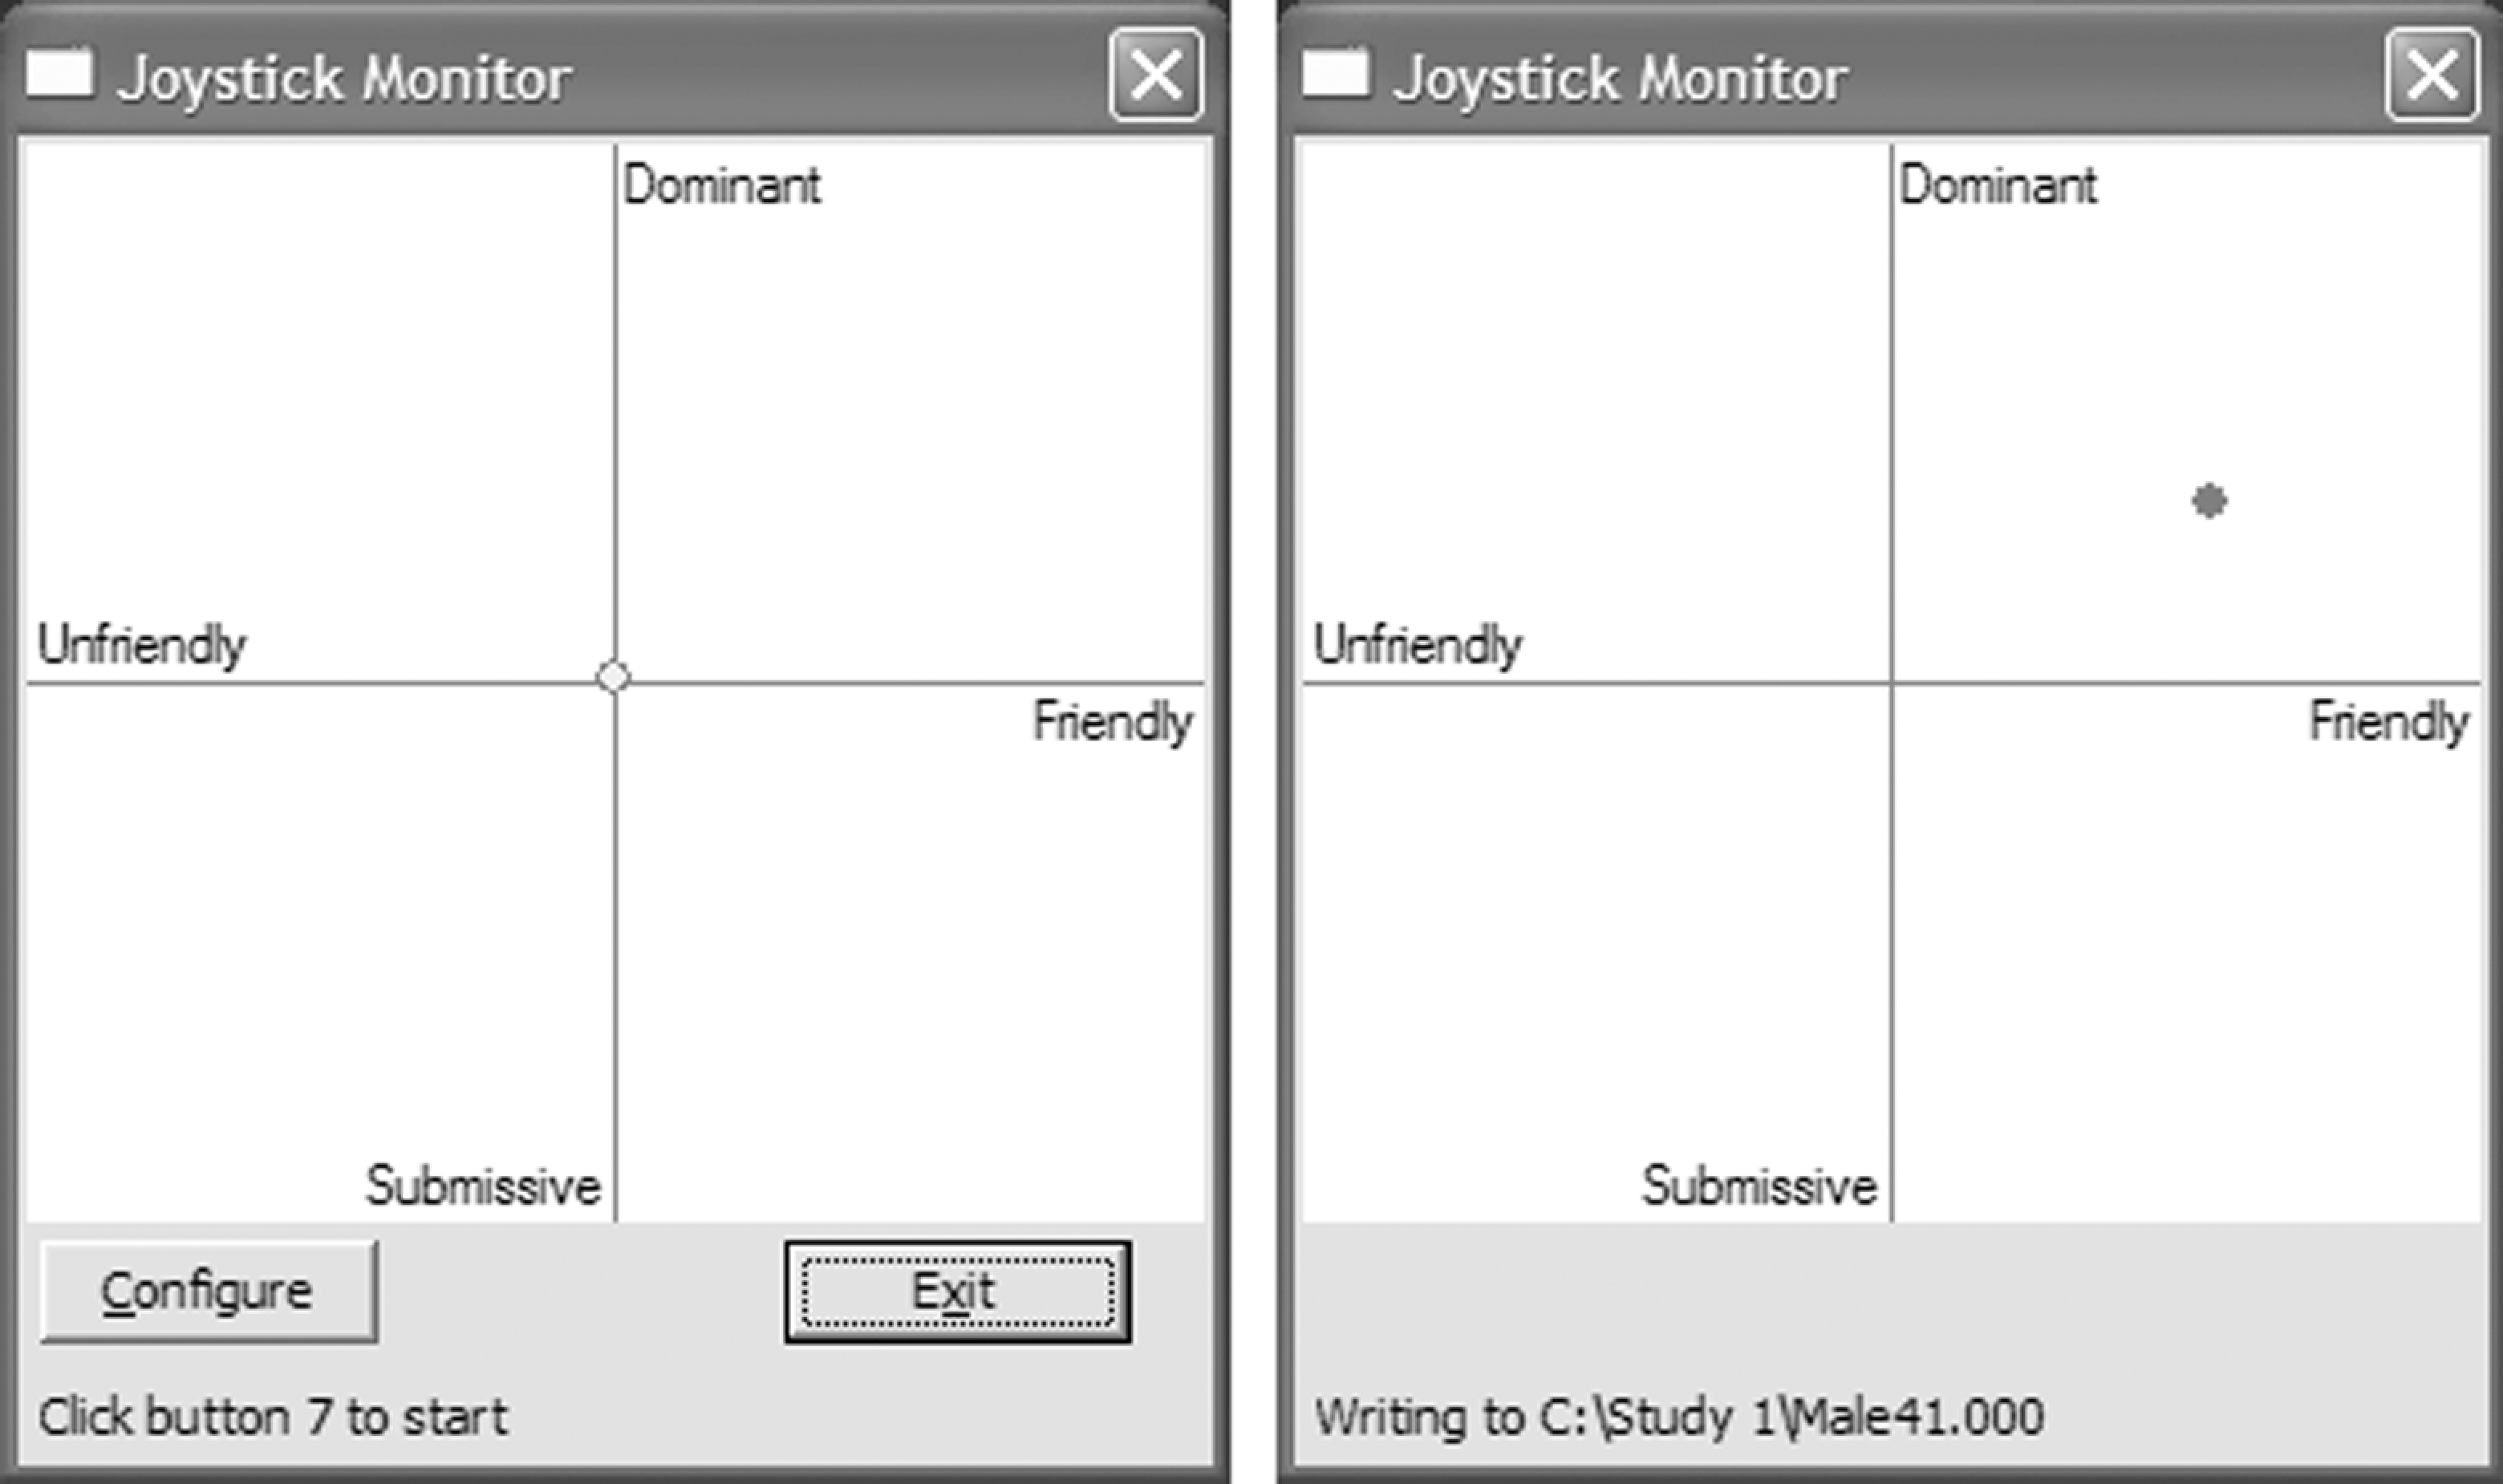
Joystick monitoring program interface displaying interpersonal Cartesian plane before data collection begins (on left) and during data collection (on right).
Installation and Configurable Options in the Joystick Monitor Software Program
The joystick monitor executable program (joymon.exe) may be obtained at no charge by downloading it from a website (www.wlu.ca/science/psadler) or by contacting the authors of this article. A number of configurable options are available, which may be viewed by clicking the “configure” button (see the left panel of Figure 2) and then changed as desired to accommodate the particular research being conducted. Figure 3 shows these configurable options, with the settings we often use in our own lab. The options are described in detail in the relevant section of the website.
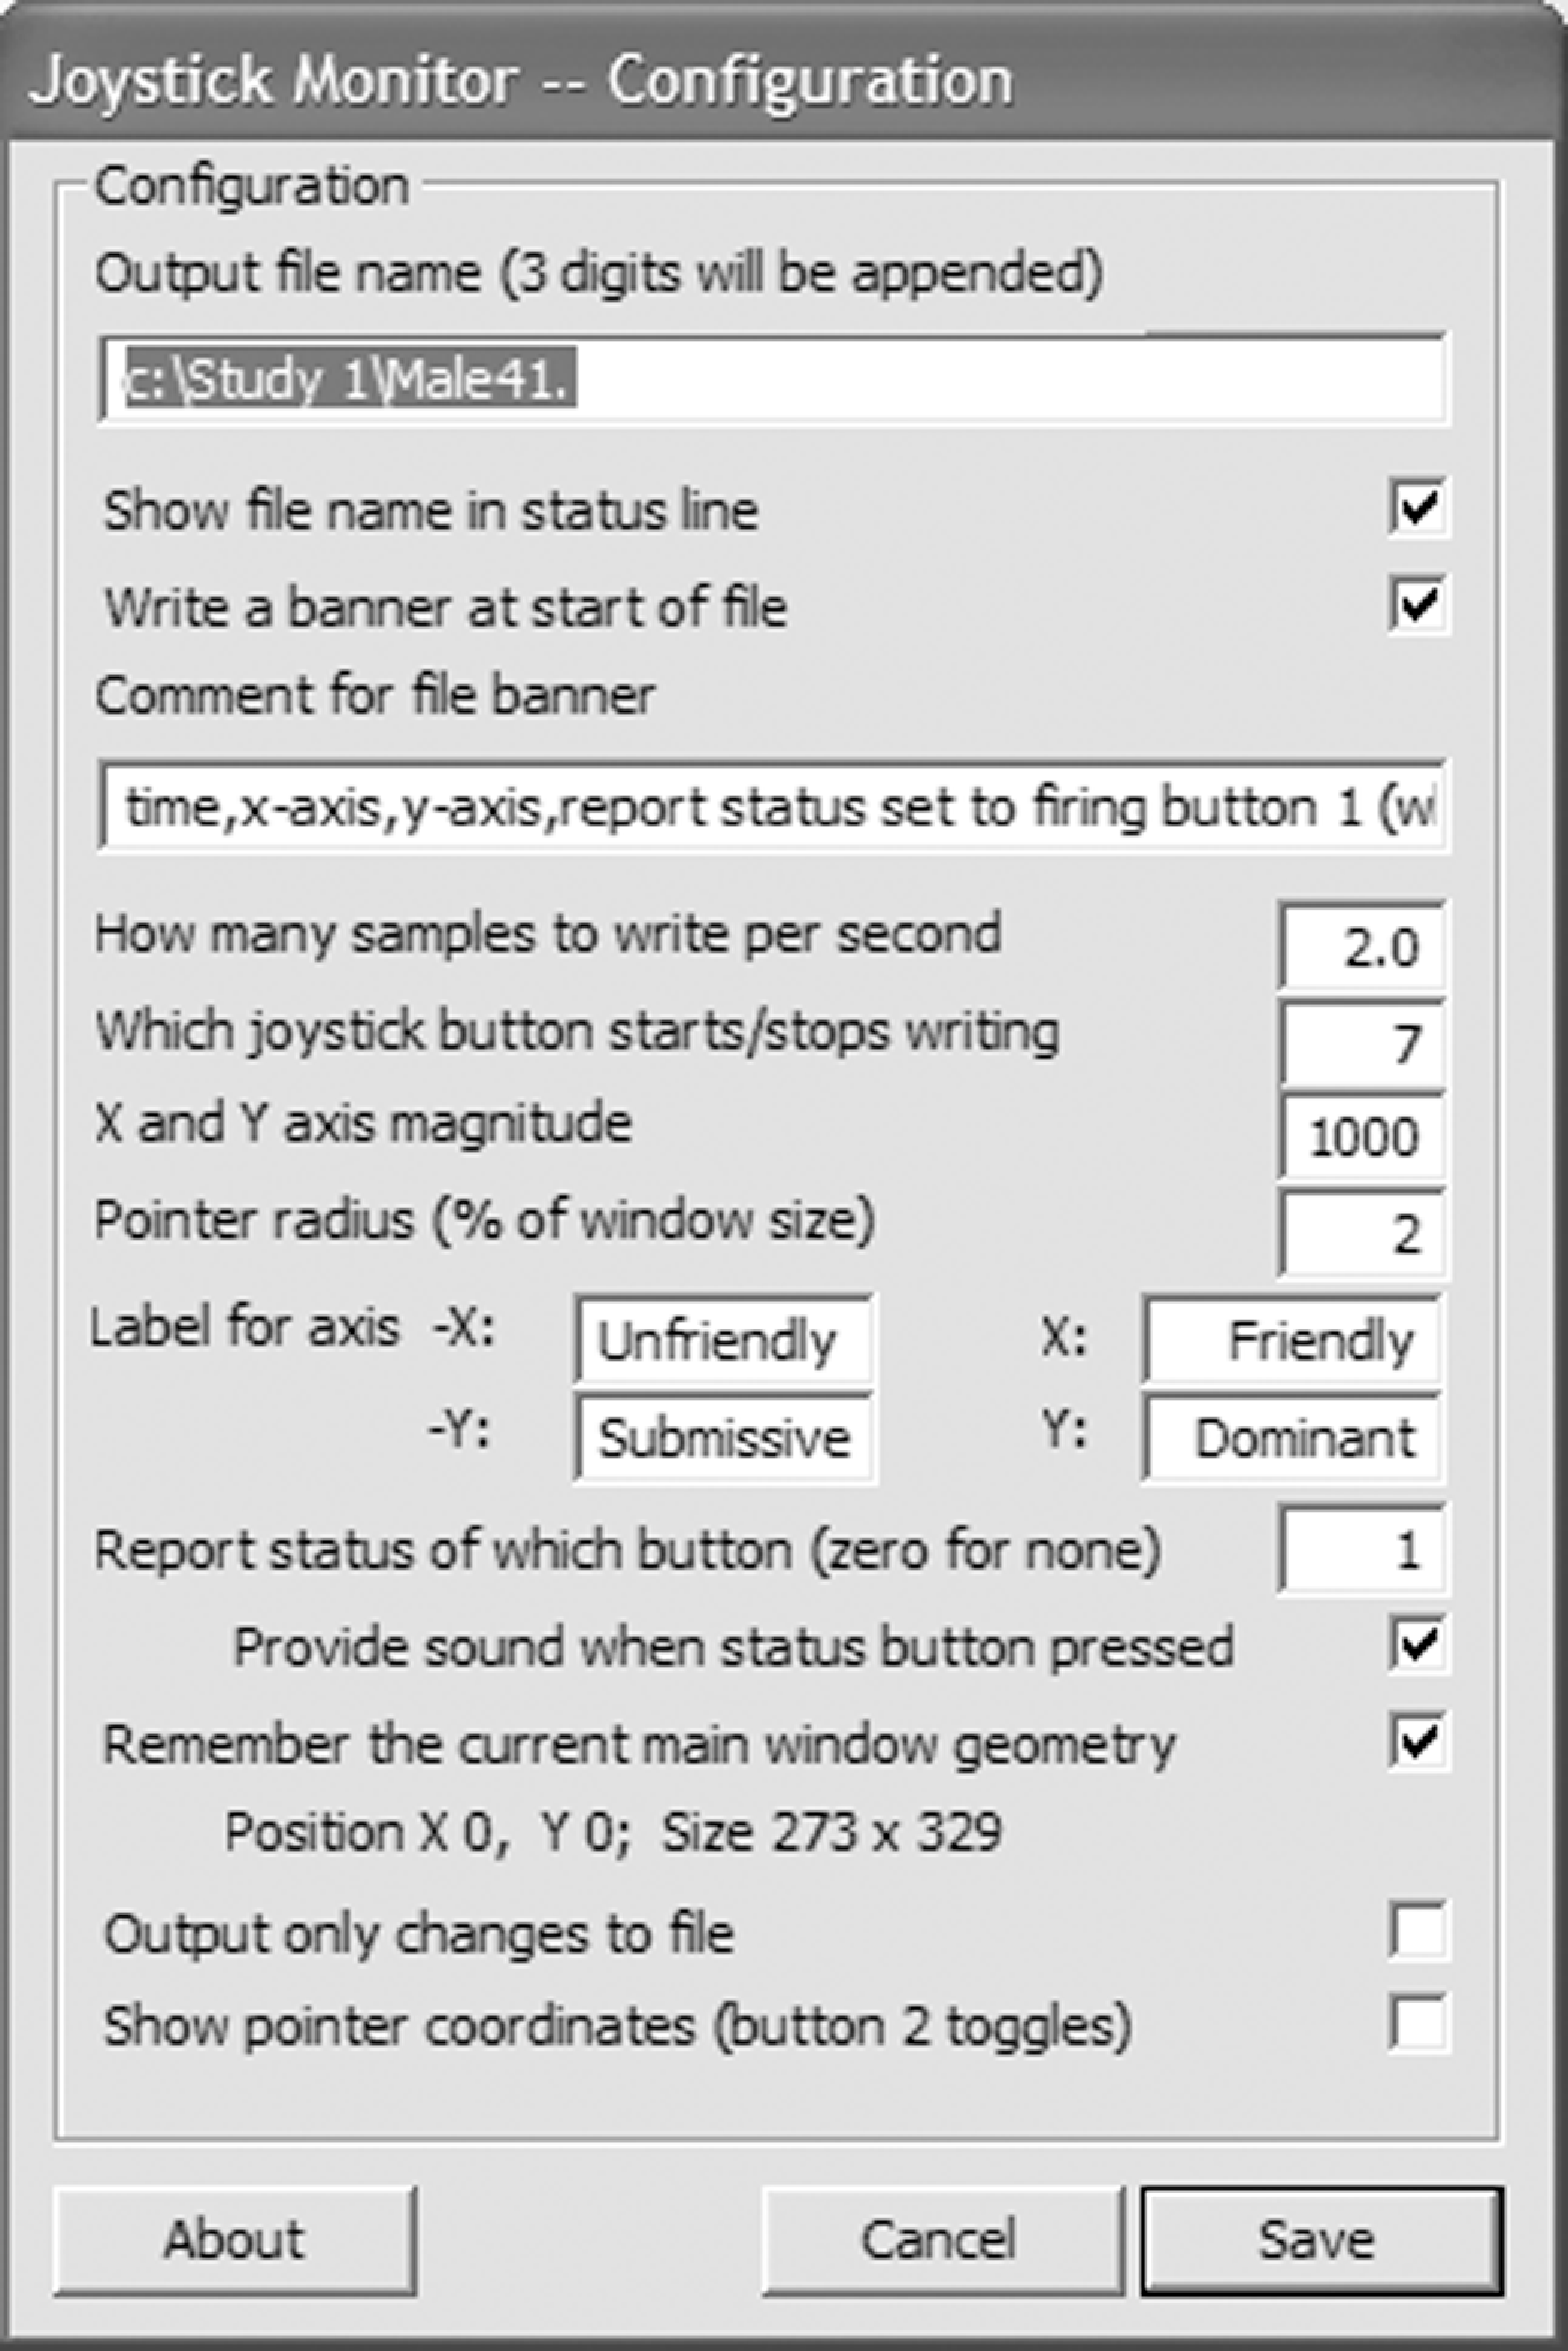
Configurable options in the joystick monitor program (located within Configure button).
Four of the options merit brief mention here. First, the user needs to specify the path structure and file name where the data will be saved (in the box below Output file name); this folder must exist already before data collection begins. Second, the researcher may determine the number of samples that are written to the data file per second. In our lab, we typically sample twice per second, because it is unlikely that observers could detect meaningful changes in interpersonal behavior at a faster rate than this. Third, the researcher may specify the labels for the axes to represent any desired pair of orthogonal dimensions of behavior or subjective experience (e.g., for emotion, valence, and arousal). Finally, there is an option (Report status of which button) to permit the use of a button on the joystick device to mark particular time points, such as major events or discontinuities. (Button 1 on the MS Sidewinder Force Feedback joystick is the firing button.) Each time the rater presses this button, a “1” is written into a “report status” column in the data file; otherwise, a “0” is written to this same column.
Application Issues
Types of Data for Which This Approach is Best Suited
The joystick-monitoring program is particularly well suited to applications in which researchers want to collect moment-to-moment information with regard to a two-dimensional state space. In our laboratory, we have primarily used this approach to capture people's interpersonal behavior as it unfolds over time during their interpersonal interactions. For capturing interpersonal behavior, such interactions should be relatively unscripted, so that interaction partners have ample opportunity to engage in some “give and take” during their time together, rather than enact more rigidly defined roles or scripts.
The duration of the source material to be joystick-coded is important to consider. The required duration will likely depend on the types of data analyses that the researcher plans to conduct, for how long observers can be expected to reliably and validly code, and the particular types of content that the researcher wants to capture. For time-series analyses that involve investigating cycles (e.g., Sadler et al., 2009), it is important that there be sufficient time in the interaction for the longest cycles to repeat 3 to 5 times (Warner, 1998). The longest cycles in the interpersonal behavior work we have completed have been about 3 min in duration; therefore, a 10-min timeframe is probably about the shortest that is adequate for this type of application.
Collecting Data and Accessing Data Files
After all the configurable options have been set as desired, the rater pushes the start button on the joystick (e.g., Button 7), and the program begins recording the current position of the joystick. When the rater stops recording (e.g., pressing Button 7 twice), the newly created file appears in the previously specified folder location as a comma-delimited data file. To view a data file, the file extension needs to be changed either to .csv (indicating that the data are a comma-separated-value file) or to .txt (indicating that it is a text file).
The data file contains at least three columns of data, with each row indicating the time in the first column, the X-axis position in the second column, and the Y-axis position in the third column. If the Report status option has been selected, there will also be a fourth column of data consisting of zeros and ones, the latter for the time points when the status button (e.g., the firing button) was pressed.
The Nature of the Data Yielded by the Technique
Here we present a brief example of the type of data that can be collected using this approach. The data were 10-min segments of the videotaped interactions of 50 previously unacquainted male–female dyads working together on an assigned task (Sadler et al., 2009). Carefully trained observers used the computer joystick to provide continuous, moment-to-moment assessments of each target person’s behavior (with dominance and affiliation as the axes) throughout the course of the interaction. (Each partner in an interaction was rated separately and nonconsecutively.) The moment-to-moment ratings of four observers were aggregated by computing the average at each time point. By averaging across multiple observers, the idiosyncrasies of the individual raters tend to cancel out, leaving a truer picture of the underlying interaction. The resulting data from each dyad yielded two key bivariate time series: one for the partners’ levels of affiliation over time and another for the partners’ levels of dominance over time.
The graphs in Figure 4 show an example of these time series for one dyad. In the top graph, the bivariate time series relating the partners’ moment-to-moment levels of affiliation across the 10 min of interaction shows an entrained cyclical pattern in which the peaks in the cycles of one person correspond with the peaks of the other person, and troughs correspond with troughs. In the bottom graph, the bivariate times series relating partners’ moment-to-moment levels of dominance also shows entrained cycles, but ones in which the peaks in the cycles of one person tend to correspond with the troughs in the corresponding cycles of the other person, and vice versa.

Affiliation behavior (top graph) and dominance behavior (bottom graph) over time for male (dashed line) and female (solid line) dyad members. Adapted with permission from Sadler et al. (2009).
Such patterns can be quantified by submitting the data to several types of time-series analysis, including spectral and cross-spectral analyses. For further details, see Sadler, Ethier, Gunn, Duong, and Woody (2009), Sadler, Ethier, and Woody (2011), and Warner (1998).
Timing and Rater-Training Issues
For most types of data analyses, it is essential that the timing of ratings be comparable across both targets and raters. If multiple computers will be used for coding, it is a good idea to conduct a series of timing tests before embarking on data collection. These preliminary trials can ensure that there are no awkward computer-to-computer timing issues across the computers to be used for the study.
To increase the reliability of the joystick technique, multiple raters (e.g., three or four) may be trained and employed for each study that involves the use of the joystick apparatus. In studies conducted in our laboratory using four raters (e.g., Sadler et al., 2009), we have obtained interrater reliabilities for moment-to-moment dominance and affiliation that vary from .60 to .77, and for mean overall level dominance and affiliation that vary from .78 to .92.
Before coding participants using the joystick apparatus, each rater in our lab is trained for approximately 8 hr on how to properly code behavioral data using the joystick apparatus. Details about our protocol for training observers are provided on the website mentioned earlier. Throughout the training, the trainer emphasizes that the joystick ratings are to be behaviorally anchored focusing on the target person’s moment-to-moment behavior, rather than simply reflecting observers’ general sense of how the interaction was progressing or any assumptions based on the partner’s behavior. Another important issue that arises during training is how to handle any short silences during the conversation which may occur at some point in the interaction. Coders are instructed to keep the joystick in approximately the same position during such pauses, unless the silence suggests a particular interpersonal stance or behavior (e.g., the target person appears to be waiting for their partner to take charge).
Conclusion
As mentioned earlier, the joystick method has been used effectively to study patterns of entrainment of interpersonal behaviors between interacting partners (Sadler et al., 2009). This work has shown that the data obtained with the joystick method lend themselves to analysis using time-series techniques, such as cross-correlations and cross-spectral analysis (Warner, 1998; see also Boker, Xu, Rotondo, & King, 2002). In addition, time-series indices derived from joystick data provide useful ways to quantify subtle interactional patterns and relate them to various outcomes. For example, Markey, Lowmaster, and Eichler (2010) used the joystick method to show that positive cross-correlations on affiliation predict faster completion times and higher quality work in a collaborative task.
The joystick method has also been used fruitfully to capture moment-to-moment variations in a person’s affect, using the mood circumplex (e.g., with valence and arousal as the underlying orthogonal dimensions). For example, Quek (2003) used cross-correlations to investigate culture-based individual differences in the accuracy of observers’ perceptions of a target person’s mood. Specifically, the moment-to-moment variation according to each observer was correlated with the target person’s self-rated moment-to-moment mood as the index of accuracy.
There are many other possible applications. Common to all of them is the capacity of the joystick method to yield measurement of psychological constructs as continuous processes over time. Boker (2002) argued that such continuous over-time measurement offers unique and important opportunities; for example, nonlinear dynamics models (Boker & Wenger, 2007) require such data. Hence, the joystick method, by facilitating a continuous representation of how behavior is patterned across time, opens doors for new discoveries.
Footnotes
Declaration of Conflicting Interests
The authors declared no potential conflicts of interest with respect to the research, authorship, and/or publication of this article.
Funding
The authors disclosed receipt of the following financial support for the research, authorship, and/or publication of this article: This research was supported by grants from the Social Sciences and Humanities Research Council and from Wilfrid Laurier University.