
Abstract
This pioneering study explores the convergence of social economic behavior in our new, hyperconnected world. In statistical tests, the correlation of Facebook brand page fan counts of the 30 most popular consumer brands and their respective brand company stock prices were found to be statistically significant, despite the general upward trend for fan counts and radically different stock price performances over a 12-month period. The results suggest that the social media popularity itself, as a construct for consumer following or public interest, may serve as some type of behavioral indicator of brand affinity, customer loyalty, or brand performance.
Introduction
Brand fan counts represent the number of consumers who join brand sites created by consumers themselves, or more often, are sponsored by consumer brand companies on social media networks. Consumers become “fans” 1 to read and post comments on the site, join loyalty programs, browse product information, and/or make purchases online (online social commerce).
If celebrity-like popularity increases economic opportunities for businesses (Rindova, Pollock, & Hayward, 2006), if consumers engage in online relationships with brands much as they form relationships with other people (Esch, Langner, Schmitt, & Geus, 2006), and if consumers feel that brands are part of them and that they are part of the brands (“brand tribalism,” Taute, Sierra, & Heiser, 2010), could fan counts of the most popular brands on social media networks, as a construct for consumer following, signal concurrent changes in brand performance and/or valuations of brand company stocks?
In an exploration of the growing convergence of social economic behavior of consumers in our new, hyperconnected world, this cross-disciplinary study explores the statistical relationship between the running daily total brand fan counts of 30 of the most popular brands on Facebook, the largest and perhaps most established social network (whereas Twitter has about 200 million users worldwide, Facebook has about 680 million users 2 )—as a construct for consumer following—with the closing daily stock prices of the consumer product companies that own these brands—as an indicator of social economic behavior. Unlike previous research that analyzed user-generated content or measured user activity for discerning consumer or investor mood/sentiment (most recently, Bollen, Mao, & Zeng, 2010), this nontheoretical study uniquely explores what popularity itself, or the daily number of brand fan counts, can reveal about social economic behavior.
Conceptual Framework and Model
The conceptual framework proposes that, given the inherent power of popularity to foster social conformity, enhanced by the opinion-influencing capacity of social media, daily fan counts for consumers following the most popular brands are associated with the stock prices of the consumer brand companies that own these brands, as shown in Figure 1.

Conceptual model of the relationship of social media popularity with performance.
The conceptual model further proposes that, given the more static nature of brand fan counts (relative to stock prices), the running daily total of fan counts either outpace or lag market values of stocks, creating timing differences by which their relationship or regression coefficient to prices may be positive or negative, but within a bounded range. The model also postulates that the fan count–stock price relationship is stronger for the most popular brands associated with smaller ticket and/or everyday impulse purchases, than that for the most popular brands associated with larger ticket, less frequent, and/or complex buying decisions.
Theoretical Development
If the economic benefits from popularity as a form of social capital accrue to individuals (Glaser, Laibson, & Sacerdote, 2002), this study asks, could brand social media popularity accrue to the economic benefit of consumer brand companies? That is, if popularity is a form of social influence, status, and/or power (Blau, 1964), could brand affinity or consumer following signal social economic behavior and brand performance? Could brand popularity or social following become a social norm by which peer pressure drives broader consumer adoption and/or conformity in buying behavior?
The Power of a Single Factor
While it may be more intuitive that variables based on the tone of the user-generated content to measure mood or intent, and/or frequency of postings to measure user activity and/or consumer engagement would have greater explanatory power in predicting behavior than simple measures of popularity, or sheer number of followers, studies using very sophisticated content analysis tools to measure investor sentiment have found a single or consolidated variable to be the lone statistically significant predictor of outcomes. In a 2010 study (Bollen et al., 2010) the tone of tweets, analyzed by using two mood tracing tools from large-scale Twitter feeds, were found, in one instance, to accurately predict the direction of the stock market in the days that followed. The study used (among other techniques) an algorithm developed by Google, the Google-Profile of Mood States, which measures six mood levels—happiness, kindness, alertness, sureness, vitality, and calmness—of user-generated on the Internet. From its analysis of 9.7 million tweets posted over 10 months in 2008 by 2.7 million twitter users, the results showed that only one mood (calmness) was predictive, with a 87.5% accuracy whether the market would close up or down between 2 and 6 days after a “calmness reading” was logged on Twitter. Similarly, in an analysis of the media coverage effect on investor sentiment and behavior, Tetlock (2007) used the General Inquirer (GI) quantitative content analysis program to analyze the words for each day of the “Abreast of the Market” column in the Wall Street Journal over a 16-year period from 1984 to 1999. Despite the robustness of the GI tool, with 77 predetermined sentiment categories from the Harvard psychosocial dictionary, changes in a single “pessimism” factor—a consolidation of all 77 categories related to pessimistic words in the newspaper column—was found to predict statistically significant and economically meaningful changes in the distribution of daily U.S. stock returns and volume.
Hypotheses and Methodology
The research proposes that as social media behavior online becomes increasingly intertwined and reflective of social economic behavior in the real world, brand fan counts for the most popular brands serve as a directionally mixed, imprecise but reliable indicator of their respective brand company stock price performance.
Hypothesis 1
The primary and main hypothesis is that fan counts for brands with the greatest social media follow reliably but loosely correlate with their respective brand company stock prices within a bounded range by either outpacing (negatively correlated) or lagging (positively correlated) market values. Regression coefficients for the market index are also expected to be both positive and negative, but within a far smaller range, a function of tracking error between the systemic market effects on the 30 brand company stock prices and those of the broader index used in the study (Dow Jones Industrial Average).
Hypothesis 1: Consumer following of the most popular brands is positively correlated with brand company stock behavior.
To test the first and primary hypothesis, 30 individual Pearson product movement correlations of 30 brands with the greatest consumer following on Facebook were conducted over a 12-month plus 1 day period, from June 1, 2010, to June 1, 2011. In addition, 30 separate regressions of stock prices as the dependent or criterion variable were conducted with the corresponding daily Facebook brand fan counts—as well as a market index as a control variable to capture the exogenous effects of equity market volatility.
Hypothesis 2
To explore the strength of the association of social media popularity with social economic behavior among types of popular brands and consumer decision making, the second hypothesis postulates that the relationship is stronger for brands generally involving with small ticket or impulse purchases versus brands associated with larger ticket, less frequent, and/or complex buying decisions.
Hypothesis 2: Consumer following of the most popular brands associated with small-ticket and/or impulse buys is more strongly correlated with their respective brand company stock prices than for brands associated with larger ticket, less frequent, and/or complex buying decisions.
For this analysis, the 30-brand sample will be divided into two groups, based on five sorting criteria, as shown in Figure 2.

Composition of brand Groups 1 and 2.
To normalize the data for the group analysis, fan counts, stock prices, and stock market variables were indexed, and the total averages computed for the two groups over the 12-month period. The results of the regression, along with the Pearson product movement correlation of the total average indexed values with the two-tailed test for significance over the 366 observations for Groups 1 and 2, were then compared.
The sample size was 366 observations (1 year plus 1 day), representing daily data from June 1, 2010, to June 1, 2011. To normalize and synchronize daily social media fan counts with daily stock prices, the closing stock prices for nontrading days such as weekends and holiday were repeated over these time periods to help comply with the fundamental requirement for time series studies that all observations be taken at regularly spaced internals. For the measure of social media popularity, this study used the fan counts of brands by Famecount.com. The list of the most popular brands on Famecount.com was adjusted to exclude brands owned by privately held companies. Daily stock price data on the three brands and market index (Dow Jones Industrial Index) were sourced from Yahoo finance. IBM’s PASW Statistics GradPack 18 was used to perform the statistical analyses.
Results
In the test of the first and primary hypothesis, Pearson product movement correlations of fan counts of the 30 most popular consumer brands and their respective brand company stock prices from June 1, 2010, to June 1, 2011, 26 were found to be statistically significant in two-tailed tests at the .01 level. In 19 of the 30 regressions of brand fan counts and stock prices—along with a market index to capture exogenous stock market volatility to better isolate the effects of popularity on nonmarket return (alpha)—both predictor variables were found to be statistically significant, despite the general upward bias of fan counts and radically different price performances over the 12-month period, with Krispy Kreme Doughnuts soaring 133.43% and Aeropostal falling 33.25%. The overall market index (Dow Jones Industrial Average) increased 22.61% during this period.
Consistent with the study’s conceptual model that fan counts either lag or outpace the market values of brand company stock prices, coefficients for both the predictor and the control variables were both positive and negative in the 30 regressions, with fan count coefficients within a bounded range of as much as ±8 (absolute average = 3.63 with σ = 4.28); coefficients of the market index variables also had mixed but much smaller variances (absolute average = 0.01 with σ = 0.03), presumably due to tracking error (see Table 1).
Summary Results of 30 Consumer Brand Correlations and Regressions from June 1, 2010, to June 1, 2011.
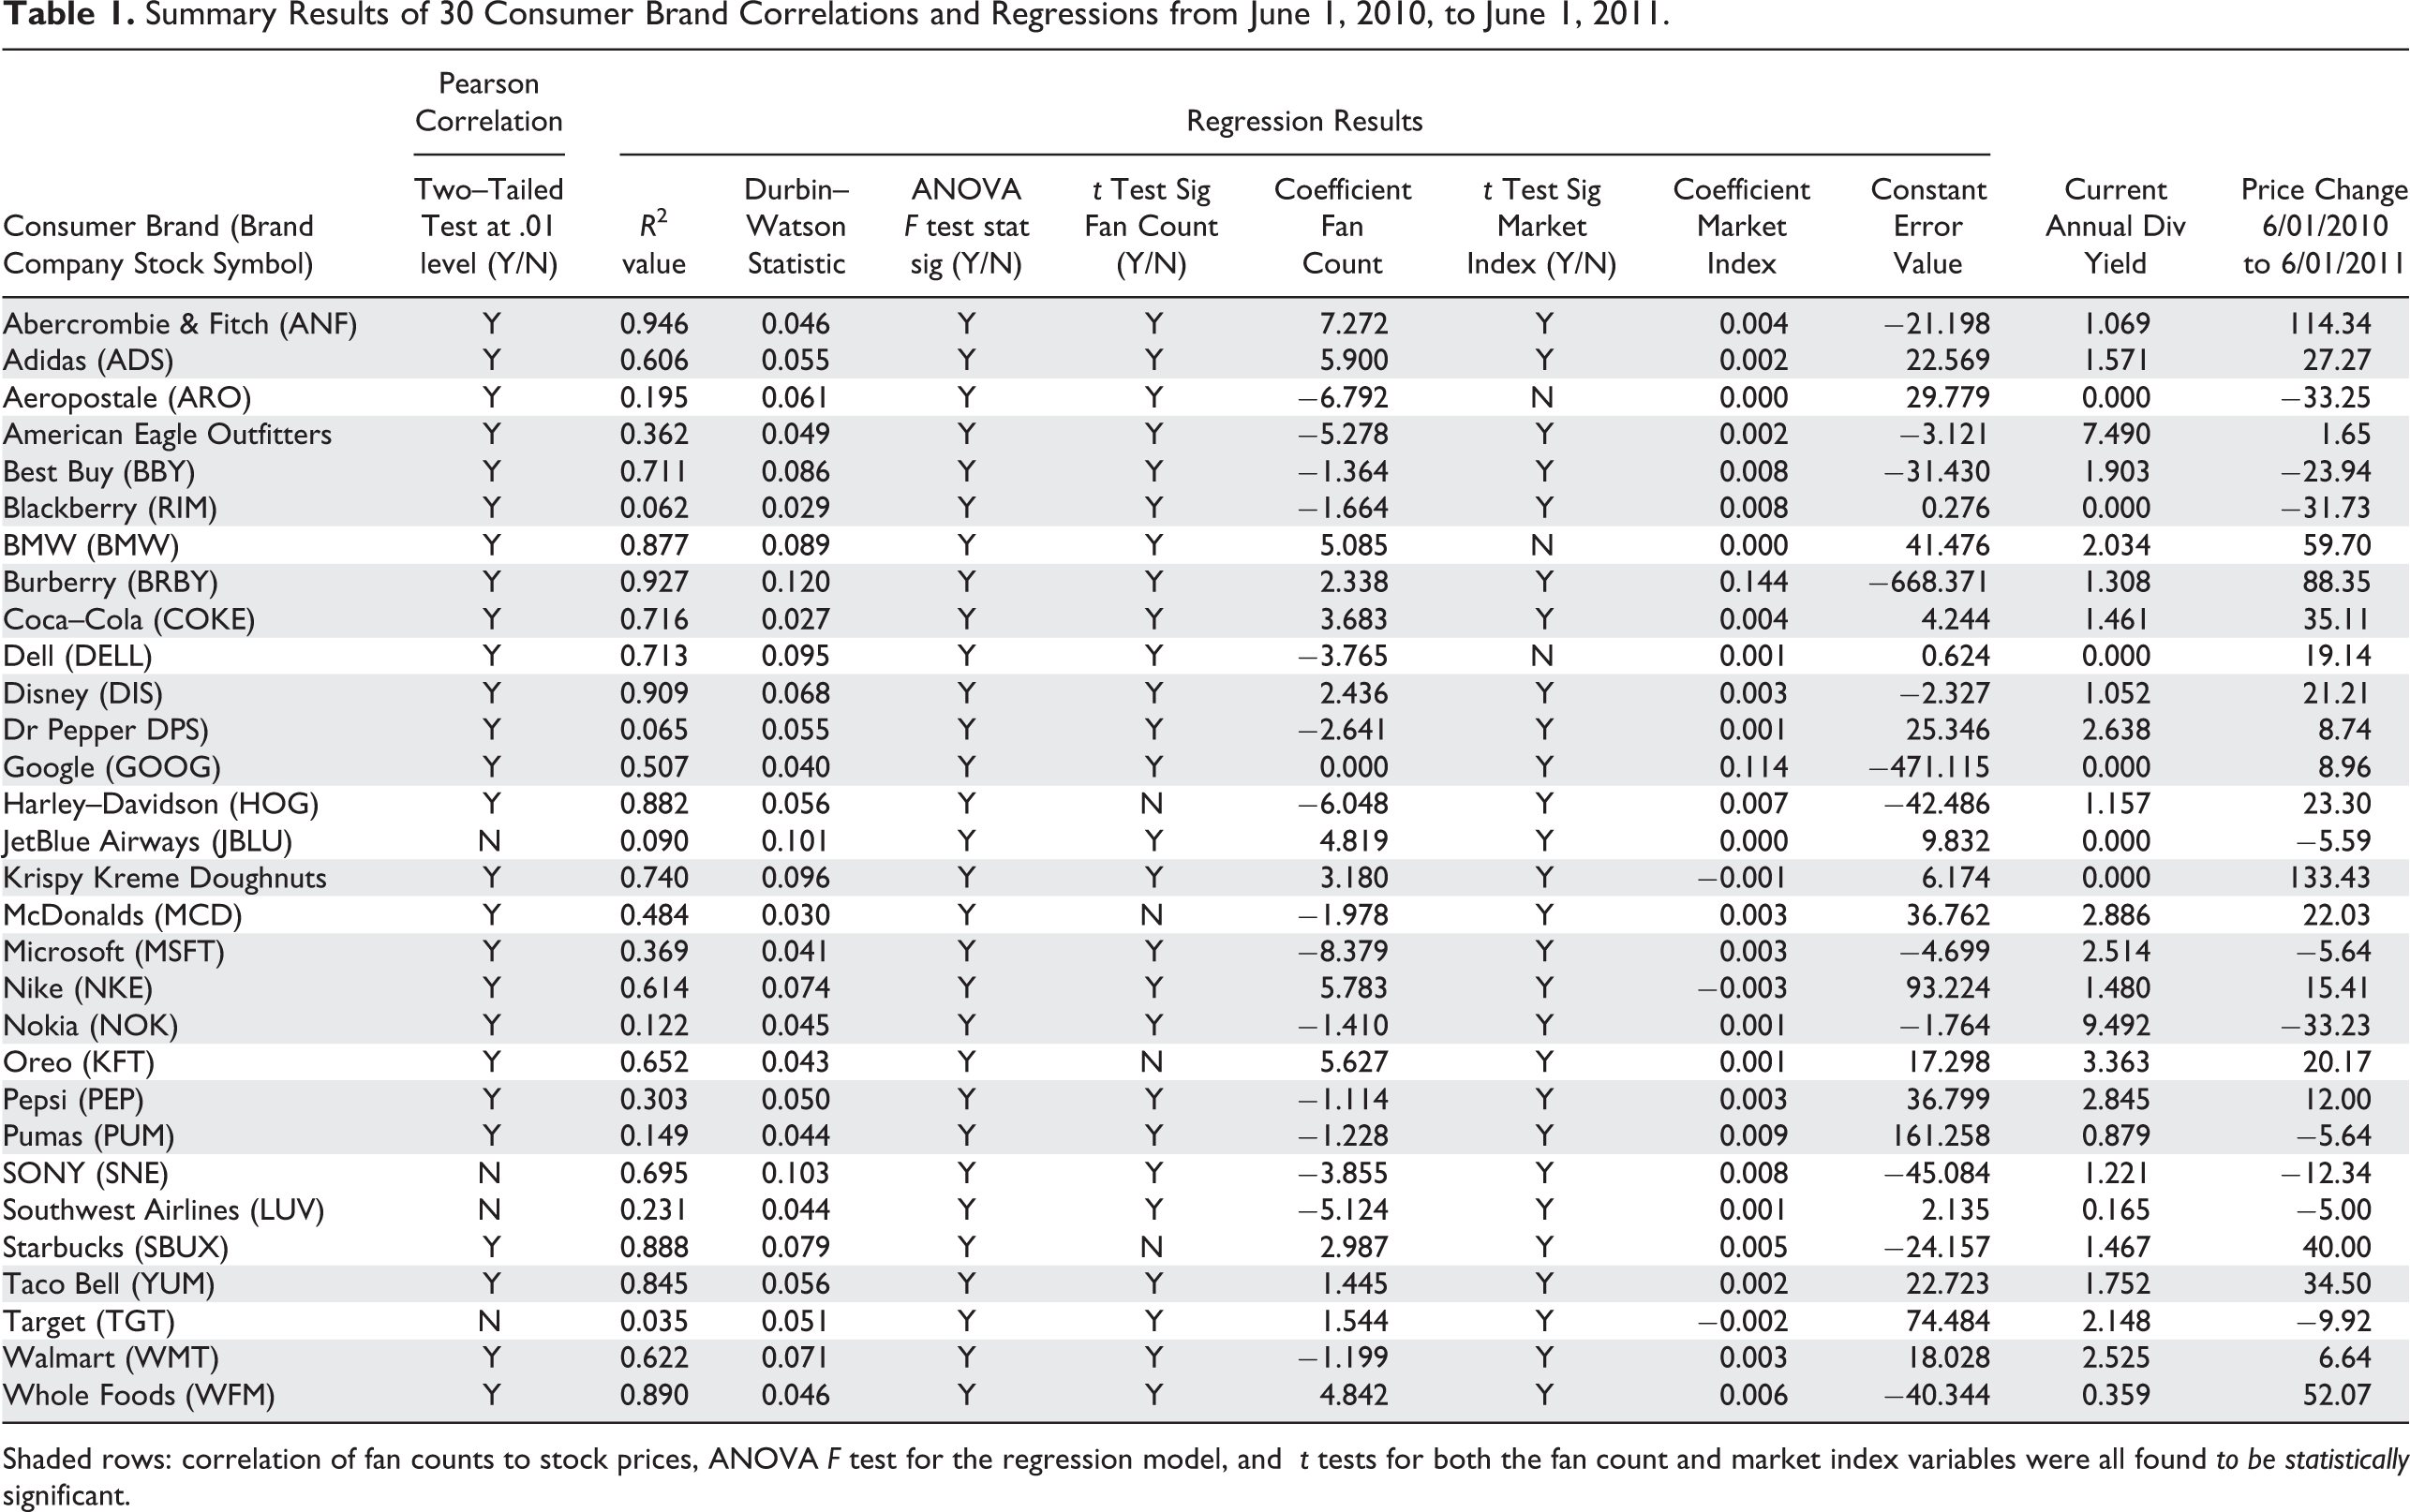
Shaded rows: correlation of fan counts to stock prices, ANOVA F test for the regression model, and t tests for both the fan count and market index variables were all found to be statistically significant.
In an examination of the strength of the effect (test of Hypothesis 2), correlation was found to be stronger for the collective total average indexed values of 19 brands (Group 1) within the 30-brand sample associated with small ticket and impulse purchases (Pearson product movement correlation coefficient of 0.967; R 2 value of .935) than those for the remaining 11 brands (Group 2) that are associated with larger-ticket items and more complex buying or decision-making processes (Pearson correlation coefficient of .597; R 2 value of .356). For a more precise measure of the relationship among the variables, regressions of the two brand groups’ total average indexed stock prices were expressed and calculated as a function of total average indexed fan counts, along with a market index to capture endogenous equity market volatility to better isolate the effects of social media popularity. The analysis for Group 1 resulted in an even stronger R 2 value, with .971, or over 97% of the variance in the dependent variable predicted by the independent variables, exceeding the R 2 for Group 2, which was .519, or less than 52%. The coefficient (or parameter estimate) for the total average fan count variable for Group 1 suggests that each unit increase in the total average fan counts would result in a .058 increase in the total average stock price, all things being equal. The coefficient (or parameter estimate) for the total average fan count variable for Group 2 suggests that each unit increase in the total average fan counts would result in a .075 decrease in the total average stock price, all things being equal.
Limitations and Implications for Future Research
Main criticism of this preliminary study is that it is an inductive research study, starting with a raw variable (fan counts) in search for a conceptual framework or application. There are countless limitations of fan counts of the most popular brands as a proxy for consumer following or public interest: daily fan counts simply represent the total number of people who have visited and indicated they like a brand social media site—not how frequent they visit the site, whether or how frequently they post comments, or volume or tone of those comments, nor any sentiment analysis of the tone or intensity (positive vs. negative) of user-generated content. There are also countless intrinsic limitations of stock prices as a proxy indictor for brand loyalty or performance, as stock prices are a function of an infinite number of micro/micro economic, systemic/specific quantitative and qualitative factors. Finally, the relatively high correlation between predicted and observed stock prices in the correlations and regressions suggest linear strength—but not necessarily appropriateness—of the models.
This is an early, preliminary study, with a small sample (n = 30) and limited time frame (1 year), exploring the potential of a new measure (fan counts). Future research should include semantic analysis of user-generated content as well as more sophisticated statistical tests with a broader sample to help establish direction of effect. While the results were inconclusive—given the study’s many limitations, and that it focused on exploring the relationship of social media popularity to stock prices, not the underlying mechanisms that drive them—it is hoped that this pioneering study will inspire further investigation into the potential predictive or indicative value of fan counts and/or social media popularity with social economic behavior.
Footnotes
Acknowledgment
Daniel Dearlove, founder of Famecount.com—a website that tracks brands receiving the greatest number of Facebook fans, the number of Twitter followers, and the number of YouTube views—was instrumental in providing fan count data for this study.
Declaration of Conflicting Interests
The author declared no potential conflicts of interest with respect to the research, authorship, and/or publication of this article.
Funding
The author received no financial support for the research, authorship, and/or publication of this article.