



Abstract
The considerable growth in the number of smart mobile devices with a fast Internet connection provides new challenges for survey researchers. In this article, I compare the data quality between two survey modes: self-administered web surveys conducted via personal computer and those conducted via mobile phones. Data quality is compared based on five indicators: (a) completion rates, (b) response order effects, (c) social desirability, (d) non-substantive responses, and (e) length of open answers. I hypothesized that mobile web surveys would result in lower completion rates, stronger response order effects, and less elaborate answers to open-ended questions. No difference was expected in the level of reporting in sensitive items and in the rate of non-substantive responses. To test the assumptions, an experiment with two survey modes was conducted using a volunteer online access panel in Russia. As expected, mobile web was associated with a lower completion rate, shorter length of open answers, and similar level of socially undesirable and non-substantive responses. However, no stronger primacy effects in mobile web survey mode were found.
Keywords
Introduction
While there is still a dramatic growth in fixed-line Internet usage, mobile Internet is expected to take over by 2014 (Morgan Stanley Internet Trends Report, 2010). Mobile devices, such as tablets and smartphones with high-speed Internet access, offer new opportunities for data collection. With almost six billion mobile phone subscriptions worldwide, the mobile phone is now the most popular personal device (International Telecommunication Union Report, 2011).
In this article, I compare data quality of self-administered web surveys conducted via mobile phones and those conducted via personal computer (PC). Current research focuses on smartphones (Buskirk & Andrus, 2012a, 2012b; Millar & Dillman, 2012; Peytchev & Hill, 2010; Scherpenzeel, Morren, Sonck, & Fernee, 2012; Zahariev, Ferneyhough, & Ryan, 2009), but I have included both feature phones and smartphones in this experiment. Users were not excluded based on phone type, because about half of Russian mobile web users access mobile Internet with feature phones (Yandex Report, 2012).
Fuchs and Busse (2009) argue that an advantage of mobile web data collection may be drawing a random sample using cell phone numbers. The key challenge for online surveys remains the lack of a sampling frame. There are no lists of Internet users and no random-based sampling methods analogous to the methods used to generate numbers in telephone surveys (Fricker, Galesic, Tourangeau, & Yan, 2005). This issue is partly resolved by pre-recruiting respondents (e.g., face to face or telephone), building a probability-based sample. In mobile web research, random digit dialing technique is possible (Fuchs, 2008). Reduction in nonresponse rates is another potential benefit, as respondents may choose convenient participation time and place (Fuchs, 2008). In recent years, response rates have significantly declined in almost all survey modes. Face-to-face and telephone surveys suffer from an increase in noncontact and refusal rates (De Leeuw & De Heer, 2001; Singer, 2006). Web surveys have lower completion rates compared to other survey modes (Cook, Heath, & Thompson, 2000; Lozar Manfreda et al., 2008; Shih & Fan, 2007). Multitudinous surveys conducted with volunteer online access panels create “over-surveying” effects, significantly decreasing completion rates for opt-in panels (Couper & Miller, 2008). Probability-based web panels have lower cumulative response rates considering all recruitment stages (Callegaro & DiSogra, 2008). Therefore, mobile web surveys have recently been evaluated by several panel providers as an additional data collection method that yields higher completion rate (Graham & Conry, 2011; Scherpenzeel et al., 2012).
Two of the main concerns in mobile web data collection are coverage and measurement errors. Mobile web penetration is increasing, but this survey mode will not likely become a standard one in the near future since it provides access to only limited segments of the population. It can be used in mixed-mode surveys to contact mobile-only populations or groups with a high rate of mobile Internet access (Fuchs, 2008). Cell phones may have a negative effect on data quality in web surveys due to limitations in screen size, processing power, support for browser plug-ins, and input capabilities (e.g., lack of a mouse and keyboard).
To examine mobile web survey effects, I conducted the experiment with two survey modes (PC and mobile web) and two questionnaire lengths (5 and 15 min) using a volunteer online access panel in Russia. In both modes, only mobile web users aged at least 18 years were eligible to participate. Mobile web survey mode included not only different platforms of smartphones but also feature phones. The questionnaire was programmed for both survey modes using Kinesis software, with one version for PC and one for mobile browsers. Both versions had the same number of items per screen and types of questions; they were designed as comparable as possible in general layout. The questionnaire included two images, no grids, no drop-down menus, and no sliders. Most items were presented on separate pages. Some correlated questions were displayed on the same screen, but not in grid format.
Mobile web respondents did not have to install an application to participate in the survey. They could start questionnaire by clicking on a link in the invitation. Applying Buskirk and Andrus’s (2012a) taxonomy of mobile online surveys, the experiment’s mobile survey was administered in an application-like format via a browser. This method facilitates control over questionnaire layout, provides uniform design across different mobile phones and operating systems, and gives users an application-like experience rather than of a mobile browser (see Figure 1).
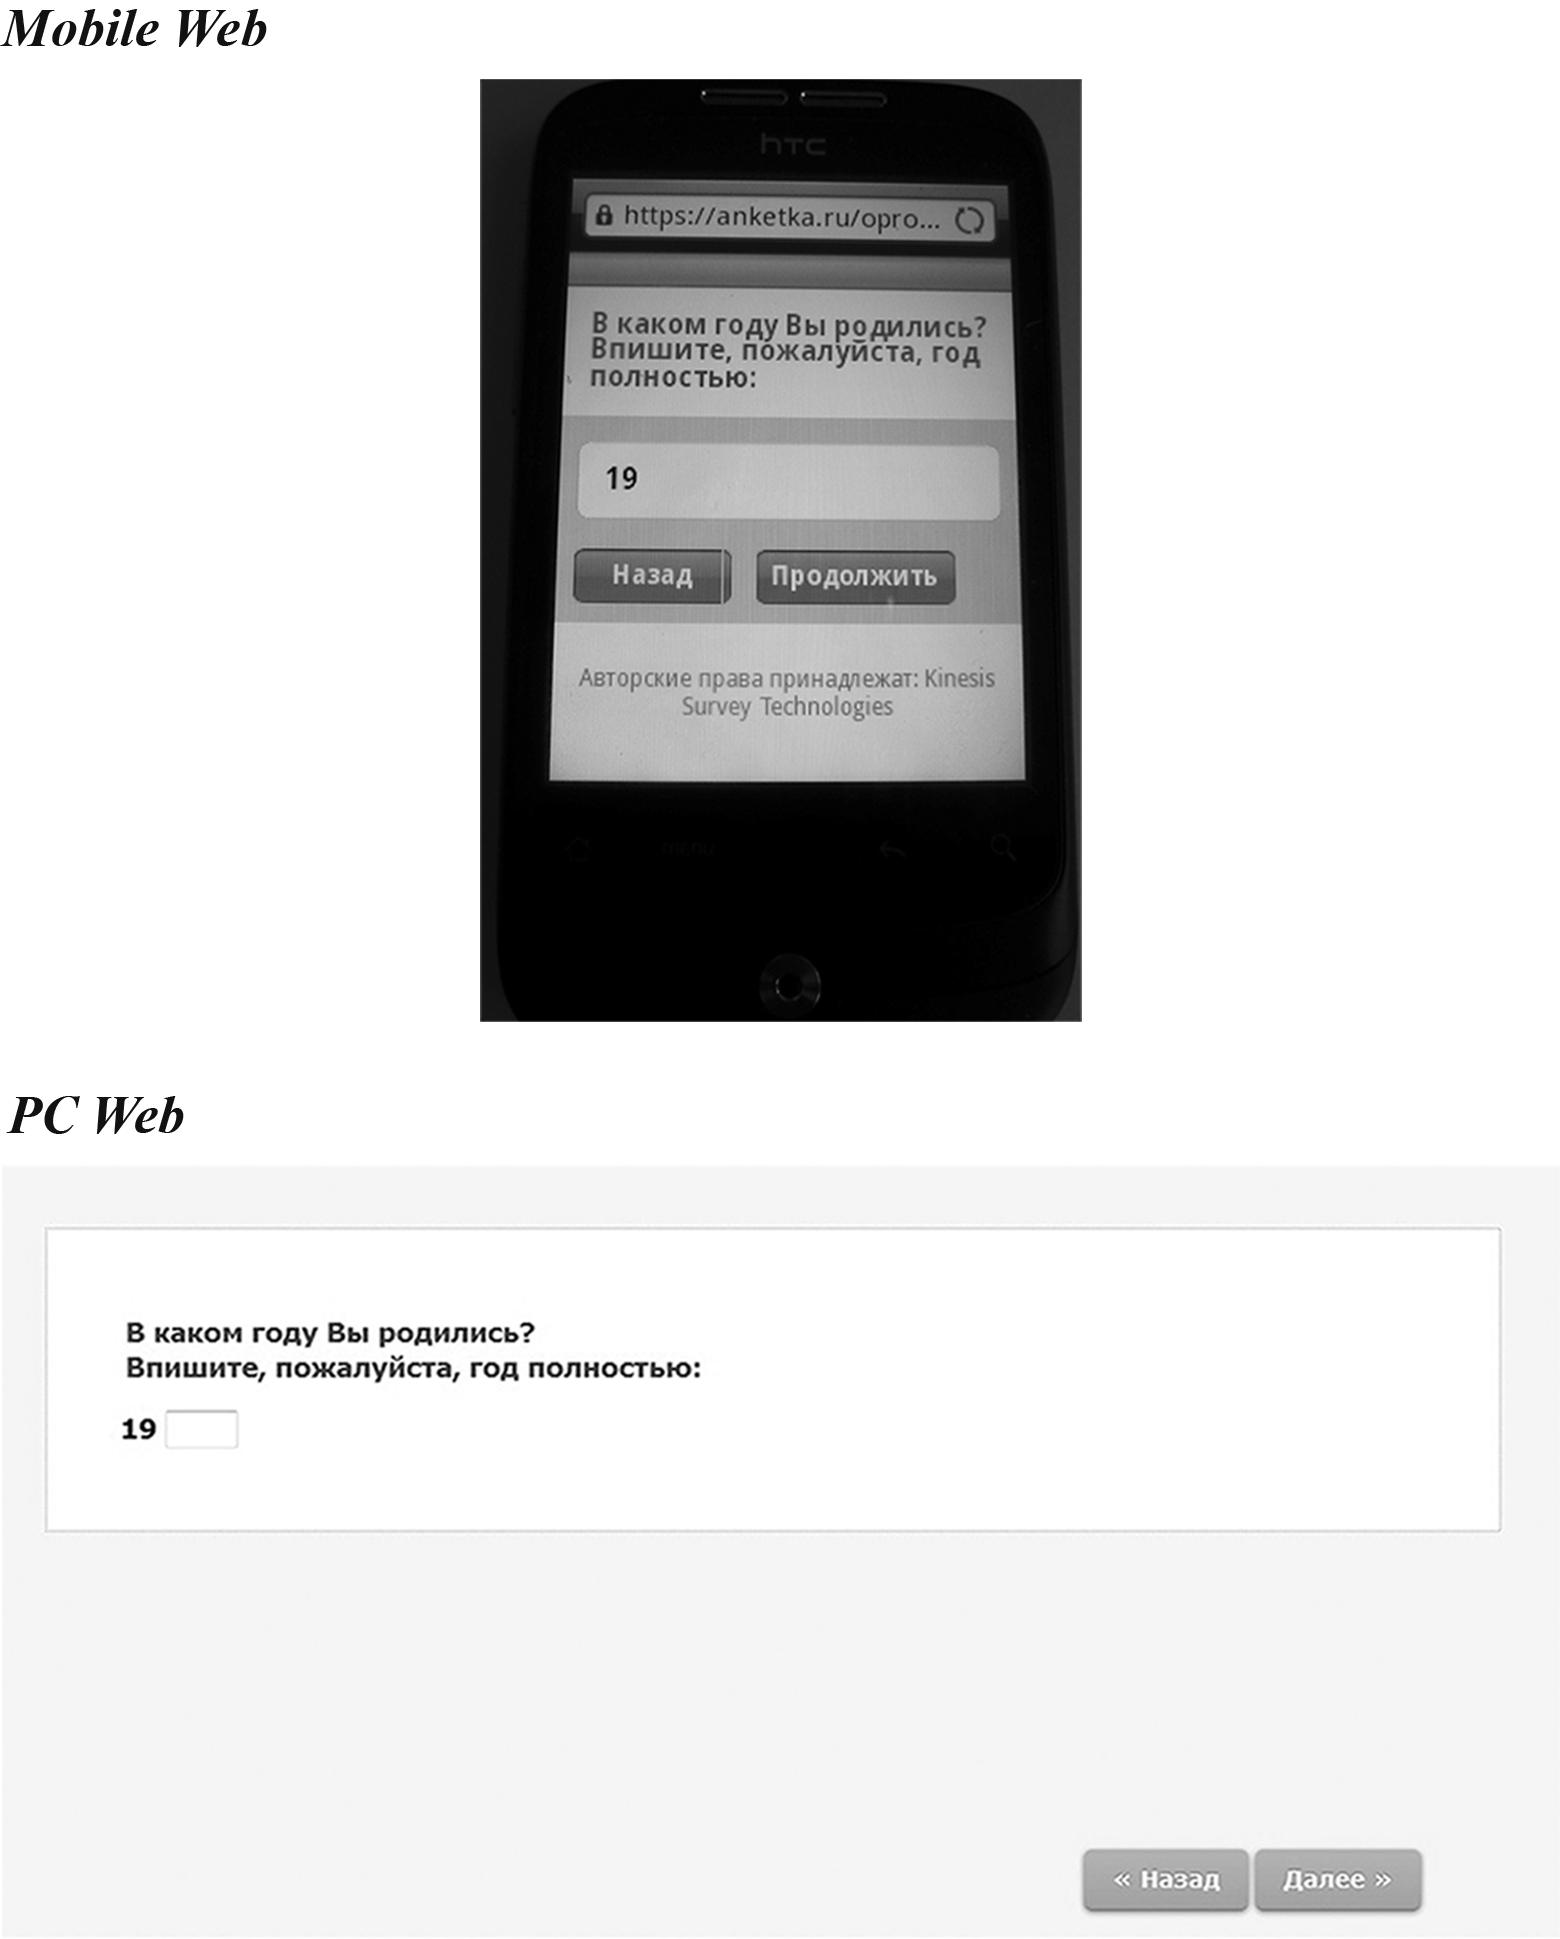
Mobile web, PC web.
Respondents were recruited through an online questionnaire completed via PC. Participants received invitations to complete the main questionnaire via computer if they were assigned to PC web, and via cell phone if assigned to the mobile web group. By identifying user agent string information (see Callegaro, 2010), I verified whether respondents participated in their assigned mode. Those who used a PC instead of mobile browser were excluded from the analysis (N = 32). No respondents assigned to the PC group completed the questionnaire via mobile phone. In total, 513 respondents filled out the short survey (PC, N = 266; mobile, N = 247) and 500 completed the long version (PC, N = 266; mobile, N = 234).
Literature Review and Hypotheses
Web survey paradata show that the percentage of those respondents who start a web survey which is not optimized for mobile devices from a smartphone or tablet can vary from 3% to 30% in the United States depending on the survey object and topic (Callegaro, 2012). Kelly, Johnson, and Stevens (2012) estimated that this percentage had quadrupled from the period of January 2011 (1.2%) to January 2012 (4.9%) in a volunteer online access panel in the United Kingdom. Callegaro (2010) showed that designing a web questionnaire only for PC users results in significantly higher break off rate among mobile users (e.g., 37.4% for mobile respondents compared to 22% for PC respondents). However, designing a questionnaire for cell phones does not solve the problem. Buskirk and Andrus (2012b) found a lower completion and a higher break off rates in iPhone compared to PC web survey mode. Millar and Dillman (2012) report that programming an additional mobile questionnaire version and urging students to complete the survey via smartphone does not improve response rates, and only slightly increases the percentage of mobile respondents. Zahariev, Ferneyhough, and Ryan (2009) explain that completing the questionnaire on a mobile phone takes more efforts: If the PC version takes an average of 2 min, the mobile version takes up to 6 min.
The diversity of mobile phones based on the type of phone (smartphone or feature phone), operating systems (e.g., Android, Apple iOS, and Windows Mobile), browsers, processing power, screen size, navigation, and data entry methods (touchscreen or keypad) may have some unique response effects because of differences in user experience and burden factor. To make user experiences as comparable as possible among mobile web respondents, Peytchev and Hill (2010) provided participants identical non-touchscreen smartphones for 19 weekly mobile surveys. They found similar data quality in the horizontal compared to vertical response alignment, grid format compared to 1 item per screen, and lower probability of selecting “Other” option in the half-open compared to the closed-ended question (Peytchev & Hill, 2010). Lai et al. (2010) found that mobile respondents had some troubles answering questions if they had to scroll down to see the list of response categories or if they had to write the text in the half-open questions.
My experiment compares data quality between the two survey modes based on several indicators, particularly completion rates, response order effects, non-substantive responses, social desirability bias, and length of open answers.
Completion Rates
There is some evidence that mobile a web survey mode has a lower completion rate compared to a PC survey (Buskirk & Andrus, 2012b; Millar & Dillman, 2012). In line with the results of web experiments that showed a negative effect of the survey length on completion rates (see Crawford, Couper, & Lamias, 2001; Galesic, 2006; Galesic & Bosnjak, 2009; Marcus, Bosnjak, Lindner, Pilischenko, & Schütz, 2007), lower completion and higher break off rates are expected in the long questionnaire in both survey modes.
Response Tendencies: Response Order Effects and Non-Substantive Responses
There is some evidence that the order in which the response options are visually or orally presented significantly affects the distribution of the answers. Visually presented categories may result in primacy effects, wherein respondents favor those items demonstrated earlier in the list since they have a higher probability of being subjected to cognitive processing (Krosnick & Alwin, 1987). Eye-tracking experiments in computer web surveys revealed that the respondents spent significantly more time looking at the top answer categories, while later responses were observed for much less time or not processed at all (Galesic, Tourangeau, Couper, & Conrad, 2008).
Couper, Tourangeau, Conrad, and Crawford (2004) suggest that the visibility principle might explain some order effects in web surveys, that is, the options that are visible until the respondent takes some additional action to see all of them, are likely to have higher probability of selection compared to the options initially hidden on the screen. Following the visibility principle, I expect that smaller mobile phone screen size and less number of options initially visible might result in slightly stronger primacy effects in the mobile web environment in both single-choice (radio buttons) and multiple-choice (check boxes) questions.
Buskirk and Andrus (2012b) found no difference between iPhone and PC web survey modes in the numeric questions. Zahariev et al. (2009) reported the same amount of item nonresponse in the open-ended question in both PC and mobile web survey modes. Thus, I do not expect any differences in the rate of non-substantive responses between two modes.
Social Desirability Bias
Reporting is more accurate in surveys offering higher levels of perceived privacy. Many experiments demonstrate that social desirability bias is less likely in self-administered surveys, since they provide greater privacy and confidentiality (Kreuter, Presser, & Tourangeau, 2008; Tourangeau & Smith, 1996; Tourangeau & Yan, 2007). At the same time, a number of the experiments that compared different methods of self-administered survey modes found that they yield quite similar results in sensitive items. No significant differences in the level of reporting between computer and paper self-administered surveys (Halifors, Khatapoush, Kadushin, Watson, & Saxe, 2000), web-based and mail surveys (Uriell & Dudley, 2009), or between variations of computer-assisted self-interviewing (CASI), such as text-CASI and audio-CASI (Couper, Singer, & Tourangeau, 2003; Couper, Tourangeau, & Marvin, 2009) were revealed. In line with these results, I suggest that both survey modes provide a similar degree of privacy, and no difference in the level of reporting is expected.
Length of the Open Answers
Kaikkonen (2009) argues that mobile web users avoid answering e-mails on their cell phones, sending short replies only in urgent cases preferring a standard PC keyboard for writing. In mobile web survey, mode respondents are discouraged to type text in the half-open questions (Lai et al., 2010; Peytchev & Hill, 2010). There are three mobile phone input methods. Two use a keypad. The third requires a touchscreen. Feature phones have 12–15 keys with alphanumeric characters and punctuation marks. Fewer keys than actual number of characters create some difficulties for users. Smartphones have a touchscreen virtual keyboard used with a stylus or finger, or a QWERTY keypad with small buttons. Longer responses in the open-ended question are expected among smartphone rather than feature phone users in mobile mode.
Experimental Design
A two-factor experiment was designed, with two levels for each factor, for a total of four experimental treatments.
Mode of Data Collection
A key variable was the mode of data collection. At the recruitment stage, all participants filled out a PC-based web questionnaire in which they were invited to take part in the main survey and randomly assigned either to the mobile or the PC web survey mode. In both modes, only mobile web users were eligible to participate in the main survey. Those who were invited to complete the questionnaire via mobile phone were asked to provide their numbers (almost 99% of the eligible respondents provided their numbers). Respondents who expressed willingness to participate were invited to the main survey either by short message service (SMS) if they were assigned to the mobile group or by e-mail if assigned to the PC group.
Length of the Questionnaire
The participants were randomly assigned either to a 5-min or a 15-min survey. The short questionnaire was part of the long survey. After completing the short version, the respondents assigned to the 5-min group were informed that the survey was over. At the same time, they were welcome to continue answering an additional 10-min questionnaire, which was the second part of the long survey. No extra incentives were provided for this additional survey.
Contrary to the expectations, the participation rates in this additional questionnaire were high in both survey modes, although with a significantly higher rate in the PC environment (95.1% in PC and 81.8% in mobile web survey, χ2 = 22.70, df = 1, p < .001). However, to avoid the self-selection bias that could have occurred in case of a voluntary completion, we did not include these additional data in the analysis presented in the article. In total, 513 respondents completed the short survey (266 via PC, 247 via mobile phone) and 500—the long version (266 via PC, 234 via mobile phone).
Data Collection
The experiment was conducted in Russia from November 24 to December 8, 2011, by Online Market Intelligence (OMI). At the recruitment stage, invitations were sent randomly to the participants in the OMI volunteer online access panel stratified according to the gender and age profile of the mobile web population in Russia in 2011 (data were provided by the Public Opinion Foundation). The respondents were randomly assigned either to mobile or PC online survey. The link to the recruitment questionnaire was sent by e-mail and was supposed to be filled out via PC in all treatment groups. No quotas were set on the final number of completed interviews for each group. Within a few days after completing the recruitment questionnaire, the respondents received an invitation to the main survey either by SMS or e-mail.
Questionnaire
In the short version of the survey that was mostly on mobile web usage, the respondents were asked 21 items. The questionnaire began with key demographic variables (age and gender) and the screening question of whether the respondents used the Internet on their cell phones in the last 30 days; the succeeding items covered mobile web usage patterns, life satisfaction, health estimation, and finally, several demographic questions.
The long version included additional questions about health, confidence of the respondents in the future and self-reliance, and a block of sensitive items dealing with acceptance of deviant behavior and attitude toward deviant practices. In total, there were 54 items.
Results
Profile of the Respondents
There were statistically significant differences in the respondents’ characteristics between the two survey modes, particularly concerning age, frequency of mobile web usage, and smartphone ownership. On average, the mobile respondents were younger, heavier mobile web users, and had a higher probability of owning a smartphone. The respondents did not differ in gender, education, and mobile web usage experience.
In mobile web survey mode, 20% of the respondents (96 of 481) used feature phones and the rest used smartphones to fill out the questionnaire. Among smartphone operational systems, the most popular were Symbian (38% of the smartphone respondents), Android (32%), Apple iOS, and Windows Mobile (about 8% each).
Response Time
In the mobile web environment, the mean time of questionnaire completion was 3 times as long as in the computer environment. The values were cut on the 95th percentile for each group separately to exclude participants who took a long time to fill out the questionnaire. The short questionnaire was completed within 5.28 min in PC and 15.46 min in mobile web. The long questionnaire was finished within 9.66 min and 29.46 min, respectively. It took significantly more time (t = 3.218, df = 232, p < .01) to fill out the short survey via feature phone (18.77 min) than via smartphone (14.60 min); and more time (though not significantly) to fill out the long survey (32.53 and 28.68 min, respectively).
There are three reasons for the huge difference in completion time between the survey modes. First, a slower Internet connection on the cell phone, and thus the long time necessary to download questions (two of which had images), was the main reason. Second, participation via cell phone demands more time and effort to answer questions on a small screen without using a mouse and keyboard (Zahariev et al., 2009). Significantly more mobile participants found it difficult to fill out the questionnaire (9.5% in mobile vs. 0.6% in PC web). Third, cell phones allow the respondents to be more “mobile:” whereas only 3% of PC respondents filled out the questionnaire outside the home and office, almost 20% of mobile respondents completed the survey while commuting or inside cafes/bars/restaurants.
Completion Rates
The cumulative completion rate is calculated as the multiplication of the completion rate at the recruitment stage (CR1); the “willingness” rate (WR), which refers to the percentage of respondents who agreed to participate in the main survey at the recruitment stage; and the completion rate in the main survey (CR2). At every stage, the completion rate is calculated as the percentage of completed interviews (including those that, for some reasons, were screened out) divided by the total number of invitations.
At the recruitment stage, 3,926 invitations were sent randomly to the panelists to invite them to participate in the main survey via PC within the next few days, and 22,325 invitations were sent to invite panelists to the mobile survey (see Table 1). The number of invitations was highly skewed to the mobile condition, since the willingness and completion rates in mobile web survey mode were expected to be significantly lower. All invitations were sent by e-mail, with the respondents in all groups supposed to fill out the recruitment questionnaires via PC. In line with the expectation, the percentage of those who expressed willingness to complete the survey via PC was much higher. While almost every respondent agreed to receive an invitation to the main survey in the PC group, less than half of the participants did so in the mobile condition. Age, gender, education, and mobile web usage were significantly associated with the decision to participate in the mobile survey. No significant effect of the questionnaire length on willingness rate was found.
Completion Rates.

Note. PC = personal computer. χ2 test, comparing mobile web and PC web.
*p < .001 (two-tailed).
Since more respondents were recruited at the recruitment stage, the random selection was used to invite participants to the main survey. In both stages, the completion rate was higher and the break off rate lower in the PC group. The break off rate at the recruitment stage in the mobile group was caused mainly by refusal to participate in the main survey. In the main survey, the completion rate (CR2) via PC was twice as high as via mobile phone (81.9% and 40.1%, respectively), while the break off rate was almost 17% points lower. Most of the break offs in the main survey via mobile phone were on the welcome screen and three following demographic questions. Contrary to the expectations, no effect of questionnaire length on the completion and break off rates in the main survey was found in both modes. The cumulative completion rate (CR1 × WR × CR2) was 23.1% in PC and 4.5% in mobile web. The main result supports the first hypothesis.
Response Order Effects
Response order effects were tested in radio buttons and check boxes. Stronger primacy effects were expected in mobile web survey in both types of questions. Primacy effects in single choice questions were based on the analysis of four factual questions about mobile web usage (duration, experience, and frequency) and two judgment questions about life satisfaction and changes in quality of life (see Appendix A). All questions were presented on separate pages in both short and long questionnaires almost at the beginning of the survey.
The order of the responses was manipulated: Half of the participants were assigned to receive response categories in the standard order and the other half assigned to the reverse order. For example, in the question about mobile web usage experience (“How long have you been using the Internet on your cell phone?”), those assigned to the standard condition saw the answers in the order of “Less than 3 months” to “More than 3 years,” while those assigned to the reverse treatment saw them in the order of “More than 3 years” to “Less than 3 months.” All questions had from five to eight responses on an ordinal scale. Two judgment questions included “Difficult to answer” response category (this answer is usually used in Russian questionnaires to replace the “Don’t know” answer), which was always presented as the last answer on the screen. This response was removed from the analysis.
I ran six ordinal logistic regressions with a logit link function predicting the respondent’s answer based on whether he or she was assigned to the group with the standard or reverse order (reverse order = 0; standard order = 1), and PC or mobile web group (mobile web = 0; PC web = 1). Interaction between survey mode and response order was the main focus of my interest. The model for each question will roughly be:
where α i —the threshold value for each response category, i = 1, … , (number of the response categories—1).
yi = probability (response number ≤i)/probability (response number >i).
All response categories have their own threshold values but the same regression coefficients. In other words, the effect is supposed to be the same across response categories in the question (proportional odds or parallel lines assumption).
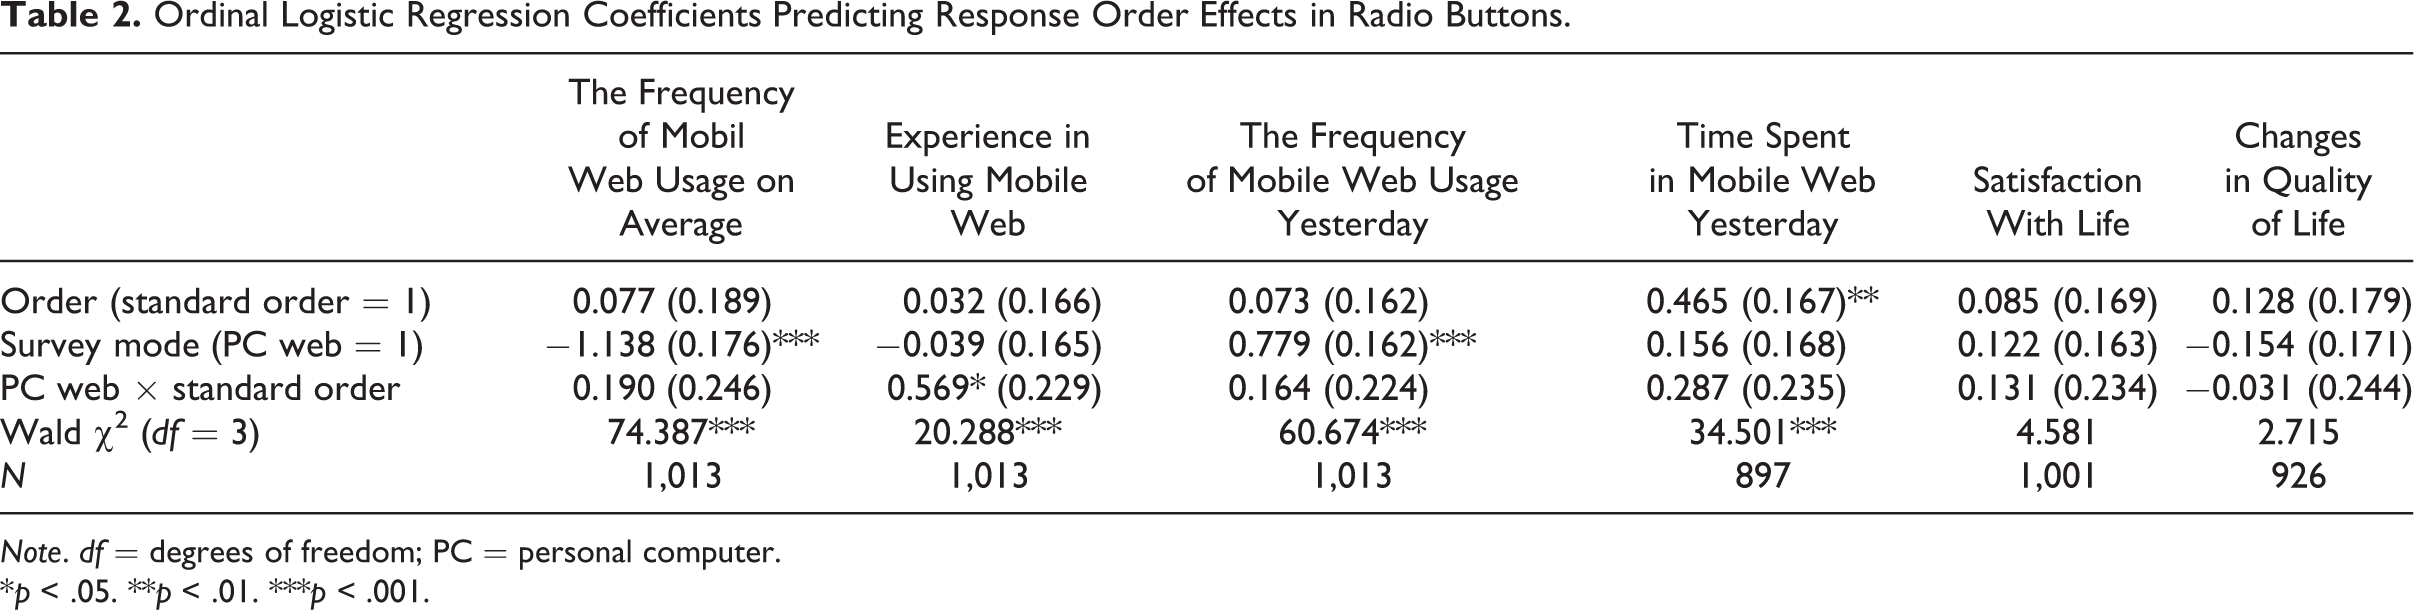
Table 2 indicates the parameter estimates for each of the six questions. Models based on factual questions were significant, while those based on judgment were not (see Wald χ2). All except the question about average frequency of mobile web usage met the requirements of proportional odds assumption. For this question, a multivariate logistic regression predicting the selection of the first response category based on the same predictors was additionally run; however, no significant effects of the response order and interaction with the survey mode were revealed (data not shown).
Ordinal Logistic Regression Coefficients Predicting Response Order Effects in Radio Buttons.
Note. df = degrees of freedom; PC = personal computer.
*p < .05. **p < .01. ***p < .001.
Primacy effects were found in both survey modes. However, the effect was significant only in the question on duration of using mobile web (“In total, how much time did you spend using mobile Web yesterday?”). In both survey modes, more respondents selected the first response of the seven possible answers (either “Less than 10 minutes” or “More than 3 hours”) when it was shown as the first on the screen. Contrary to the expectations, stronger and statistically significant primacy effects were found in PC web survey mode in the question on experience in using mobile web. For instance, the predicted probability of selecting the first response (Less than 3 months) of the six possible answers in PC web was 7.0% in the standard order compared to 4.0% in the reverse order. In mobile web, the probability of selecting the first response category was the same in both treatment groups. I also tested if the questionnaire length had a significant effect on satisficing; however, no evidence was found. In addition, no difference in the primacy effects between smartphone and feature phone users in mobile web survey mode was found (data not shown).
The primacy effects in the check boxes were compared based on the factual question: “Which of the following were you doing for the past 12 months to feel good and healthy?” (see Appendix A). The question had 12 response categories including those activities that were probably done by most of the respondents such as “I walked outdoors,” “I visited doctor,” or “I took some vitamins,” and the 13th response category “None of the above.” It was asked only in the long survey about in the middle of the questionnaire. The probability of the selection of the first answer (I tried to control my weight, not to overeat) was compared between survey modes. Contrary to the expectations, more respondents selected the first response in PC (62.8%) compared to mobile web survey mode (56.0%). To test whether the effects are significant, a multivariate logistic regression predicting the selection of the first response was performed. Such variables as age, gender, education, and the place of completing the questionnaire were included as control variables (data not shown). However, no significant impact of the survey mode on primacy effects were found.
Level of Reporting of Socially Undesirable Responses
Supporting the assumption “the more the better,” which means a higher level of reporting of deviant attitudes or behavior yields more accurate data, two methods were compared. Neither PC nor mobile web was expected to be more effective in reducing social desirability bias. There were 16 questions classified as likely to have socially undesirable answers. All questions were only in the long survey, and were asked almost at the end of the questionnaire. One question about deviant behavior asked whether the respondent had ever stolen anything from a shop. Three other questions were about attitude toward abortion, homosexual relationships, and unfaithfulness to one’s partner. The respondents could answer whether they found this behavior always permissible, permissible in certain circumstances, or never permissible. These three questions were presented together on the same screen one after another (without using a grid format). The other 12 questions, designed by Friedrichs and Blasius (2003), described six situations showing deviant behavior and asked the respondent’s attitude and emotional feelings toward the behavior. Two questions on each situation were presented on the same screen. Based on 16 items, an index that counted the number of socially undesirable answers was created (for instance, stealing from a shop: yes = 1, no or difficult to answer = 0; see Appendix B). After that, the rate of socially undesirable responses was counted for each respondent who was assigned to the long questionnaire.
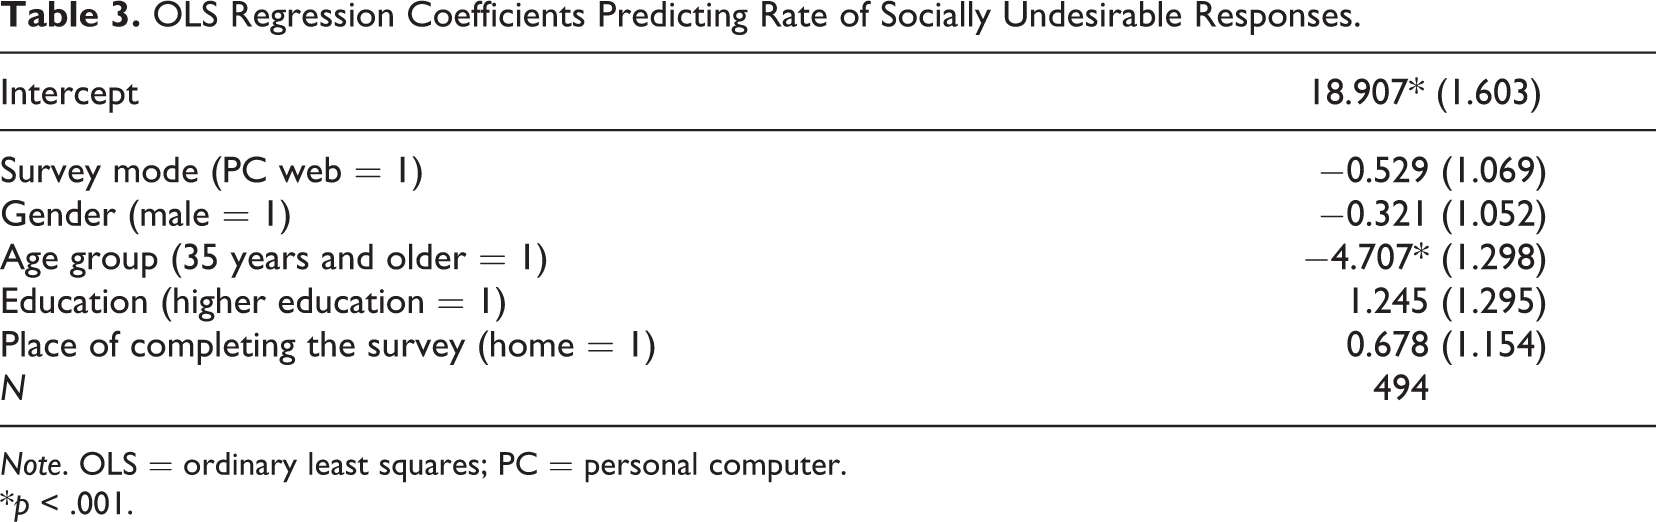
An ordinary least squares (OLS) regression predicting the rate of socially undesirable items was applied (see Table 3). Age, gender, education, and the place of completing the questionnaire were included as control variables. In accordance with the expectations, no significant effect of the survey mode on the index of socially undesirable responses was found.
OLS Regression Coefficients Predicting Rate of Socially Undesirable Responses.
Note. OLS = ordinary least squares; PC = personal computer.
*p < .001.
Non-Substantive Responses
No differences in the level of non-substantive responses between two survey modes were expected. To test the hypothesis in single-choice questions, an index that counted the number of “Difficult to answer” responses in 16 radio button questions was created (see Appendix C). Most of the questions were included only in the long version at the end of the questionnaire, thus, those assigned to the long survey were analyzed. Since the outcome variable is count data, and the selection of “Difficult to answer” responses in different questions are likely to be independent, a Poisson regression model might be performed. However, due to the problem of overdispersion, the negative binomial model was used (both the Akaike information criterion and the Bayesian information criterion indicate that the negative binomial model is better than the Poisson regression). In line with the expectation, no effect of the survey mode on the index was revealed (data not shown). Moreover, no difference between feature phone and smartphone users were found in mobile web survey mode.
The analysis of the check box question (Which of the following were you doing for the past 12 months to feel good and healthy?) with the response category “None of the above” showed that mobile survey resulted in slightly but not significantly stronger satisficing compared to PC survey (2.1% and 0.8%, respectively, χ2 = 1.73, df = 1, p > .05).
The open-ended question (“What does ‘healthy food’ mean for you?”) was presented in both versions of the questionnaire, and was asked almost at the end of the short survey, or in the middle part of the long questionnaire. It was obligatory for all participants, and no “Difficult to answer” response category was displayed on the screen. Less than 1% of the respondents gave some nonrelevant responses in the text field, with no difference between survey modes.
The numeric open-ended question about household income was presented almost at the end of each survey. This was the only item that the participants could skip. However, they were not informed of this possibility. Striking differences in item nonresponse were found. While all PC participants either indicated their income or selected the “Difficult to answer” response, more than half of the mobile respondents (55.7%) skipped this question. Almost 97% of the feature phone owners did not answer that question, while among smartphone users the percentage was significantly lower—46%. I hypothesize that the respondents did not decline the task but rather technically and not intentionally skipped the question by clicking the “Next page” button several times before the item was displayed on the screen. Missing data could be an indicator of the difficulties that most respondents faced because of slow Internet connection on their mobile phones. I run a multivariate logistic regression predicting the item nonresponse based on such variables as the type of phone, survey length, place of completing the questionnaire, demographic questions, and found no other significant factor except the type of phone (data not shown). At the same time, in line with the prediction, no differences in the rate of “Difficult to answer” responses and in the out-of-range values between the two modes were revealed.
Length of Open Answers
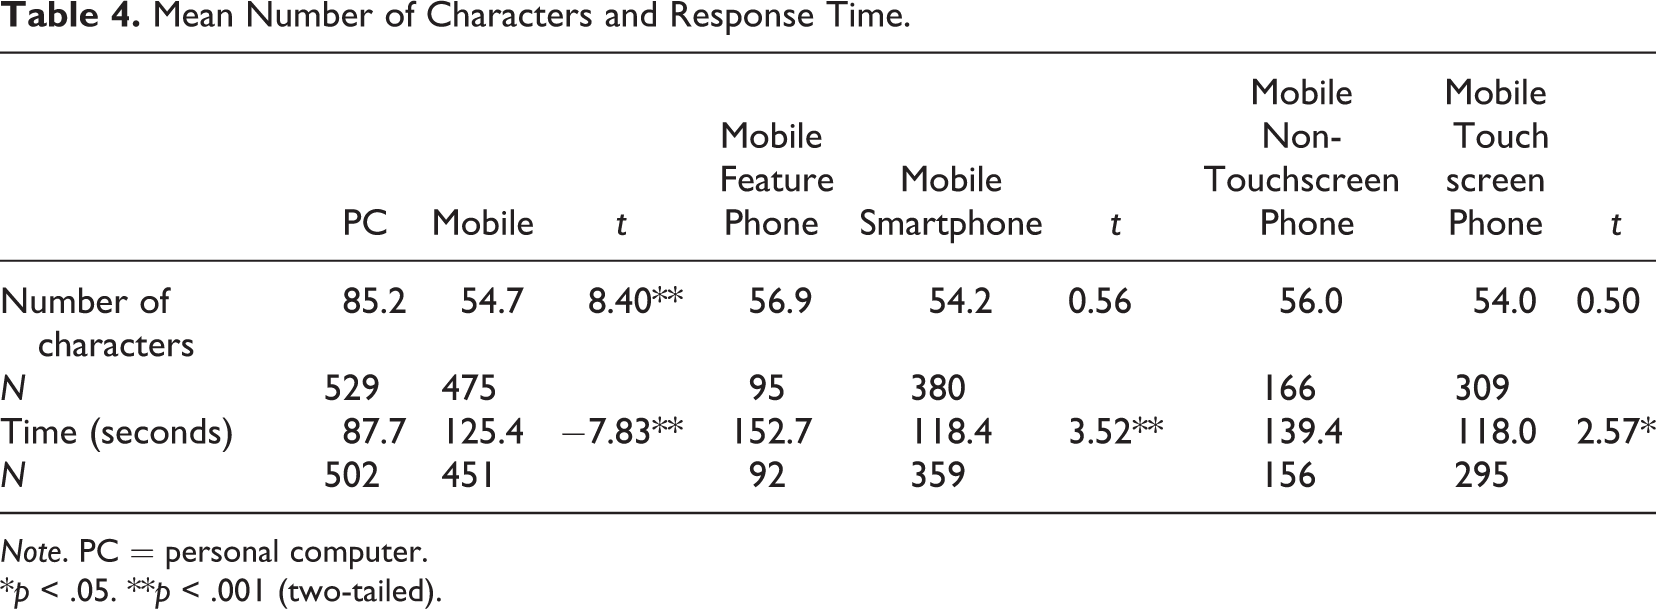
The quality of the responses to the open-ended questions was measured by the number of characters the respondents entered. The question was about the healthy food concept (“What does ‘healthy food’ mean for you?”). As expected, significant differences in the mean number of characters were found: 85 in PC web and 55 in mobile web (see Table 4). In accordance with the expectations, it took significantly more time to type an answer on a cell phone rather than on a PC (125 s compared to 88 s, respectively).
Mean Number of Characters and Response Time.
Note. PC = personal computer.
*p < .05. **p < .001 (two-tailed).
Contrary to the expectations, the results showed no statistically significant difference in length of responses between mobile devices (feature phones vs. smartphones; touchscreen phones vs. non-touchscreen phones), but it took significantly more time for the participants to write using a feature phone rather than a smartphone. The difference in time might be explained by the slower Internet connection in feature phones. The same tendency can be found when comparing touchscreen and non-touchscreen phones. Given that the type of phone was not significant, I tested whether the mobile web usage experience could explain the length of open answers in mobile mode. OLS regression predicting the response length based on mobile web usage experience, survey length, type of mobile phone, demographic variables, and the place of completing the questionnaire, showed that more experienced mobile web users wrote significantly more compared to less experienced users (data not shown). No impact of the questionnaire length, type of phone, and the place of completing the survey were found.
Discussion and Conclusion
The analysis in the article was organized around five hypotheses. First, the completion rates between PC and mobile web survey modes were compared. In accordance with the expectations, the mobile web survey showed significantly lower completion and higher break off rates. I should, however, note that a higher completion rate in PC survey can be also explained by the fact that online access panelists are regularly invited to complete web surveys. Moreover, switch mode from the initial PC at the recruitment stage to mobile mode in the main survey also decreased cumulative completion rates. Filling out the questionnaire was more labor-demanding and time-consuming for mobile respondents. They reported higher level of difficulties in completing the survey, and the response time was 3 times as long as in PC web. The good news for researchers, however, may be the finding that the questionnaire length has no effect on the willingness to participate in mobile survey, as well as on completion and break off rates, which indicates the feasibility to conduct longer surveys in the mobile environment. Another indicator of this possibility was the decision of most of the participants in the short survey to complete an additional questionnaire without any extra incentives.
My second hypothesis concerned primacy effects in two survey modes. In line with the visibility principle, when options visible on the screen have higher probability of selection, I expected stronger primacy effects in mobile rather than PC web survey mode. However, no evidence was found in the experiment. Moreover, contrary to the expectations, primacy effects were slightly stronger (though almost no statistically significant) in PC web survey mode. Although very limited support was found for this contra hypothesis, I suppose that since the mobile respondents have to scroll down to see the response categories presented lower on the screen and turn to the next page, it might slightly mitigate the primacy effects.
Third, in line with the expectations, no differences in the rate of non-substantive responses were found in the closed-ended and open-ended questions between two survey modes. Taking into consideration the accidental item nonresponse in the income question in mobile mode, when the Internet connection is slow and the respondent may click the “Next page” button several times to proceed with a new question, I recommend making all questions obligatory in the mobile environment.
Fourth, I analyzed whether two survey modes yield different levels of reporting in sensitive items. No difference was expected, and I found support for the hypothesis. Though the context of using mobile web in terms of time, place, and social environment in comparison to its stationary counterpart is more different, complicated and might significantly vary from one respondent to another, it seems that it does not affect the level of reporting.
My final hypothesis was about the length of open answers in both survey modes. As expected, the responses were significantly shorter in the mobile web survey; however, the type of mobile device (smartphone/feature phone or touchscreen/non-touchscreen) was found to have no effect on the length of the answer. The length was mostly explained by the experience in mobile web usage.
There are limitations to the analyses presented here. First, the findings were based on nonprobability sampling. Thus, the research findings may have limited generalizability. Second, the respondents are members of a volunteer online access panel, which means that they participate regularly in web surveys via computer or laptop. Therefore, the comparison of completion rates between two survey modes might be biased. Third, the study was conducted in Russia, and there are probably some cultural differences in the response processes compared to European countries and the United States. Finally, each effect observed in this study was based on a very limited number and types of questions; thus, more experiments should be conducted to replicate the findings.
In spite of the limitations, the results of the comparison of PC and mobile web survey modes appear to be promising for researchers. The findings suggest that the mobile web survey mode does not result in lower data quality in terms of measurement error. Moreover, type of phone or place of completing the survey seem to have no effect on satisficing. Since the completion rates are significantly lower and break off rates are significantly higher in mobile compared to PC web surveys, in future studies, it might be worth investigating how the number of dropouts can be decreased in mobile web mode.
Footnotes
Appendix A
Appendix B
Appendix C
Acknowledgment
I would like to thank Jörg Blasius for having an opportunity to conduct this experiment while doing my postdoctoral research at Bonn University. I am also grateful to Mick Couper for his support.
Declaration of Conflicting Interests
The author(s) declared no potential conflicts of interest with respect to the research, authorship, and/or publication of this article.
Funding
The author(s) disclosed receipt of the following financial support for the research, authorship, and/or publication of this article: The project was supported by Online Market Intelligence (OMI).