
Abstract
This article reports from a pilot study that was conducted in a probability-based online panel in the Netherlands. Two parallel surveys were conducted: one in the traditional questionnaire layout of the panel and the other optimized for mobile completion with new software that uses a responsive design (optimizes the layout for the device chosen). The latter questionnaire was optimized for mobile completion, and respondents could choose whether they wanted to complete the survey on their mobile phone or on a regular desktop. Results show that a substantive number of respondents (57%) used their mobile phone for survey completion. No differences were found between mobile and desktop users with regard to break offs, item nonresponse, time to complete the survey, or response effects such as length of answers to an open-ended question and the number of responses in a check-all-that-apply question. A considerable number of respondents gave permission to record their GPS coordinates, which are helpful in defining where the survey was taken. Income, household size, and household composition were found to predict mobile completion. In addition, younger respondents, who typically form a hard-to-reach group, show higher mobile completion rates.
Introduction
In the last decade, web surveys have become one of the major modes of data collection in social and market research. An important implication of web surveys is that researchers have little control over the time, place, and device the survey will be completed on. In addition, researchers never know exactly how a questionnaire will be visually presented to respondents due to the use of different browsers and personal settings on different Internet-enabled devices.
A recent development is the use of mobile devices such as smartphones for completing online surveys. Many mobile web surveys are being piloted despite the absence of methodological research on their design (Peytchev & Hill, 2010). Desktop and mobile surveys share many characteristics that affect how questions are interpreted and how responses are edited. They both draw on visual, technological, and self-administered principles. Despite these similarities, methodological research is needed to see if and when differences occur between mobile and desktop surveys due to coverage, sampling, nonresponse, or measurement error.
In this article, we use data from the probability-based online research panel of Market Response 1 in the Netherlands. In recent years, many panel members requested the survey management to enable completion of the surveys on mobile phones. Previous software was not able to optimize surveys to mobile phones.
This article reports on a pilot study that was carried out with new software that allows automatic optimization of the questionnaire based on the device used by the respondent. Panel members could decide for themselves whether they wanted to complete a survey online using a normal computer (desktop) or on an Internet-enabled mobile phone. The old software was used for a parallel survey. In our analysis, we focus on the new, adaptive survey software and only report results of the parallel survey if it shows additional insights. We look at response rates, sample composition differences, and differences in response effects between mobile and desktop users. In addition, we take into account the evaluation of the questionnaire, the added value of global positioning system (GPS) coordinates available via mobile devices, and we investigate whether offering of a mobile mode helps in attracting hard-to-reach groups such as young people.
Background
In the last decade, survey research has seen a shift from face-to-face, mail, telephone, to web being the dominant mode of data collection in social science and market research. In recent years, web surveys are being completed on a range of different devices: normal desktop PCs, portable devices (laptop), and mobile devices (tablet, smartphone, etc.). With mobile phones being able to send text messages, take photos, connect to the Internet, and so on, the blurring of boundaries between devices is a fact. Although mobile devices themselves vary in their size and functionality, they are distinct from their larger counterparts such as desktop computers. Mobile devices are mobile and have smaller displays, touch screens, and different methods of navigation. This may limit the amount of information that can be placed on a mobile phone screen and it can also affect how a survey is comprehended and completed. Mixed device surveys, where one survey is completed on a large variety of Internet-enabled devices, are not only becoming common but also will become more prominent in the future. Each new technology enhances and extends the range of possibilities for survey research but often also introduces new challenges. Two of the main concerns with mobile surveys are coverage and measurement errors.
Mobile web penetration is increasing, but there is still a large subset of the population that does not own a mobile device. In 2011, about half of all Dutch people aged 12 to 72 with access to the Internet accessed the Internet via a mobile phone (Eurostat, 2012; Statistics Netherlands, 2013) and one of the five persons opened their unread e-mail messages on their smartphone (Emerce, 2011). In 2012, individuals in the European Union (EU) aged 16–74 years made slightly more use of mobile devices than of portable computers (including laptops, netbooks, and tablets). The share of mobile phones in Internet usage by young people (16–24) was at 58% almost 5 times higher than the share of 12% for the population aged 55–74 (Eurostat, 2012).
Fuchs and Busse (2009) compared mobile phone coverage statistics from 2005 to 2007 and concluded biases declined over time. Although a rapid increase can be seen in the number of mobile phone users in recent years, there are still important sociodemographical differences between those who own a mobile phone (and in particular a smartphone) and those who do not. In their investigation of coverage bias of mobile web surveys across European countries, using Eurobarometer data of 2007, Fuchs and Busse (2009) find marital status, age at last educational degree, gender, age, and type of community (urbanization) to significantly predict having mobile web access. The coverage bias was largest for age, followed by the education variable. Fuchs and Busse demonstrate that coverage bias in the Netherlands is higher for gender compared to the average in Europe, but smaller for level of education, age, and type of community. Lynn and Kaminska (2012) ran logistic regression models on data from Hungary predicting mobile phone use and found the only significant predictor to be age. Gender, education, income, employment status, occupation type, Internet access, self-reported interest in politics, and urbanization were not significant predictors of completing the survey on a mobile phone.
De Bruijne and Wijnant (2013) further report that 29% of the panel members in the Dutch CentER Panel 2 own a smartphone. This figure is based on the answers given to a survey in a probability-based household panel with equipment provided to non-Internet households. Young people, people with higher education and men had higher probabilities compared to their counterparts. The usage of smartphones for survey completion in this panel however appeared to be very low (0.9%). 3 Bosnjak 4 et al. (2013) compared seven independent samples from market research access panels and one probability-based panel (GESIS Pilot Panel) in Germany and found that on average 6% of their respondents accessed the survey via their mobile phone. Couper (2013) discusses similar rates for different populations such as students and consumers in the United States. Bosnjak et al.’s. (2013) analysis of respondent characteristics showed that younger panel members and males were more likely to complete the survey on a mobile phone. Level of education and urbanization had no significant effect on the probability of mobile phone completion. Panel members without a partner and larger households had a lower probability of completing the survey on mobile. Remarkably, the use of mobile devices was inconsistent across waves; participation with mobile device did not guarantee later mobile participation.
In addition to coverage bias, measurement error is another important source of concern for using mobile phones in surveys. Mobile devices may have an effect on data quality due to their relative smaller screen size, lack of keyboard, touch screen, and so on. This can have serious implications for online surveys when they are not optimized for smaller screen size and mobile phone functionalities. Peytchev and Hill (2010) did not find significantly different answers while comparing mobile with desktop respondents, although they found some indication that respondents on mobile phones would select the same response category in the path of navigation more often. Bosnjak et al. (2013) found no differences in response quality when comparing the number of entries, the number of open-ended questions answered, and the number of characters entered on mobile phones in comparison to different online panels that work with desktop computers. The drop-out rate was higher for mobile (12% mobile vs. 6% desktop) but not at the cost of less data: More pages were completed and more open-ended questions were answered before dropout in the mobile versions. Lynn and Kaminska (2012) used seven indicators of satisficing and only found mean interview length to be longer for mobile interviews. Mavletova (2013) experimented with the length of the survey (5 min vs. 15 min) but found no effect of questionnaire length on the willingness to participate in the mobile survey, as well as on completion and break off rates. Mobile surveys may take longer but perhaps not at the expense of higher nonresponse. Mavletova (2013) shows that answers to open-ended questions were significantly shorter but contained similar content. Perhaps the most worrisome response effect in the literature is found in the study of Stapleton (2011) who finds that in horizontally aligned scales, leftmost options are endorsed more often on mobile phones. This primacy effect was not found in vertically aligned scales or in dropdown menus. Mavletova (2013) neither found evidence for primacy effects nor for the number of non-substantive answers related to mode. De Bruijne and Wijnant (2013) added evaluation questions to the questionnaire such as difficulty, clarity, and enjoyment, but they found no significant differences between mobile and desktop users. On the whole cognitive processing between desktop and mobile surveys appears to be similar.
The hope behind designing surveys for mobile devices is that it may decrease coverage and nonresponse errors without affecting measurement error (Couper, 2013). One of the advantages of mobile phones is the possibility for use outside the home. Mavletova (2013) found that whereas only 3% of desktop respondents filled out the questionnaire outside the home, almost 20% of mobile respondents completed the survey while not being at home. Adding mobile to regular web surveys could therefore increase response rates. This is not confirmed by current studies, however. Mavletova (2013) found lower completion rates for mobile. This is confirmed by de Bruijne and Wijnant (2013) in the Netherlands.
Based on the literature mentioned previously, we expect respondents who complete the survey on a mobile phone in our study to be younger, more educated, more often male, live in smaller households, and in more urbanized settings than respondents who complete the survey on a desktop computer. With regard to measurement effects, we expect no differences between the mobile phone and desktop PC respondents. We hypothesize the duration of the questionnaire to be longer for mobile.
Method and Implementation
In order to see what would happen (in terms of use, sample composition, response time, response effects, and evaluation) if a mobile-friendly option was offered to respondents, a pilot was conducted in the online probability-based panel of Market Response. Panel members are recruited through Random Digit Dialing (RDD). Non-Internet households are excluded from the panel. The Internet penetration rate as of late 2012 in the Netherlands is about 93% (Statistics Netherlands, 2013).
In June 2012, we fielded two parallel surveys. The sampling list included Dutch people aged 18 and older with access to the Internet and in possession of a smartphone who were previously recruited to the panel. In the pilot, Confirmit software, which created a web-based questionnaire, used a responsive design; panel members could decide on which device they wanted to complete the survey. The questionnaire was a short questionnaire (approximately 5–10 minutes, about 12 questions) about buying clothing. It was optimized for mobile completion; it did not contain any grids or long scales. For the Confirmit survey, some questions were added at the end of the survey about recognizing Quick Response (QR) codes and giving permission to use panel members’ GPS coordinates. Screenshots of questions are presented in Appendix A to show the visual difference between mobile and desktop completion. Of course, variation in visual layout differs per person since it is dependent on the used device and personal settings. In our analysis, we focus on the pilot Confirmit survey. A parallel survey with standard software (QSL), not optimized for mobile phones was run simultaneously, but we only report results of the parallel (standard) survey if it shows additional insights.
Respondents received a standard invitation via e-mail announcing the survey, and showing an individualized URL that would lead respondents straight to the questionnaire. In the Confirmit invitation, a message was added that the survey was suitable to be completed via a smartphone, but other than that invitations were the same in Confirmit and QSL. If panel members chose to start the survey on a desktop, they again received a recommendation to complete the survey via their smartphone. They could then again refuse and complete the survey via their regular desktop.
We look at the proportion of mobile respondents to see whether people can be made to complete a survey on a mobile phone and the propensity to use a mobile phone for survey completion to investigate coverage bias. We particularly focus on whether offering a mobile mode attracts more respondents from hard-to-reach populations such as young people. Major reasons for nonresponse mentioned by younger panel members are “don’t feel like it” and time issues. Since this is also the group that uses mobile devices frequently, we investigate whether offering a survey that is suitable for smartphones would increase their participation and hence balance response probabilities within the panel. 5 In addition, we do within Confirmit comparisons (mobile vs. desktop) for response rates, response effects, and evaluation of the questionnaire. We also look at the possibilities of using GPS coordinates.
Note that differences we find between mobile and desktop completion within the Confirmit survey may be due to differential self-selection, rather than the measurement properties of the device. We do not use an experimental design, but want to answer the question what happens when you offer a mobile phone completion option in a survey: How many respondents (mobile phone owners) use it, which sociodemographic characteristics predict mobile use, does it help in reaching younger people, and are there notable response differences between people who use mobile and people who use desktop.
Results
By identifying user agent string information at the start and end of the interview we checked whether respondents participated on their smartphone or not and whether they switched during the survey. Consistent with de Bruijne and Wijnant (2013), we used the information on the browser that was used last by the respondent. Unfortunately, we had no information when the respondent switched devices if that happened. We hypothesized that switching would rather occur at the beginning of a survey (because of inconveniencies) than at the end. We define mobile devices as being smartphones with Internet access. We have repeated all our analyses defining mobile devices as being mobile computers with a touchscreen (e.g., including tablet computers), but we found no differences in our results.
Response
In total, 979 respondents were invited to the Confirmit survey, of whom 443 responded, leading to a completion rate of 45% (Callegaro & DiSogra, 2008). In the QSL parallel survey, 984 respondents were invited, and 504 of them completed the survey on their desktop (completion rate 51%).
Of the 443 people who participated in the Confirmit survey, 252 (57%) respondents completed the entire survey on their mobile phone. Thirty-three (7%) people switched from desktop to mobile during the survey. Because we assume most of the switches were made right after logging in to the survey, we have treated these respondents as being in the mobile phone condition (n = 285) Four (1%) people switched from mobile to desktop and were not included in our analyses; 154 (35%) respondents completed the questionnaire on a desktop.
Propensity to Use Mobile
We use a range of sociodemographic variables to investigate which variables predict the use of a mobile phone for completing the survey. Results can be seen in Table 1.
Logistic Regression on Mobile Phone Use for Survey Completion.a
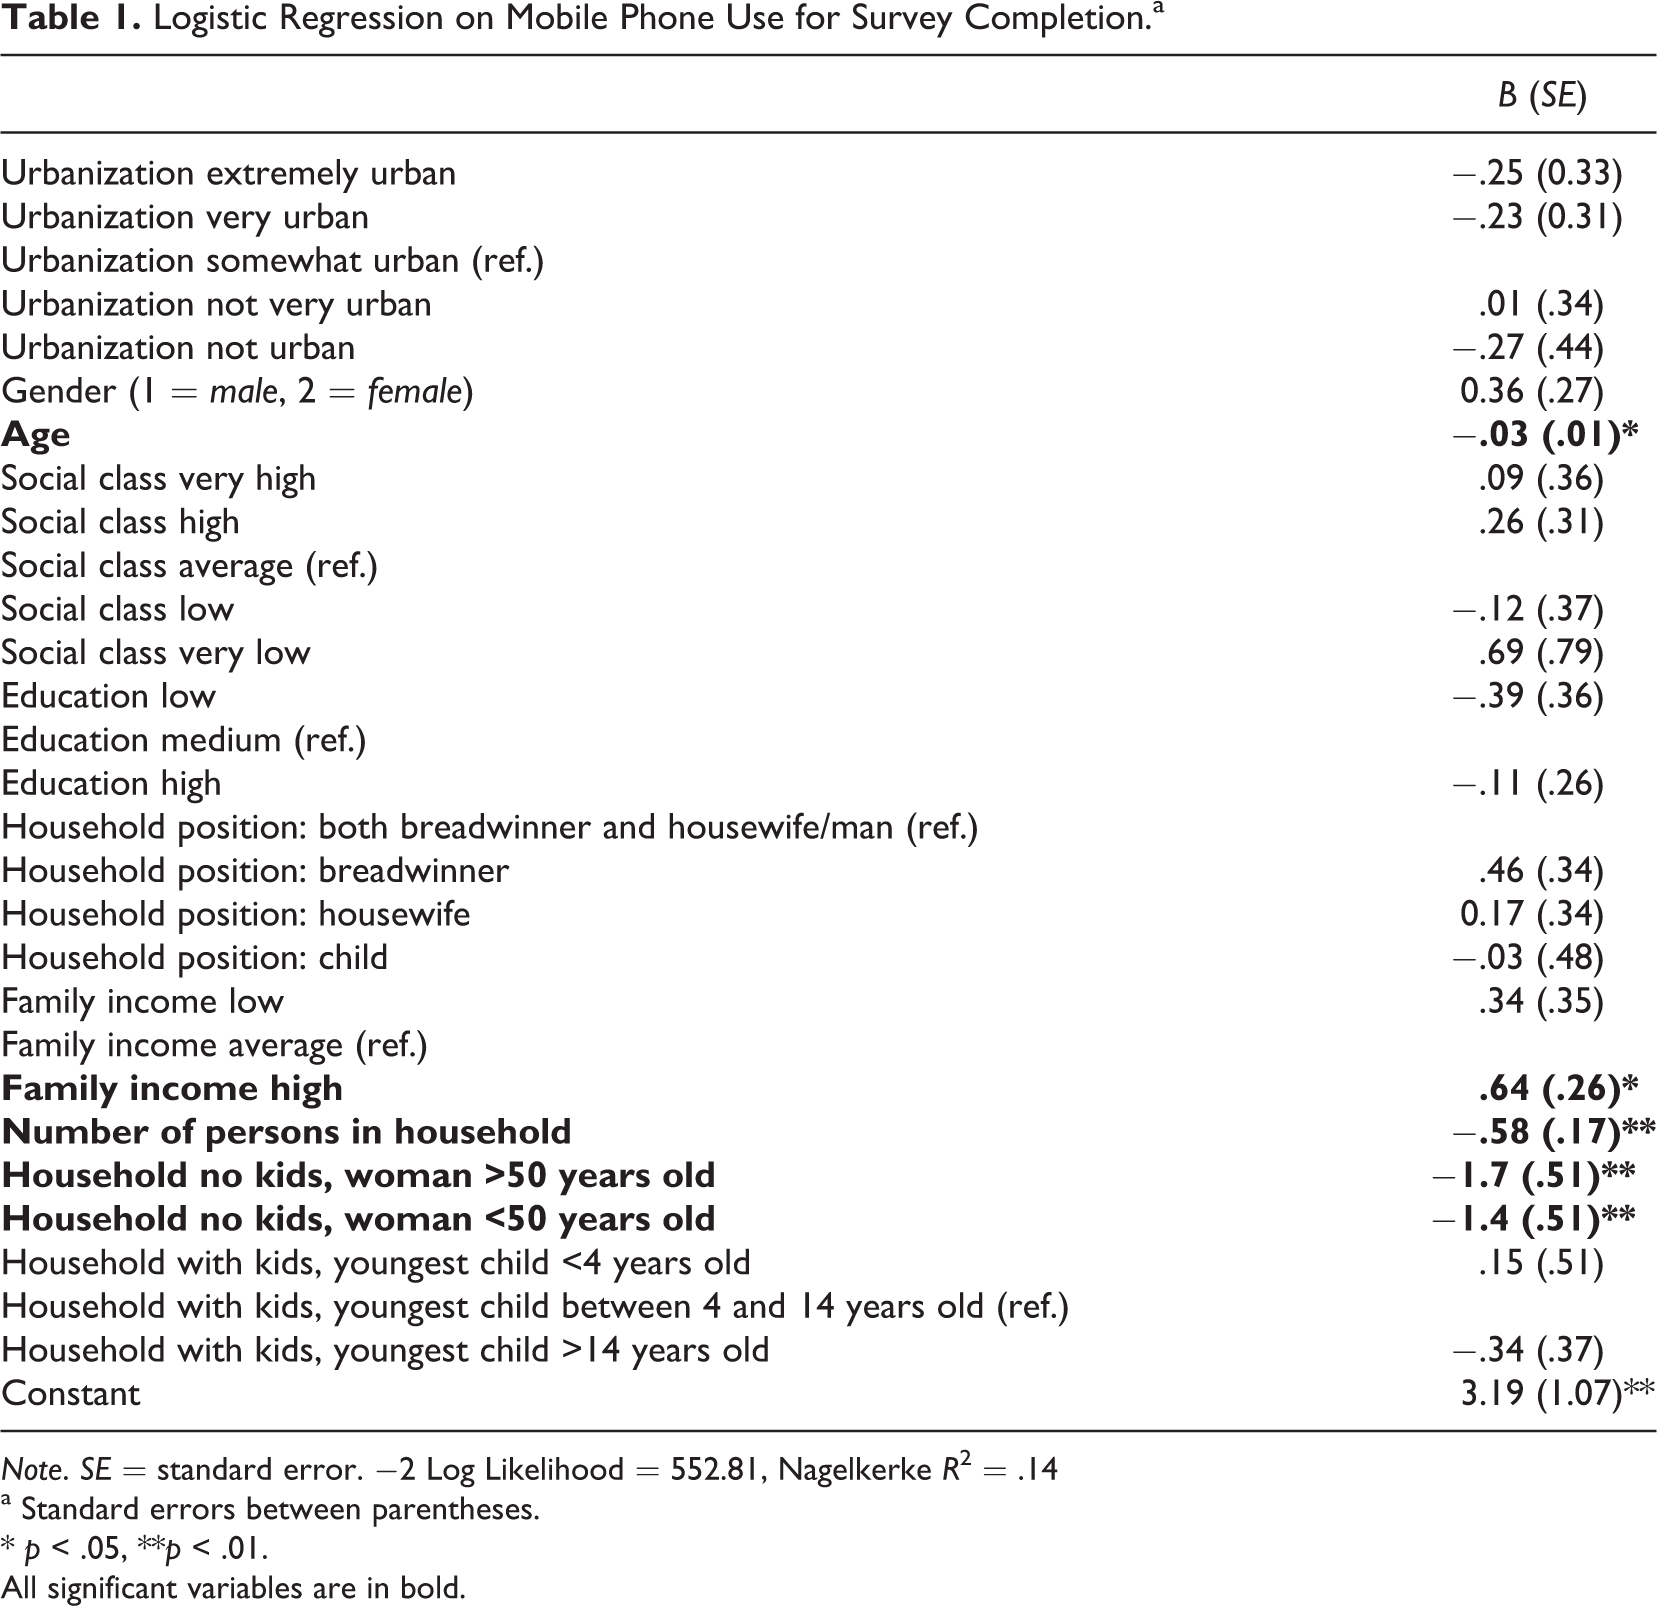
Note. SE = standard error. −2 Log Likelihood = 552.81, Nagelkerke R 2 = .14
a Standard errors between parentheses.
* p < .05, **p < .01.
All significant variables are in bold.
Based on the literature, we hypothesized the variables age, education, gender, urbanization, household composition, and household size to predict the use of mobile for online survey completion. Table 1 shows that age, income, household composition, and household size are predictors of mobile completion. Variables gender, education, and urbanization did not affect mobile completion. Households without children where the woman is older than 50 show the lowest propensity of mobile completion, 6 followed by households without children where the woman of the household is younger than 50 years. The presence of children in the household is therefore a positive predictor of mobile completion. In addition, the more persons live in the household, the lower the probability of mobile completion. Respondents with a high family income have a higher propensity to use mobile than respondents with medium or low family income. Age is the weakest significant predictor in the equation. Offering mobile increases participation of the hard-to-reach young people in the survey, but the effect is not large. 7 When we run crosstabs with the significant predictors of mobile completion (age, income, number of persons in household, and household composition), we see that the difference between categories is about 3–5 percentage points. For example, persons with a high family income have a 3% points higher mobile completion rate than people from medium or low family income.
The propensity for mobile completion is not correlated with typical online activities such as online shopping or the knowledge about QR-codes. The mean percentage of online shopping is 21% for mobile completion (21% of shopping is done online) versus 22% for desktop completion. In addition, there is no significant difference, χ2(2) = 1.23, n.s.) between mobile (90%) and desktop (87%) completion in the percentage of people who have ever seen a QR-code.
Response and Break Offs
There are few respondents who break off during the questionnaire. Of the 285 respondents who start the questionnaire on their mobile phone, only four quit the questionnaire before reaching the end. Of the people who participate on a desktop computer, only three respondents quit. This is probably related to the relative short length of the questionnaire.
The time it takes respondents to complete the questionnaire does also not differ across devices. Figure 1 shows that respondents generally need the same time to complete the survey. The mean response times only differ 5 s (245 s on desktop, 250 s on mobile, t(433) = −0.31, n.s.).

Time taken to complete survey on either a desktop or a mobile device.
Response per Day and Reminder
Figure 2 shows the time respondents took to start the questionnaire after receiving the invitation for the survey. Here we compare the Confirmit survey with the parallel survey in the standard QSL software. On the first day after invitations were sent, about 35% of final respondents in the QSL (parallel)-mode completed the questionnaire. For both mobile and desktop, this percentage was about 50%. Other than that, the days it takes respondents to complete either in the mobile or in the desktop mode is very similar. The effect of the reminder is similar across modes. So overall, respondents do not respond more quickly after the invitation is sent out on a mobile phone than on a desktop. However, in both the mobile phone and the desktop conditions, a greater percentage of respondents complete the survey on Day 1 than in the QSL condition. This could be due to the fact that the survey invitation announced the new survey software, and some respondents might have been excited about trying that out.
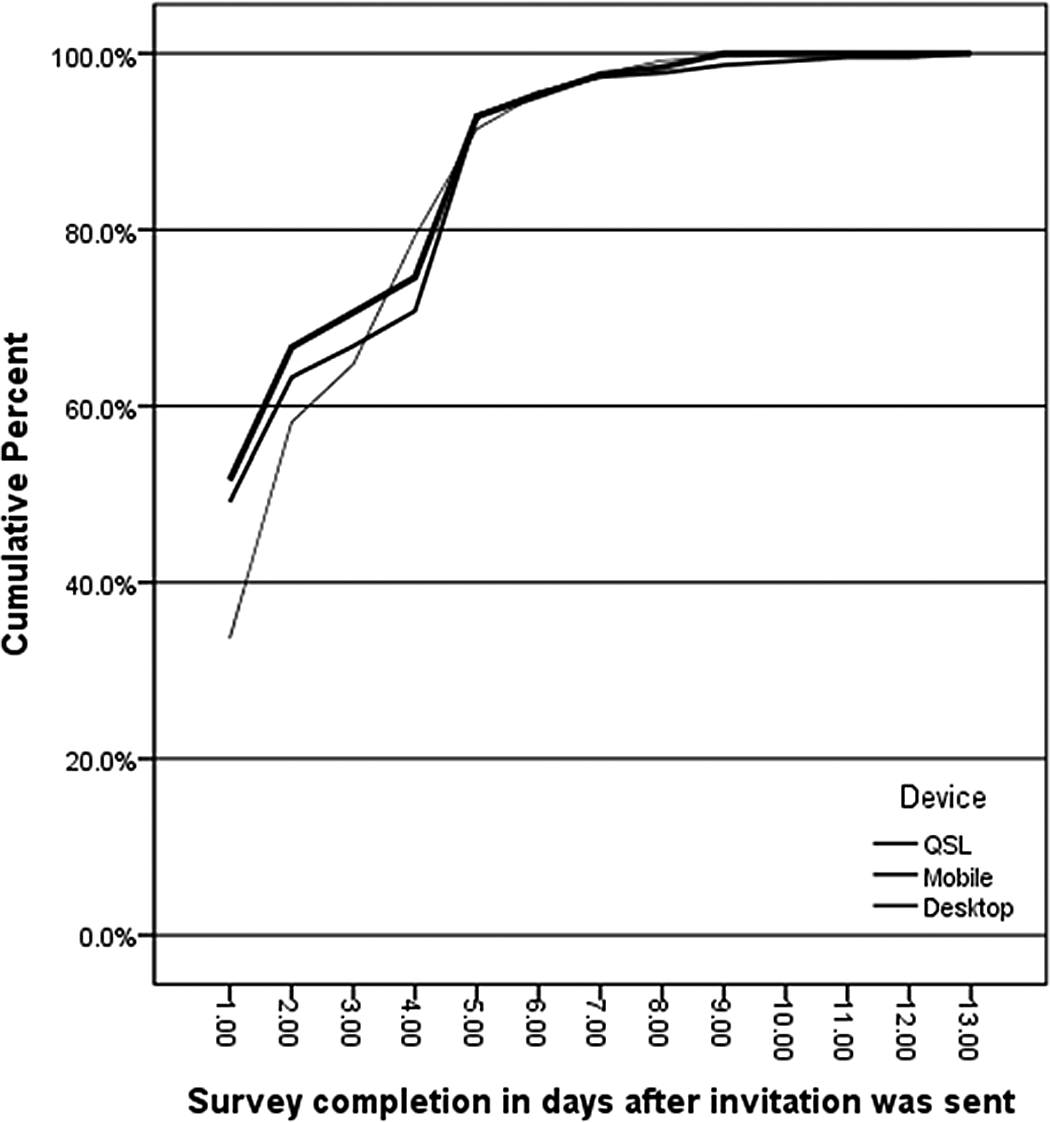
Timing of questionnaire completion after invitations were sent. A reminder was sent at day 4.
Response Location and GPS
We asked every respondent (on desktop and mobile phone) whether they would allow us to record GPS data. From the mobile completion group, 26% agree and give permission to use their GPS coordinates. Another 24% of desktop users is willing to give us their GPS coordinates, 8 χ2(1) = .13. This difference is not significant.
In order to code the location, we simply took the exact GPS coordinates, and searched online (there are several geolocation websites) for the exact location of each coordinate. We then plotted all coordinates on a map (see Figure 3), and from this, coded where the survey was completed.

Map of the Netherlands with locations of survey completion.
Table 2 shows the location of people who gave permission to use their GPS coordinates while taking the survey (mobile only). About 70% is inside their home, but a considerable number of people completed the survey at work (14%), on the road (11%), or outside (6%). The map shown in Figure 3 shows the locations where the survey was completed. Such maps are helpful to determine where respondents complete their questionnaire. Additionally, geocodings may provide helpful paradata on the surroundings of the respondent at the time of the interview.
Location of Respondents Who Sent Their GPS Location.
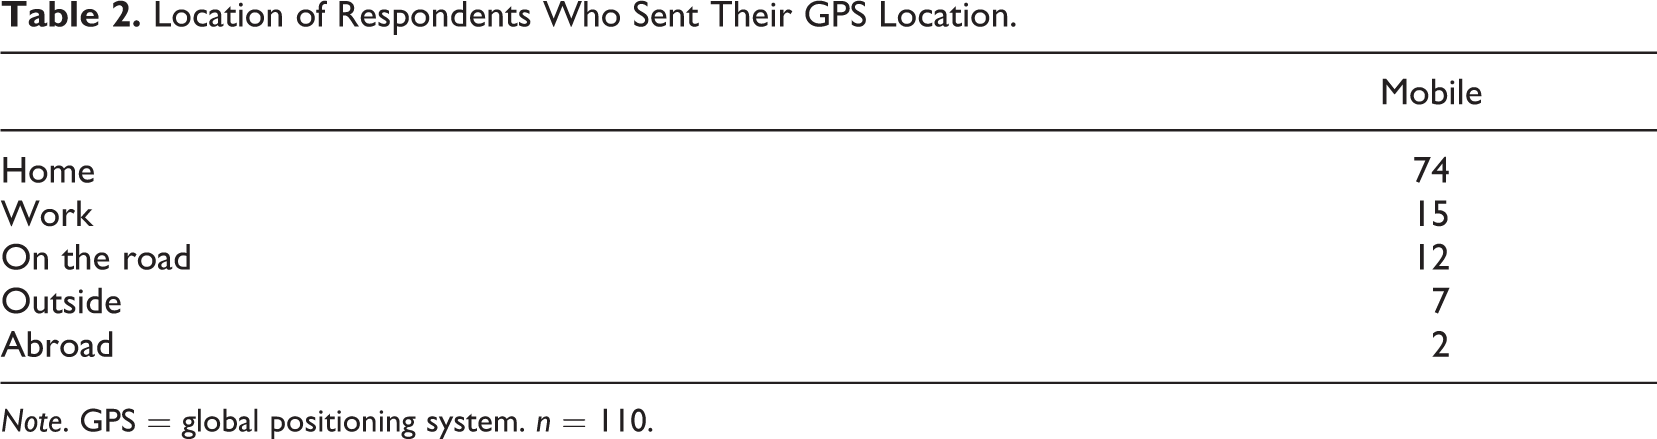
Note. GPS = global positioning system. n = 110.
Evaluation of the Questionnaire
At the end of the survey, respondents were asked to give a score for the questionnaire on a range from 0 to 10. Table 3 shows no significant differences in the evaluation of the questionnaire between mobile and desktop completion, χ2(2) = .51, n.s. Half of respondents give a neutral judgment (6–7) and a little more than 40% a positive judgment (8–10). Here we compare the Confirmit survey with the parallel survey in the standard QSL software. Again we find no significant differences in evaluation between questionnaires, χ2(4) = 4.60, n.s. This suggests that respondents did not experience the QSL software differently than the Confirmit software.
Respondent Evaluation of the Questionnaire.
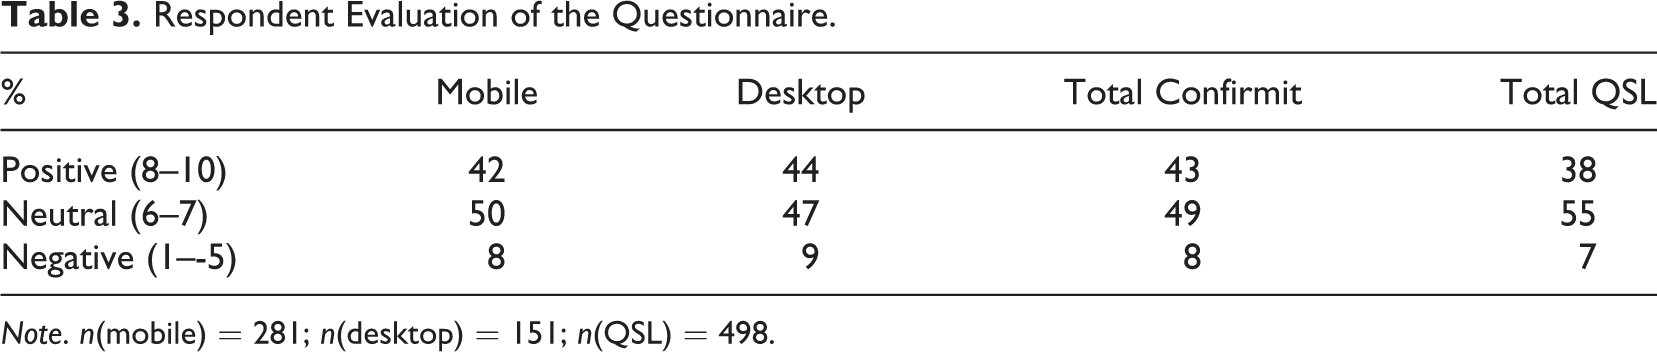
Note. n(mobile) = 281; n(desktop) = 151; n(QSL) = 498.
Response Quality
The differences between the responses given by mobile phone or desktop are as expected very small or nonexistent. Table 4 shows the length of the answer to an open-ended question that asked respondents about the reason for choosing a specific store as being the best clothing store in the Netherlands. Respondents could skip this question by giving no answer, and we find that about 33% of respondents do so. There is no significant difference in the number of “no answers” between mobile phones and desktop PCs. Also, we find the length of the substantive answers (more than 0 characters) given on mobile phones and on the desktop to be very similar. The average length of the open answers was 24 characters on mobile phone, and 28 on desktop, but this difference was not significant, t(437) = 1.52, n.s.
Length of Open-Ended Answers on Question About why Respondents Like their Favorite Shop.
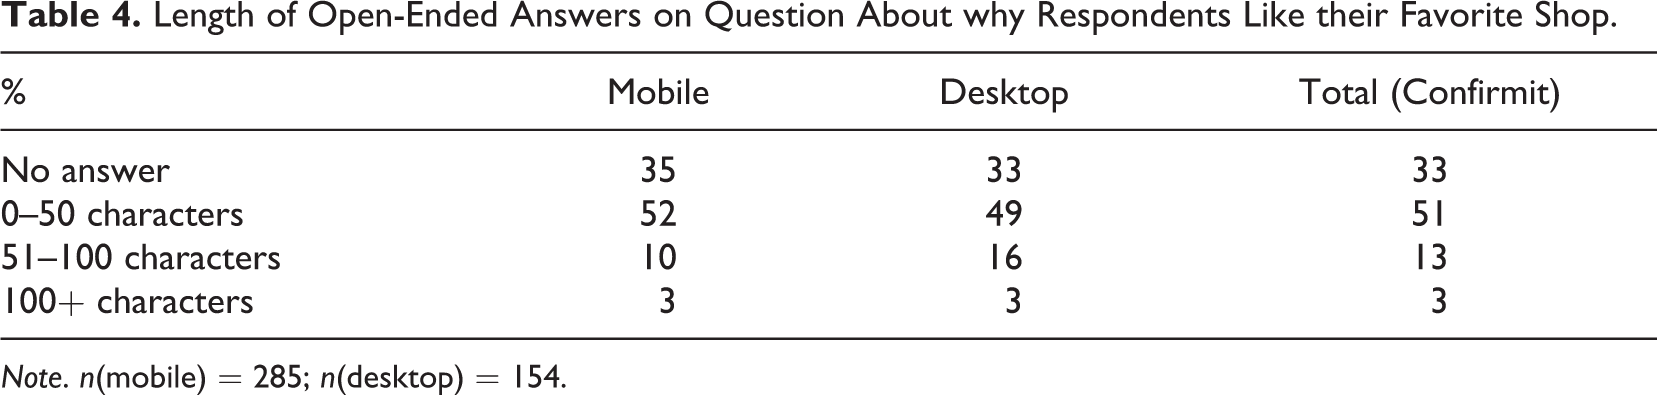
Note. n(mobile) = 285; n(desktop) = 154.
As a second indicator for data quality, we looked at the item non-response on three questions. We found that both on mobile phones and desktop, 7% of respondents did not answer one or more of these questions.
Third, we looked at a “check-all-that-apply” question (the number of the eight largest clothing shops that respondents indicated to have visited in the past year). We find in Table 5 that again, the distribution, as well as the mean number of shops reported to be very similar on mobiles and desktops.
Number of Shops Visited in the Past Year.
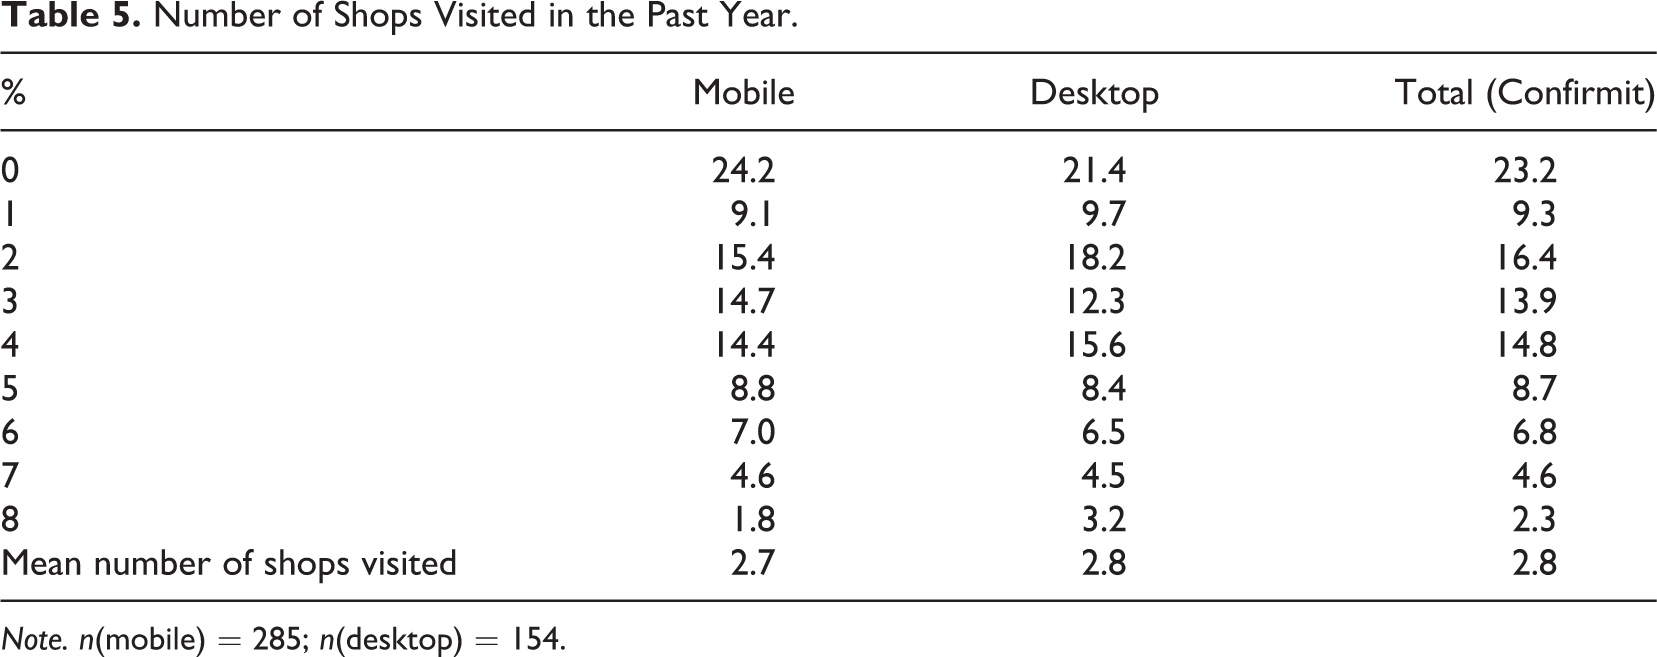
Note. n(mobile) = 285; n(desktop) = 154.
Finally, we looked at the percentage of respondents who chose the first category for the question on “how often one buys clothes in a store nearby.” The first answer category on this question reads “more than once a week.” It is highly unlikely that anyone would buy clothes in a shop nearby more than once a week on average. Although we do not exclude the possibility that some individuals may do this, Table 6 shows only 1 respondent who gave this answer on a desktop PC (0.6%), and 11 respondents on a mobile phone (3.9%). This may indicate the tendency for a primacy effect, or satisficing, on a mobile phone among a small group of respondents. The overall effect on the distribution is however not significant, χ2(5) = 6.467, n.s.
Frequency of Buying Clothing in a Shop Nearby.
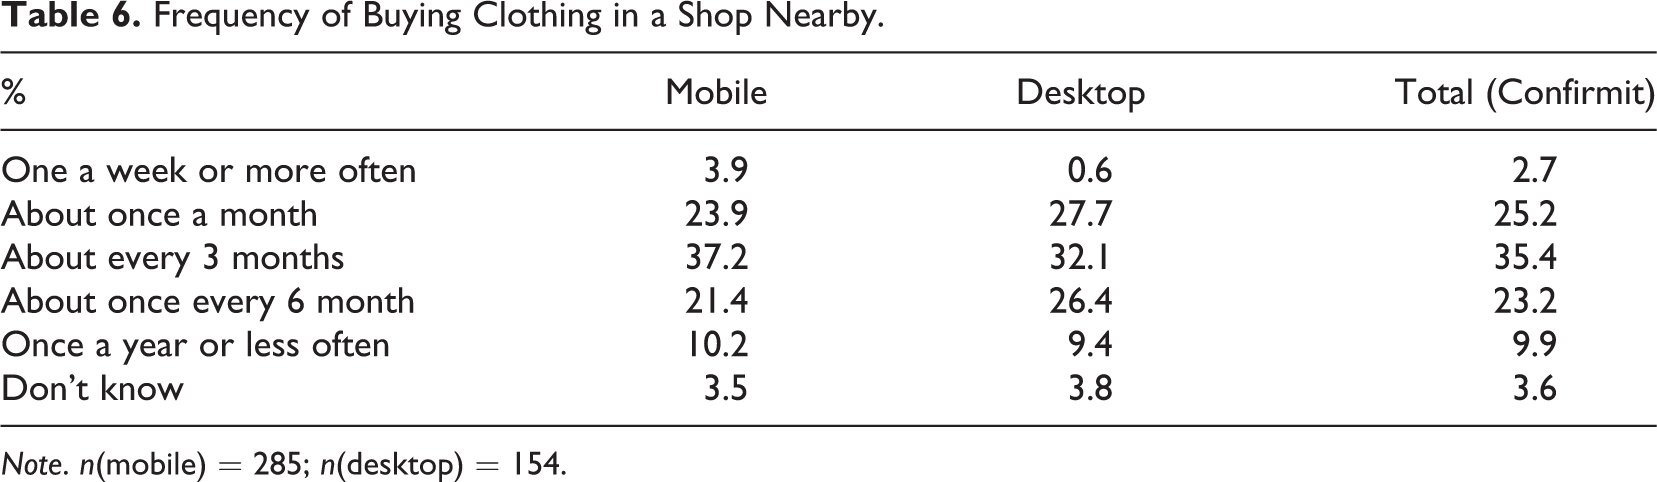
Note. n(mobile) = 285; n(desktop) = 154.
Discussion and Conclusion
This study has demonstrated that it is not problematic to offer a mobile phone completion option to a web panel. We found no large measurement differences between the mobile and desktop groups in our survey. In our case, there was not a lot gained either, as panel respondents were generally happy to complete surveys on a desktop. Also we did not find large differences in the sample compositions of the two survey modes. In that sense, mobile phones seem to work just as other Internet devices once the questionnaire is optimized for mobile completion.
Our questionnaire was relatively short and easy to complete. Optimizing lengthy and difficult questionnaires for mobile completion could be a problem. Future research could benefit from investigating difficult or lengthy questionnaires with for example many item batteries. This could give more insight into response effects in mobile phone surveys that were rather difficult to estimate from the simple questionnaire we used. Also, future studies should investigate whether the selection effects as we find them, are similar, or perhaps different depending on the population studied and the topic of the survey. As smartphone penetration rates differ across populations, this is necessary if researchers want to use mixed-device surveys on a larger scale. It is also important that future studies design experiments in such a way that selection and measurement effects cannot interact. This can be done by randomly assigning people to a particular device after a respondent has agreed to participate. Note, however, that respondents cannot be forced to use a particular device. Selection effects are hard to rule out unless a study is conducted in a lab setting where devices are distributed. It was not the aim of this study to disentangle selection and measurement effects, but merely to demonstrate how mobile phones can be integrated as a survey mode in a mixed-device survey. Future research could add variables such as mobile web usage and frequency to further explain selection effects.
The fact that the use of mobile surveys is still restricted to a relatively small (but increasing) group of users makes it difficult to generalize conclusions from our study to the general population. This study only reveals income, age, and household composition to be significant predictors of mobile phone use for survey completion. The extent to which coverage bias forms a serious problem depends on the survey and the mobile penetration rate in the country where the survey is taken. Offering a mobile option helps in increasing response probabilities of hard-to-reach groups such as young people, although the overall effect is not very large.
Lynn and Kaminska (2012) argue that mobile interviews suffer from issues as multitasking, distraction, and the presence of others while doing the survey. Evidence that this affects the quality of responses is lacking, however. This study confirms the results in the literature that the completion of an online survey on a mobile phone involves little measurement differences compared to desktop surveys. We also did not find significant differences in the frequency of item nonresponse depending on whether mobile phones or desktop PCs were used.
What seems certain is that survey modes will continue to evolve, both in response to societal changes in how people communicate and in response to technological developments that make new ways of communicating and collecting data possible (Couper, 2011). By using mobile phones as a way of survey data collection, continuous measurement in surveys becomes feasible. Another advantage of mobile surveys is that they make it possible to use probability-based techniques such as RDD, hence making it possible to draw a probability-based sample for online surveys. It can be expected that mobile surveys can benefit from decades of improvement in RDD such as efficient sampling and call scheduling algorithms (Peytchev & Neely, 2013). Further improvements in the data collection procedures for mobile surveys can be expected, relying on the advantages of both RDD (probability sampling) and self-administered web surveys.
Mobile surveys offer new possibilities. Since the device is originally based on aural communication, it seems relatively straightforward to use both the aural and the visual channel of communication and enrich the survey. For example, interviewer characteristics can be added to the web survey. This can be done by adding a real interviewer to the survey, adding a virtual interviewer, or merely rely on interviewer techniques such as probes. Smartphones can already deal with voice, text, visual material such as videos and images, spatial position such as GPS, motion (accelerometers), and so on. Apps are available to convert voice messages to text and vice versa.
In web surveys, respondents have full control over whether, when, and in what way they choose to answer the survey questions. If the respondent gives consent to record paradata, a researcher knows exactly when, where, and on what device the survey is taken. Privacy issues become more relevant than ever before in survey research. Should researchers ask consent for recording paradata (asking often means a lot of refusals) and how should these data be treated? For example, while using the data for this article we knew for many respondents where they lived, worked, and which route they traveled to work. Information in our view should not be available to the researcher analyzing the data; this information should be available to panel managers only. However, GPS data potentially can contribute greatly to answering substantive research questions that we collect survey data for. The data that researchers have to analyze are becoming much richer but also correspondingly more complex. It seems to be important to make paradata such as GPS coordinates easy to process and analyze so that it is useful for methodological research.
Adapting web surveys so that it is easy to complete them on mobile phones seems an important step in optimizing survey design. Vehovar, Berzelak, and Lozar Manfreda (2010) have developed a metric for evaluation of costs and errors in competing survey modes. With a given cost model, within a given sampling error estimation model, and within a given model for the rate–bias relationship, it can be calculated what the selection of the most appropriate solicitation and data collection mode would be. It is important to take total survey error into account when choosing for the optimal method of data collection.
Footnotes
Appendix A
Acknowledgments
The authors would like to thank Market Response, in particular Koos in‘t Hout, for providing us with their data and support. In addition, we would like to thank the anonymous reviewers for helpful comments on the article.
Declaration of Conflicting Interests
The authors declared no potential conflicts of interest with respect to the research, authorship, and/or publication of this article.
Funding
The authors disclosed receipt of the following financial support for the research, authorship, and/or publication of this article: Part of the research is sponsored by the Dutch Organisation of Scientific Research.