
Abstract
The Internet is considered an attractive option for survey data collection. However, some people do not have access to it. One way to address this coverage problem for general population surveys is to draw a probabilistic sample and provide Internet access to the selected units who do not have it and accept to participate. This is what the knowledge panel and the Longitudinal Internet Studies for the Social sciences (LISS) panel do. However, a selection effect is still possible. Units without previous Internet access might refuse to participate in a web panel, even if provided with the necessary equipment. Thus, efforts to provide the necessary equipment may not be worth it. This article investigates the gain in terms of representativeness of offering the equipment to non-Internet units in a web panel using tablets: the French Longitudinal Internet Studies for the Social Sciences panel. We find that the number of non-Internet units who accept to participate is low. This is not only due to the fact that their response rates are lower but also to the small proportion of non-Internet units in the French population. In addition, they participate less in given surveys once they become panelists. At the same time, they are very different from the Internet units. Therefore, even if because of the small number of units, the overall gain in representativeness is small, there are a few important variables (e.g., education) on which their inclusion yields a more representative sample of the general population.
Probability-Based Online Panels to Study the General Population: Attractions and Challenges
While Internet coverage is quite high in Northern Europe (e.g., 96.5% in Iceland and 95.0% in Norway), it is lower in other European countries (86.2% in Germany and 83.3% in France), especially in Southern and Eastern Europe (62.1% in Portugal, 58.5% in Italy, 49.8% in Romania, and 41.8% in Ukraine) (Source. http://www.internetworldstats.com/stats4.htm#europe, penetration 31 December 2013). As a result, using the Internet to survey the general population raises to coverage issues. Indeed, people with Internet access differ from those without it in several characteristics, such as age, income, and education (Couper, 2000; DiSogra, Callegaro, & Hendarwan, 2009; Pedraza & Serrano, 2014; Zhang, Callegaro, Wells, & DiSogra, 2010). If these variables are related with the topic studied, results may be biased. It would therefore seem necessary to include these individuals in order to achieve a representative sample of the general population.
One way to deal with that problem consists of using a mixed-mode approach (Dillman, Reips, & Matzat, 2010) in which the sampling units who do not have Internet access are offered an alternative mode of data collection, for instance, face-to-face (e.g., GESIS panel in Germany, Source. http://www.gesis.org/en/services/data-collection/gesis-panel/), mail, or telephone (e.g., the American Trends Panel, Source. http://www.pewinternet.org/2014/10/22/methods-the-american-trends-panel-surveys-atp/ or the AmeriSpeak panel, Source. http://www.norc.org/Research/Capabilities/Pages/amerispeak.aspx). Rookey, Hanway, and Dillman (2008) find that allowing non-Internet units to answer by mail in the Gallup panel brings in respondents with different sociodemographic characteristics and improves the results in a way that could not be reproduced by post-stratification weighting, suggesting that the inclusion of panelists without Internet access is crucial. However, the mixed-mode design is costly, in terms of money, time, and organization. There is also a risk that data coming from different modes might not be possible to combine due to different levels of measurement errors or social desirability (Dillman et al., 2009). Another approach is to provide Internet to the sampling units without it. The main advantage is to have only one mode of data collection. The downside is that costs are often even higher than those of a mixed-mode design. One way of addressing this issue is to switch from single surveys to panels, so that the main effort to recruit respondents only has to be made once, at the beginning. The same respondents can then participate in different surveys. We are interested in the performance of this second approach. In these panels, the sampling units are randomly selected from the general population, independently of whether or not they have Internet access. Then, in order to include all the units who agree to participate, the panelists are provided free Internet access (device and/or connection).
The idea of drawing a probability-based sample and providing the necessary equipment to answer the survey was first implemented in the Netherlands in the ‘90s with the Telepanel (Saris, 1991, 1998). When the Internet appeared, the knowledge panel in the United States (Source. http://www.knowledgenetworks.com/knpanel/KNPanel-Design-Summary.html) and the LISS panel in the Netherlands applied a similar idea (Source. http://www.lissdata.nl/lissdata/About_the_Panel). In both cases, if the households did not have computers and/or Internet access, they were provided with the equipment and connection. More recently, a similar approach was used to create the Internet Panel (GIP Source. http://reforms.uni-mannheim.de/internet_panel/home/) and the Etude Longitudinale par Internet Pour les Sciences Sociales (ELIPSS, Source. http://quanti.dime-shs.sciences-po.fr/) panel in France. However, the latter one differs from the others in two important aspects: All panelists were provided with a device and an Internet connection (not only those without previous access) and this device was a tablet (not a PC). Discussions are also currently underway to create similar projects in several countries, including Norway, the United Kingdom (e.g., GenPopWeb network Source. http://www.natcenweb.co.uk/genpopweb/), and Southern Europe (Spain, Italy, Greece, Cyprus, and Portugal have expressed interest in creating similar probability-based online panels). While this approach may become increasingly popular, it also has some limitations.
Indeed, sampling units who do not have Internet access because they are reluctant or do not feel able to use it may refuse to participate in an online panel, even if provided with Internet access. Thus, a nonresponse bias related to the mode of data collection might still be present. Some empirical evidence supports this hypothesis: Hoogendoorn and Daalmans (2009) found that the proportion of PC owners who accepted to participate in the Dutch online CentERpanel was much higher than the proportion of non-PC owners (Source. http://www.centerdata.nl/en/about-centerdata/what-we-do/data-collection/centerpanel). Leenheer and Scherpenzeel (2013) also observed that recruitment rates for the non-Internet households were much lower than those for households with Internet access (35% vs. 84%). If units refusing to participate differ from those accepting to participate, then the panel may not be representative of the population of interest, even if it is probability based and provides Internet access. Moreover, even if the panel as a whole is representative of the population of interest, the sample of respondents answering a specific survey may not be representative due to nonresponse errors. In the longer term, attrition (panelists dropping out of the panel) might appear and differentially affect Internet and non-Internet units.
Hence, a study of the representativeness of these panels is needed. Dennis (2010) provides a summary of analyses conducted on the representativeness of the knowledge panel: Knowledge panel survey samples are close to the U.S. census benchmarks for demographics. Van der Laan (2009) looked at the representativeness of the LISS panel at the household level. Compared to the general population and to the Labour Force Survey (LFS), he found that single person households, households with a high average age and with first-generation immigrants, are underrepresented in the LISS panel. Knoef and de Vos (2009) looked at the representativeness of the LISS panel at the individual level. They showed that the composition of the LISS panel differs significantly from the Dutch population with respect to household size, age, education, marital status, gender, and level of urbanization. Comparing the LISS with other surveys, they found that the LISS more accurately reflected some segments of the population (e.g., single-person households) but fell short on others (e.g., elderly representation). Furthermore, the composition of respondents to specific surveys differs from the panel. Scherpenzeel and Betlehem (2011) also studied the LISS panel and concluded that “an online panel can come quite close to a traditional survey when a correct sample design is used, but the undercoverage of the elderly and the non-Internet-using population is not entirely solved by providing these households with equipment and an Internet connection in order to participate. The undercoverage is, in the case of this panel, not present in the gross sample but is caused by nonresponse: the oldest respondents were more reluctant to accept the equipment offered to them and more unwilling to participate in the online panel” (p. 128). Blom, Gathmann, and Krieger (2015) found no major coverage or nonresponse biases in the GIP, despite some differences from the population.
Overall, it appears that even if these probability-based panels differ from the general population in some respects, their representativeness is relatively good. Nevertheless, providing a device and/or Internet connection to the units who do not have it is a costly operation in terms of time, organization, and money. Building a probabilistic online panel without having to provide Internet access to the units who do not have it sounds like a more realistic option given the time and budgetary constraints. Therefore, we can wonder: Is there a sufficient gain, in terms of representativeness, of including the units with no previous access to the Internet in the panel? Is this step really crucial to achieving representative online panels? Or would the representativeness already be acceptable if a probability-based sample was used but no Internet access was provided to the units without it?
This is what this article seeks to investigate. Many definitions of representativeness exist (Kruskal & Mosteller, 1979a, 1979b, 1979c). In this article, we will consider that the panel is representative with respect to variable i (e.g., gender or age or nationality) if the distribution of the variable i in the panel is similar to the one in the population of interest.
Previous research has studied the advantage of including people without Internet access in probability-based online panels. Van der Laan (2009) found that offering a free computer and Internet access had a positive effect on the representativeness of the LISS. Blom et al. (2015) obtained a similar result for the GIP: In particular, they found that including off-line households in the panel improved the representation of the elderly and female respondents. Leenheer and Scherpenzeel (2013) studied whether “it pays off to include non-Internet households in an Internet panel.” “The research question that [they] address is whether providing non-Internet households with a means of Internet access, which requires a substantial investment, significantly improves the quality of an Internet panel” (p. 18). They conclude that these households do indeed answer individual questionnaires more regularly are less affected by attrition and that the overall panel more closely reflects the population on a number of different characteristics when this group is included.
However, “a limitation is that [their] research studies a single panel [LISS] in a country with very high Internet penetration [The Netherlands]” (p. 28). In this article, we investigate a similar research question but for a different country, with a lower Internet coverage: France. We assume that if the Internet coverage is lower, people’s reaction to participating in an online panel will be more negative but that it will be even more important to include the non-Internet units. Moreover, we study an online panel with slightly different characteristics. First, the ELIPSS panel uses tablets instead of computers. Respondents might feel that it is easier to use a tablet (touch screen, no need to install it, etc.) and agree to participate even if they might have refused if they had to use a PC. Second, tablets and a third generation (3G) connection are offered to all panel members, and not just to those who did not previously have Internet access. Thus, all ELIPSS panelists use the same device and browser to answer questionnaires. This enables control over how questionnaires are displayed and aims for maximum measurement equivalence. We expect these two key points to affect the results and create differences from previous studies.
The second section provides information about the ELIPSS panel. Next, the third section discusses the definition of Internet access. In order to study whether there is an advantage to including units without previous Internet access, the fourth section considers gains in the number of extra units at different steps of the recruitment process and participation in individual surveys. The fifth section then looks at gains in terms of representativeness and participation. The sixth section presents the conclusions.
The ELIPSS Panel
The ELIPSS Panel is part of the larger Data, Infrastructure, Methods of Investigation in the Social Sciences and Humanities project, which is led by Sciences Po and includes seven French research institutions. 1 It is a probability-based Internet panel offering social scientists a service to produce nationally representative surveys. Researchers are invited to submit survey projects during calls for proposals. A scientific committee evaluates the applications. Eligibility is based on the project’s research purpose, with commercial use being excluded.
Since such a service to collect data for social sciences did not exist in France, a pilot study was set up to define the recruitment process, establish procedures for managing the panel and producing surveys, and develop software tools. The ELIPSS pilot started in 2012 and consisted of 1,039 panel members. The sample of 4,500 housing units in metropolitan France was drawn from the census by the national statistical institute (INSEE). The last step was to randomly select a person between 18 and 75 years old from the list of household members. Different contact modes were used: letter, phone, and face-to-face. The recruitment rate was 27% using the American Association for Public Opinion Research (AAPOR) Initial Recruitment Rate (RECR) definition (Callegaro & DiSogra, 2008).
The ELIPSS panel differs from similar survey systems in other countries by using mobile Internet as the main mode of data collection (Blom et al., 2016). A touch screen tablet and 3G unlimited data plan are provided to all panel members in exchange for their participation.
Providing tablets was expected to be an incentive for people to join the panel and answer the monthly surveys. Indeed, the penetration rate for touch screen tablets was low (9%) in France at the time of the pilot recruitment (2012). Contrary to other probability-based Internet panels, no additional monthly incentives are offered.
The ELIPSS annual survey aims to collect data on the sociodemographic background of panelists as well as on attitudinal and behavioral variables extensively used in social sciences. A preliminary representativeness study (Legleye, Cornilleau, Cousteaux, & Razakamanana, 2014) showed that the recruited sample lacks panelists over 64 years old or aged 18–24, who live in medium-sized towns or big cities, and who have low levels of education (less than the baccalaureate). The sample overrepresents the employed and students. These are classical biases in probability-based surveys. Fortunately, they did not grow from survey to survey.
Problems in Defining Internet Access
In order to study the gain in a probability-based online panel of providing an Internet connection to units who previously had no Internet access, we need to define “no previous Internet access,” bearing in mind that we are interested in knowing whether a given unit needs to be provided with equipment to complete web surveys. For years, it was implicitly assumed that to complete a web survey, respondents needed (1) a computer and (2) an Internet connection. But today, a non-negligible share of respondents access web surveys through smartphones or tablets (de Bruijne & Wijnant, 2014; Peterson, 2012; Revilla, Toninelli, Ochoa, & Loewe, 2014a; Wells, Bailey, & Link, 2013).
Furthermore, there are many ways of “having Internet access” (modem, access to 3G, and access through a friend or relative) and places (e.g., bars and restaurants) with free Wi-Fi access are becoming increasingly common. So how should we assess whether or not a person has “Internet access”? Meanwhile, while desktop PCs were often considered household devices, laptops, tablets, and especially smartphones could be considered more as personal devices. Defining the Internet connection at the household level consequently becomes quite problematic. A person with only a smartphone might spend several hours a day on the Internet but would researchers and respondents consider that this equipment suffices to participate in a web panel? On the contrary, take someone without an Internet connection at home who can easily answer surveys from his or her workplace, and even if we would provide him or her with an Internet connection at home, he or she would fill in the surveys from work after being provided an Internet connection at home, should he or she still be considered a non-Internet unit? Researchers setting up online panels modeled after the knowledge panel will have to carefully define this to remain the most cost-effective possible.
In ELIPSS, the information regarding Internet use came from two sources. First, during the recruitment process, one person in the household was asked questions about the household computer and Internet equipment. Second, the first survey, administered from December 2012 to March 2013, aimed to measure Internet access, digital practices, and participation in surveys before joining the ELIPSS panel. Only 90% of panel members were invited to participate in this survey because the last units to be recruited joined the panel only in April 2013. To facilitate comparisons with national statistics, most of the questions in this survey were drawn from the French Information and Communication Technologies Survey (ICT survey) [Enquête sur les technologies de l’information et de la communication (TIC)—2013, INSEE (producteur), ADISP-CMH (diffuseur)].
In order to gather the information for as many panelists as possible, we combined both sources of information. However, the information from the two sources was not always the same for a given unit. There are several possible explanations. First, the respondent during the recruitment phase may have been different from the panelist. Second, the formulations of the questions were slightly different (cf. Appendix A). During the recruitment process, people might not have thought about including smartphone access, and it was not clear to whom the “you” referred to: was it the person answering or all the persons in the household? Furthermore, the survey question focused only on the “principal residence.” Third, it is possible that the situation changed, since the questions were asked at different moments. Finally, measurement errors may have occurred.
Because of these differences, we crossed the two sources of information and obtained four different measures of Internet access:
Priority recruitment: we used the answer from the recruitment phase from all units for whom we had this information and completed it with the information from the survey for the units who only completed the survey.
Priority survey: the process is the same, but here we used the information from the survey for all units for whom it was available and completed it with information from the recruitment phase.
Priority no access: when we had the information from two sources and the answers differed, we considered that the unit had no access.
Priority access: when we had the information from two sources and the answers differed, we considered that the unit had access.
Because we are working with a panel, we differentiated the stages of the process: units who accepted at the household level (n = 1,335), units who signed the agreement (n = 1,039), and units who participated in the first survey on “digital practices” (n = 939). Using the four ways of classifying the panelists with respect to access, we looked at how many extra units were included at different stages of the process.
How Many Additional Respondents Were Gained?
Having a Computer at Their Disposal
First, previous research in various countries has shown that computers are still the main devices used to answer surveys (Revilla, Toninelli, Ochoa, & Loewe, 2014b). Although mobile devices can no longer be ignored, if researchers setting up a new web panel had to decide to which units a device should be provided, they would probably decide that those who only own a smartphone should be given another device. The situation is less clear for units who only have tablets, but Revilla, Toninelli, Ochoa, and Loewe (2014b) have shown that there are still few web panelists who own a tablet and no other device.
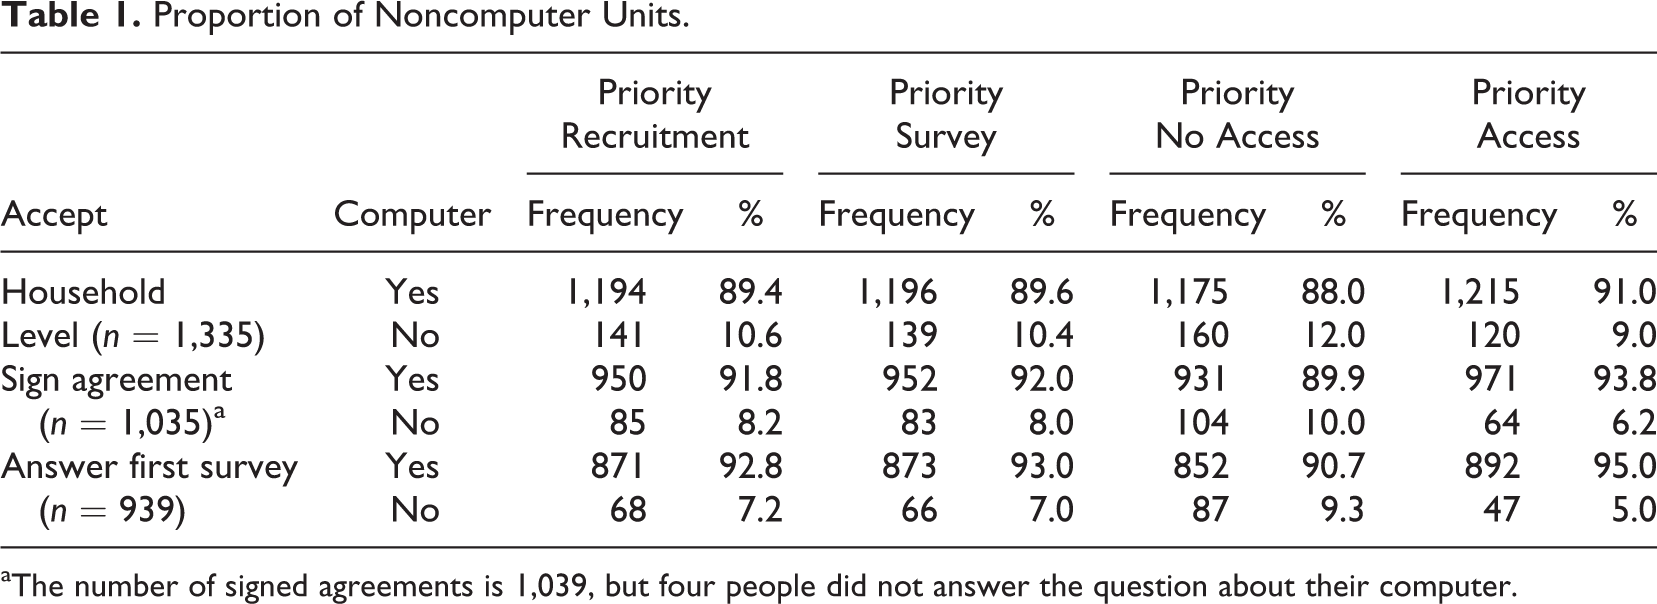
Table 1 gives the frequencies and percentages of panelists who did not have a computer at their disposal before becoming involved in the ELIPSS panel, for the different definitions and recruitment stages. The proportion of noncomputer units in the ELIPSS panel is relatively low: The maximum value of 12.0% at the household level is lower than what we expected based on results from official statistics (14.8% for 18- to 75-year-olds in the 2013 ICT survey). Second, we observed the same trend across all definitions: A higher proportion of households with no computer accepts at the household level, but then a smaller one reaches the agreement-signing stage, and an even smaller one ends up actually participating. The proportion of noncomputer units who participated in the first survey is 9.3% at most across the four definitions (87 respondents) but only 5.0% (47 respondents) in the smallest case. Thus, depending on what information is used to define which panelists have or do not have computer access, the results are quite different.
Proportion of Noncomputer Units.
aThe number of signed agreements is 1,039, but four people did not answer the question about their computer.
Internet Access
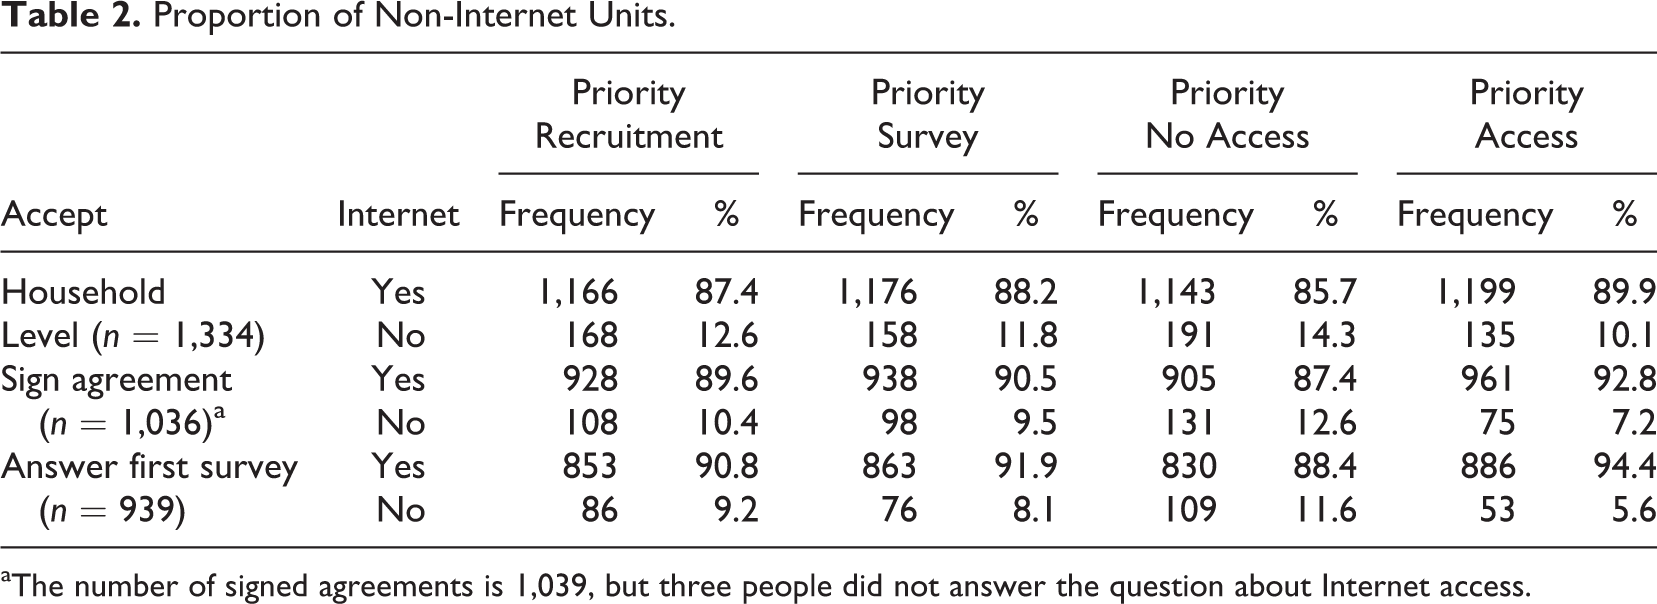
Second, we conducted a similar analysis for Internet connection. Table 2 presents the results.
Proportion of Non-Internet Units.
aThe number of signed agreements is 1,039, but three people did not answer the question about Internet access.
Table 2 shows similar patterns. A maximum of 14.3% of non-Internet units accepted to participate in the panel at the household level, and a maximum of 12.6% of non-Internet units actually signed the agreement. This is slightly higher than in the LISS panel (where “9.5% of the entire panel consists of non-Internet households,” Leenheer & Scherpenzeel, 2013, p. 21) but still slightly lower than the percentage of people without Internet in metropolitan France (14.5% for 18- to 75-year-olds in the 2013 ICT survey).
Moreover, depending on how Internet access is defined, the results change a lot: Of the 939 respondents who answered the first survey, the “priority no access” yields twice as many non-Internet access respondents as the “priority access” definition (109 vs. 53).
However, having an Internet connection at home may not be a very good indicator of ability to complete Internet surveys. If respondents have easy access at other locations, they might agree to participate in a web panel even if they were not provided with any particular equipment. In order to account for this, the next section examines the frequency and place of Internet connections reported by respondents to the first survey about digital practices.
Internet Usage
The following question was asked in the first survey: “in the last three months, how frequently did you personally connect to the Internet, whatever the place and mode of connection.” According to the 2013 ICT survey, 14.7% of 18- to 75-year-olds never connect to the Internet, and 65.4% connect “every day or almost every day.” Within members of a web panel, we expect to have less panelists answering “never” and more “every day.” By including the non-Internet units, we assumed that the differences with the benchmark survey would be reduced. Table 3 shows the cross-distribution of the frequency of Internet connection and access defined using the “priority survey” definition (since the information about the frequency of connection to the Internet comes from the survey only).
Cross-Distribution Frequency of Internet Connection and Access (Definition “Priority Survey”).
aFive respondents did not answer the question about the frequency of Internet connection (two without and three with Internet access). They were included to compute the percentages but are not presented in the table.
The first finding is that the proportion of panelists who connect every day is much higher than in the benchmark survey, and the proportion of panelists who never connect is much lower. The inclusion of the non-Internet units only very slightly reduces these differences, probably as a result of their small number as well as their online behavior. Indeed, of the respondents who do not have Internet access at home, 41.3% still connect to the Internet “every day or almost every day,” and an additional 18.7% connect “1 to 4 days a week.” One possible explanation is that there are places other than home where a large proportion of panelists have regular access to the Internet. Therefore, we look at the places where respondents connected to the Internet in the last 3 months for respondents who did not answer “never” to the question about the frequency of connection. Table 4 shows the frequencies and percentages of non-Internet access respondents who connected to the Internet from different places.
Percentage of Non-Internet Access Respondents Who Connected From Different Places.
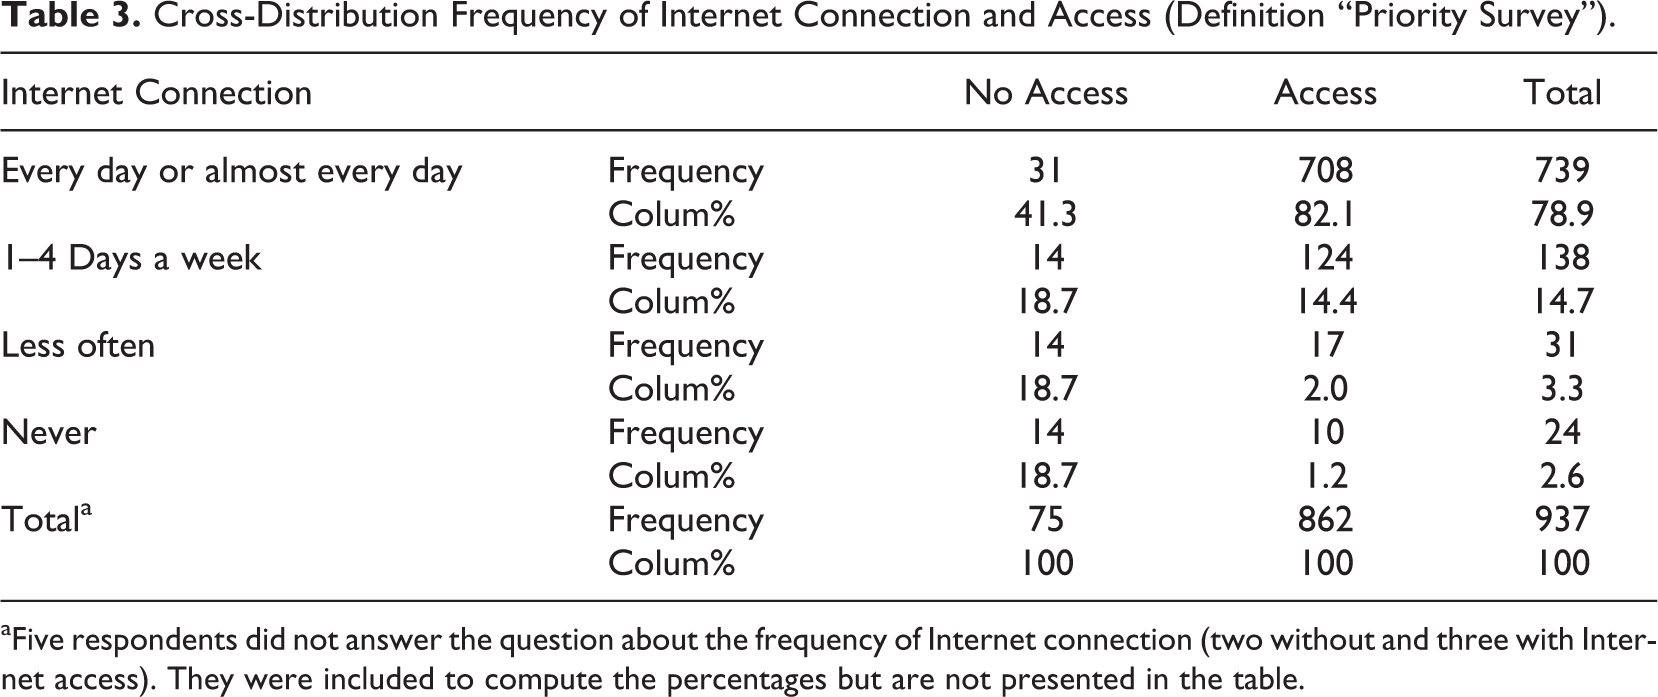
Table 4 shows that 41.7% of the respondents who claimed not to have an Internet connection at home did actually connect from home in the last 3 months. This might not be completely incoherent, because of the questions’ limitations mentioned previously and the complexity of defining what having an Internet connection means today. People may not have thought about mobile web connection when asked about Internet connection at home. The question about places of connection covers the last 3 months, whereas the question about having an Internet connection refers to the present. But the main point is that some of the panelists classified as non-Internet units might in fact be able to regularly connect to the Internet from home.
To sum up the previous findings, the general picture in the case of ELIPSS is that the number of units who accepted to participate in the panel and had no previous computer access and/or no previous Internet access is small, especially considering that some of the respondents classified as non-Internet units do in fact connect to the Internet daily and therefore might participate in the panel even if they were not provided with any equipment. Nevertheless, if these units greatly differ from the others, including them in the panel may still increase the overall representativeness. The next section focuses on this question. For simplicity, we consider only the priority survey definition of Internet access, because another person from the household might have answered during the recruitment process.
What Are Their Characteristics?
In Terms of Participation in the Panel
So far, we have seen that some units are lost during the recruitment process. But once the panelists have participated in a survey, do they subsequently continue participating? If units are lost, does this affect the balance between Internet and non-Internet groups? Leenheer and Scherpenzeel (2013, p. 19) emphasized the importance of studying “the non-Internet households’ loyalty to the panel, which relates to the long-term benefits of the investment to provide them with Internet access.” This is achieved by tracking participation in the monthly questionnaires. Leenheer and Scherpenzeel (2013) actually found that “the non-Internet households show a high degree of loyalty after they join the panel” (p. 22), which can be linked to the extra incentives these units have (free device and/or Internet connection, in addition to the monthly incentives for participation that all respondents receive). Even if the number of non-Internet units is limited at the creation of the panel, if they more regularly participate in the surveys, it would be more attractive to include them. We therefore looked at participation in the ELIPSS panel across surveys addressing various topics such as cultural practices, political opinions, environmental issues, and health. Through May 2014, 16 surveys were administered, including the first survey on digital practices and the ELIPSS annual survey. The participation rate in monthly surveys is generally above 80%, 2 and the attrition rate reached 9% in May 2014.
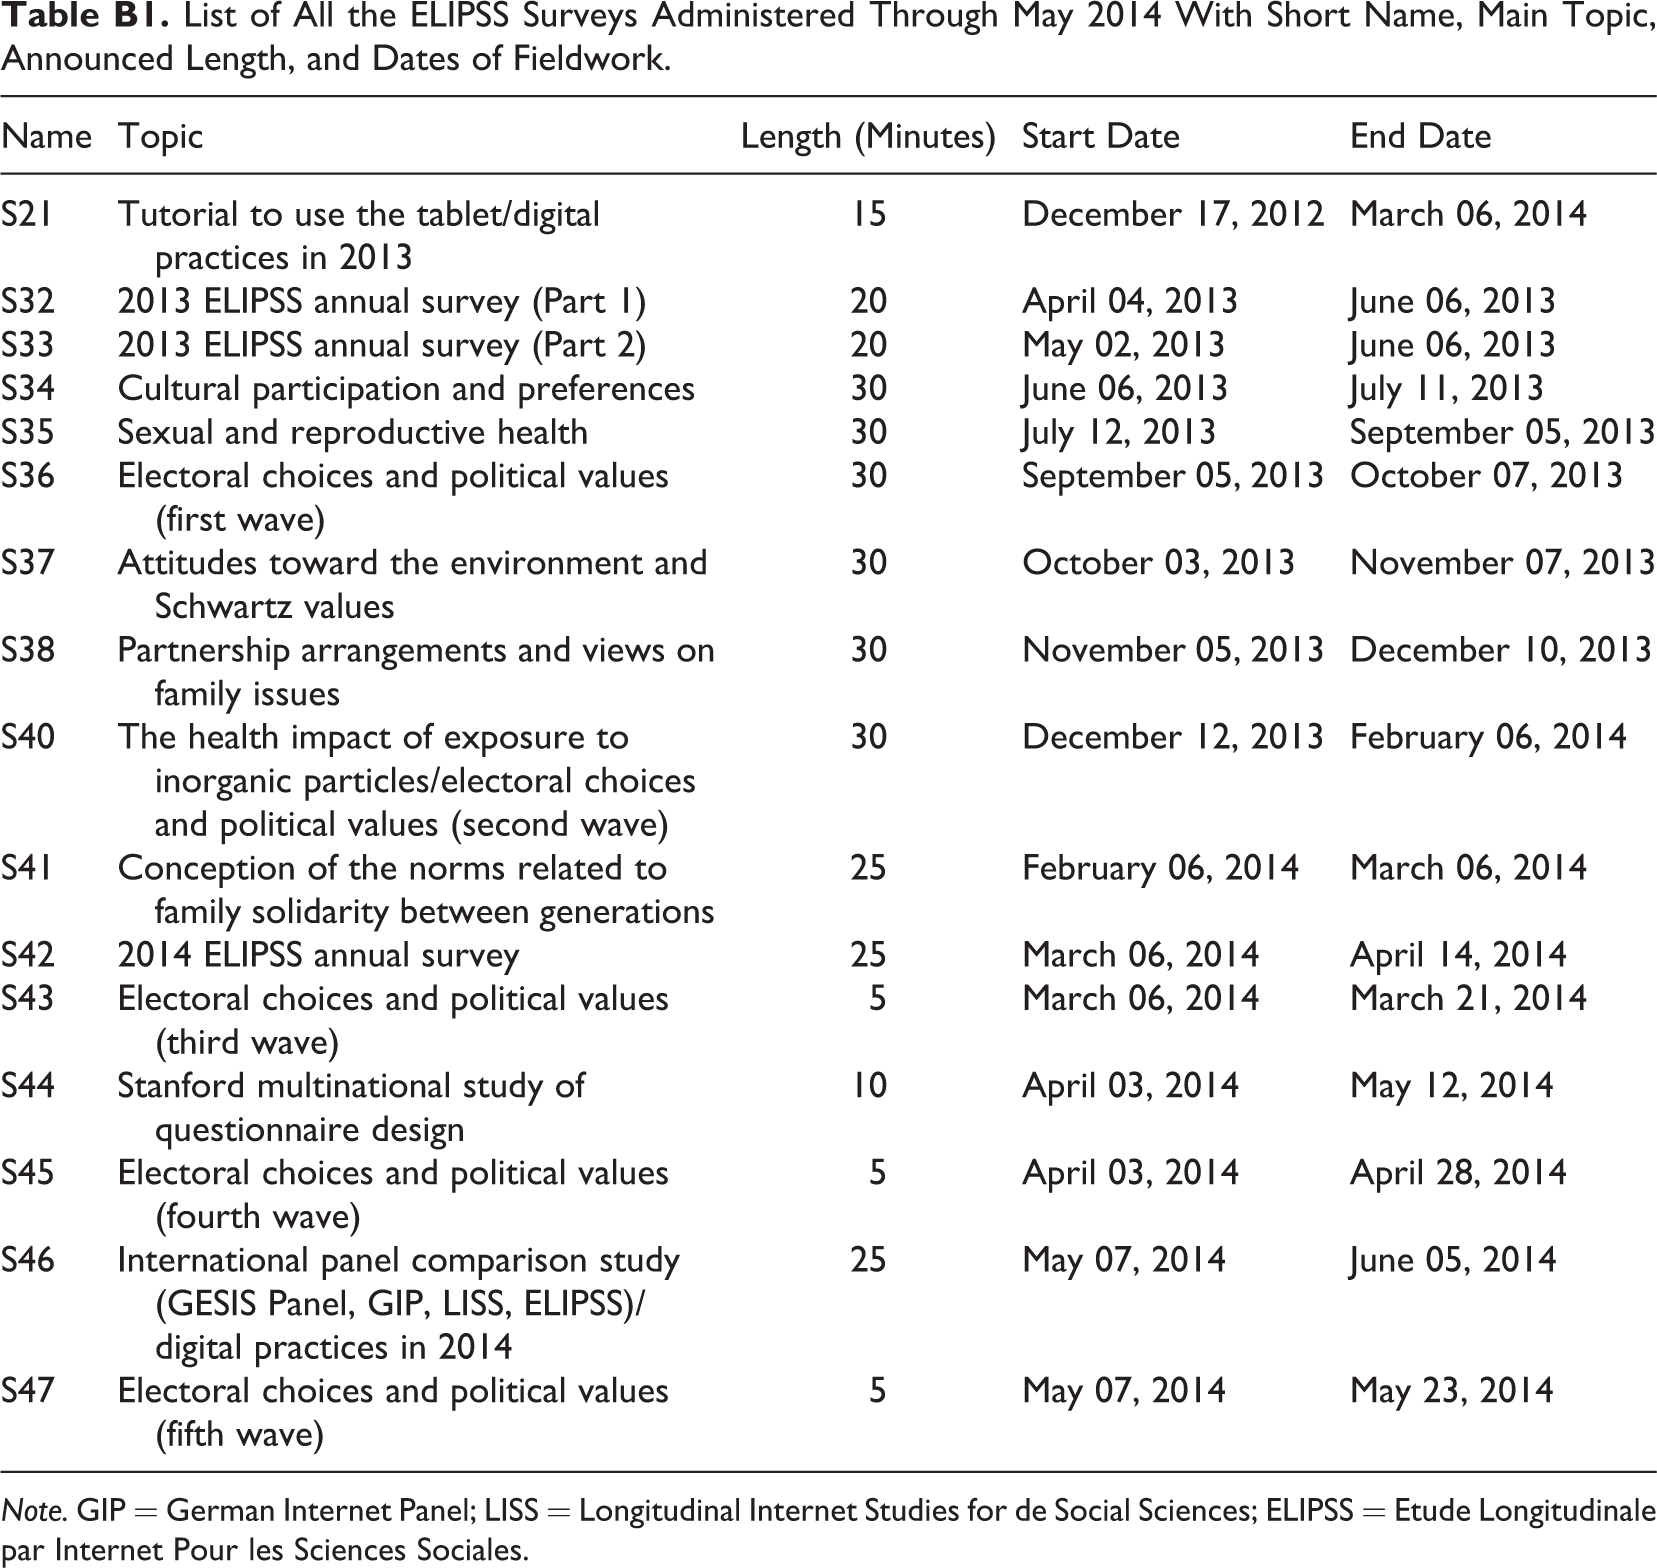
Figure 1 shows levels of participation in the different surveys (called S21–S47, cf. Appendix B for more details about the topic, when the surveys were completed, etc.), differentiating between Internet (access) and non-Internet units (no access). The surveys are ordered chronologically (S21 was the first survey administered to the panelists, starting in December 2012, and S47, administered in May 2014, was the latest one available at the time of our analysis).
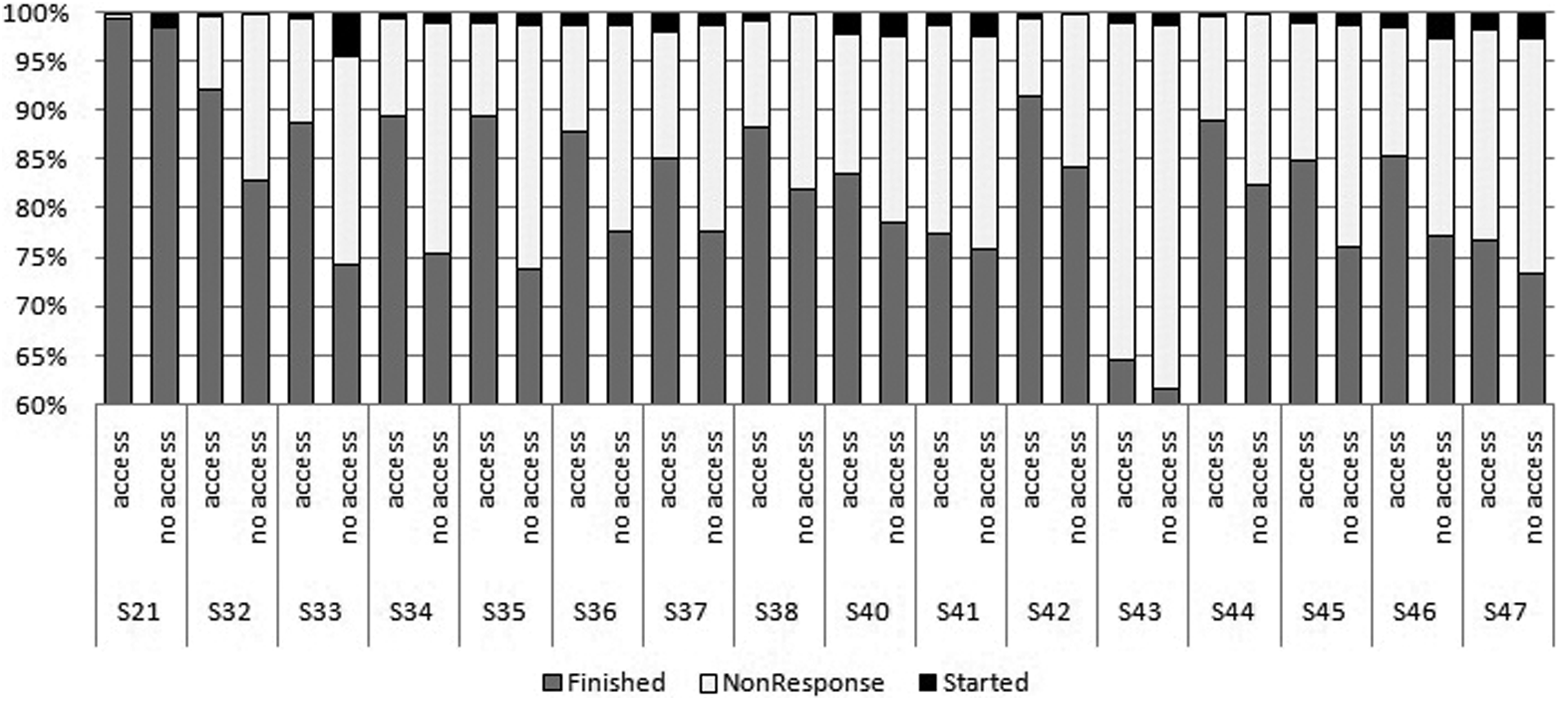
Participation of invited panelists in the different surveys, differentiating between Internet (access) and non-Internet (no access) units. Note. We started with a 60% value on the vertical axis but everything below only corresponds to Finished. Take survey S33, for example. Among the units with previous Internet access, around 88% of the invited units finished the survey, 11% did not respond, and 1% started but did not finish, and among the non-Internet units, around 75% finished, 21% did not respond, and 4% started but did not finish.
Contrary to the findings for the LISS panel, the non-Internet units in the ELIPSS panel are not more loyal. If the loyalty in the LISS panel was driven by the fact that the non-equipped units received a PC and/or Internet connection, one would expect to find similar levels of loyalty in the ELIPSS panel, given that tablets are provided to all panelists.
According to Figure 1, the proportion of panelists invited to participate in different surveys who actually finished the questionnaires is systematically lower for the non-Internet group. Sometimes the differences are small (e.g., S41 on intergenerational relations), but other times it is quite large (e.g., for S34 on cultural practices, 75% of invited panelists finished the survey in the non-Internet group vs. 90% in the Internet group). While there is no increasing or decreasing trend over time in the differences, the main result is clear: Non-Internet units tend to participate less at the aggregate level.
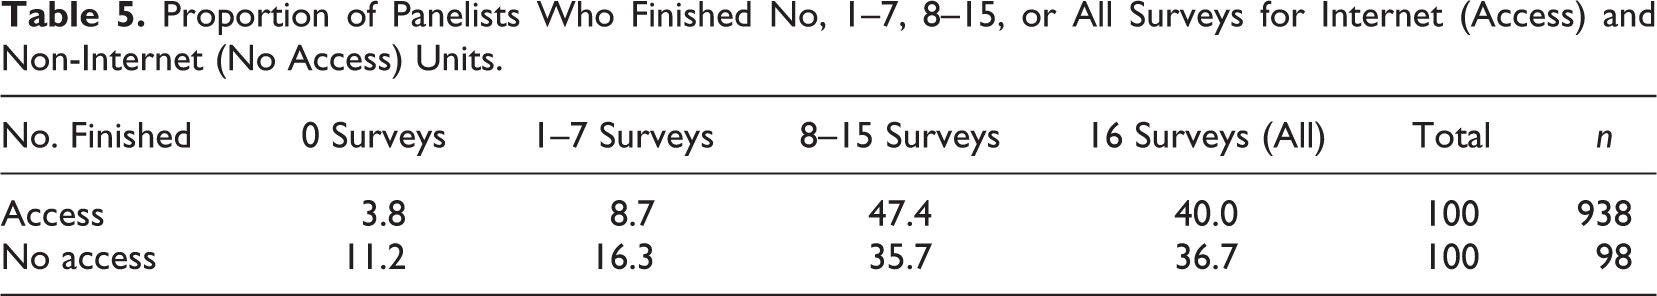
In order to give an idea of the individual trajectories, Table 5 shows the proportion of panelists who finished a given number of surveys. We note that some panelists were not invited to participate in all of the surveys, because either they started later and were not invited to the first survey or they were not available for some surveys (problem with the tablet, holidays, etc.). In addition, some members dropped out of the panel because either they no longer wanted to participate or they were excluded after failing to participate in five successive waves. Non-Internet units dropped out of the panel more often than the others (19% [n = 19] vs. 9% [n = 87], p < .002), which may be related to their lower familiarity with new technologies and the higher level of effort required of them to use the tablet.
Proportion of Panelists Who Finished No, 1–7, 8–15, or All Surveys for Internet (Access) and Non-Internet (No Access) Units.
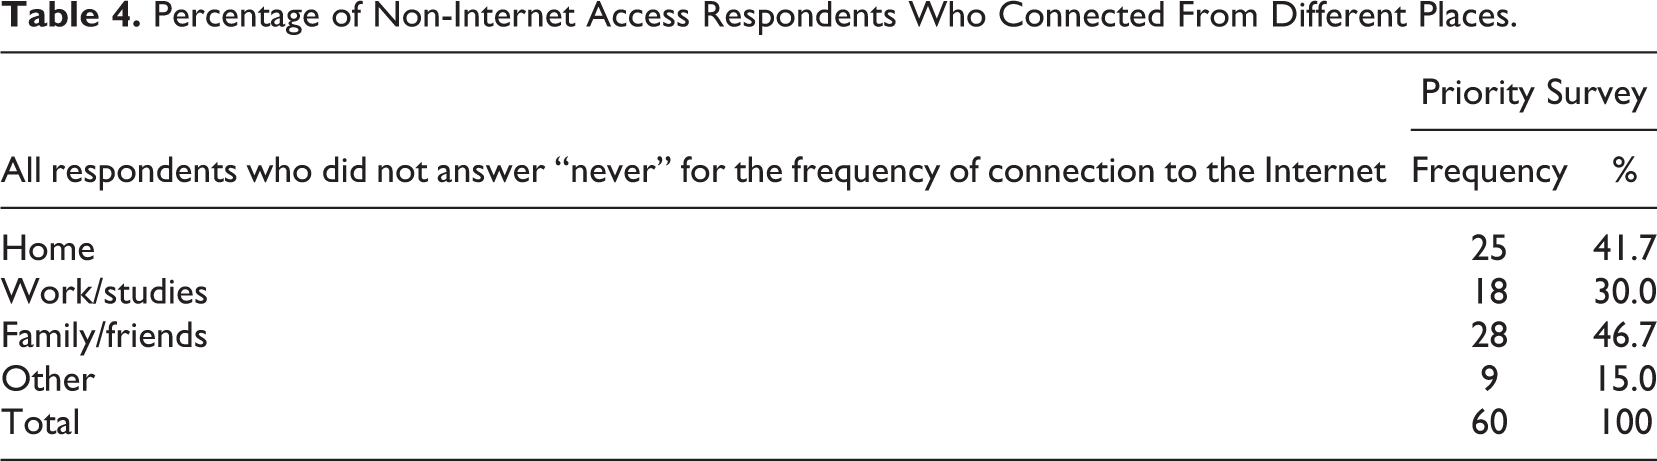
Table 5 shows that 11.2% of the panelists without previous Internet access did not finish any survey versus only 3.8% of those with previous Internet access. Thus, an important proportion of the non-Internet units who signed the agreement never actually participated in the panel. In ELIPSS, only the people who signed the agreement and received their tablet at home are considered to be panel members. Whether units who never answered should be considered panel members is debatable. The table also shows that a much higher proportion of non-Internet units did not finish over half of the surveys (11.2 + 16.3 = 27.5% vs. 3.8 + 8.7 = 12.5%). However, a similar proportion of panelists finished all surveys. This suggests two types of non-Internet unit behavior: Some are very committed (36.7%), while others (63.3%) participate little in the long run (sometimes because they dropout). Overall, this leads to a lower participation rate for the non-Internet units in each individual survey, thereby limiting the advantage of including them in the panel. But if these units are very different sociodemographically, even if there are only a few in the panel and they do not participate much, their inclusion might still yield a representational advantage.
In Terms of Sociodemographic Characteristics: Distribution and χ2 Distance
For the inclusion of non-Internet units to improve the representativeness, these units would need to have different sociodemographic characteristics. To determine whether this is the case, we compared the characteristics of the whole group of ELIPSS panelists and respondents of selected surveys with the population of interest on a series of primary (gender, age, French nationality, and education) and secondary (marital status, couple status, level of urbanization, employment status, home ownership, and living in a deprived area) sociodemographics variables. We selected five surveys (S21 on digital practices, S32 on sociodemographic background, S34 on cultural practices, S41 on intergenerational relations, and S46 on European issues). As seen in the previous section, rates of participation in surveys vary, so it is important to consider more than one. Non-Internet access was defined by our “priority to the survey” variable (see definition above).
Information from the population of interest was approximated with the results from the 2012 French LFS [Enquête Emploi (en continu)—2012, INSEE (producteur), ADISPCMH (diffuseur)] by selecting only 18- to 75-year-olds. We chose the LFS because it is one of the main surveys conducted by the National Institute and is well known for its quality and representativeness of the French population. The choice of variables to compare was limited by the information available in this data set.
The distribution for these variables in the panel, in the different surveys, and in the population of interest is available as online material (all respondents combined, and Internet and non-Internet units) at http://webdatanet.cbs.dk/images/AIAS-WP/onlinematerial-revillaetal-sscr.pdf. Each survey distribution is weighted using the initial sampling weights, which correspond to the product of the weights computed by the National Institute for the selection of households and the weights computed for the selection of one individual within the household (they do not correct for unit nonresponse).
Comparing the panel with the population, we observe that the distributions are very close for some variables (e.g., gender, level of urbanization, and deprived area). However, some groups are underrepresented in the panel: 65- to 75-year-olds, respondents who do not have French nationality, people with very low levels of education, two-person households, students, and married people. Conversely, some groups are overrepresented, for example, 25- to 44-year-olds, single-person households, the highly educated, respondents in a couple, and employed people.
Considered separately, Internet and non-Internet units clearly differ on most variables. Within the non-Internet group, the age distribution is closer to that of the population but different from the Internet units’ distribution (in which 25- to 44-year-olds are overrepresented and 65- to 75-year-olds are underrepresented), and men, people living in rural areas (<2,000 inhabitants), retirees, single people, widowers, and divorcees are overrepresented, as are units with very low levels of education (whereas they are underrepresented in the group with Internet access). Single-person households are even more overrepresented than in the group with Internet access, and on the other hand, people in a couple, the highly educated, and employed people are underrepresented, and married people, households with more than three people and homeowners even more.
To get a more precise picture and summarize this huge amount of information, we computed each variable’s χ2 distance between each group (Internet or non-Internet) and the target population (the general population as described by the LFS):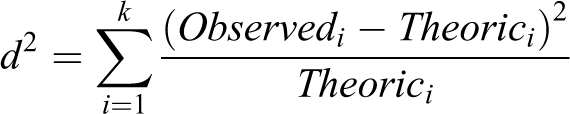
Because our goal was to compare this distance for both when the non-Internet units are included and when they are not included, as well as for different surveys and the panel, we computed all the distances using relative frequencies (which in practice means that we computed the distance for a sample size of 100, so we used the percentages as frequencies). The smaller the χ2 distance, the closer the considered group is to the population of interest, and therefore the greater its representativeness of the group. Figure 2 shows the values of the χ2 distances for the different variables and groups. The variables are grouped according to their distance (with the lowest distances in Column 1 and the highest distances in Column 3). We note that for household size, a different scale was used for the y-axis.

χ2 Distance for the different variables and groups. Note. S21–S46 correspond to different surveys (see Appendix B).
Figure 2 provides a lot of information. We will focus on some of the main results. First, aside from the “deprived” area, where there are almost no differences, the χ2 distance is invariably different in the group without Internet access. For a majority of variables (gender, employment status, level of urbanization, home ownership, age, marital status, and household size), the distance is higher for this group, meaning that the non-Internet group is more different from the general population. However, for nationality, couple status, and education, the non-Internet units are closer to the general population. So the direction can change, but it is clear that the non-Internet units differ from the Internet units. Thus, even if only a limited number of non-Internet units accept to participate in the panel and actually complete the surveys, because this group is very different the complete samples are closer to the general population than the sample including only Internet units for the couple status and education variables. However, for the other variables, adding the units without Internet access yields no real improvement.
In addition, we note some difference between the panel and the surveys. For instance, in all three groups (whole panel, Internet units, and non-Internet units), the distance of the panel for the “couple status” variable is quite different from the distance of the different surveys. Further research could investigate the reasons behind this phenomenon. In the panel, the shorter distance for “couple status” is found when the panelists are considered as a whole, whereas in the different surveys, the smaller distances always appear in the group of non-Internet units. Finally, we also see large differences from survey to survey (e.g., for age, level of urbanization, and marital status) but with no clear decreasing or increasing pattern of. This is probably linked less to a temporal effect and more to the specificities of each survey (topic, period where it was administered, length of both the survey and fieldwork period).
Conclusion
Using the Internet as a mode of data collection for survey research is attractive, but since not all individuals have access to the Internet this approach raises coverage issues when the goal is to study the general population. One solution is to provide Internet access to the units without it. In the last years, several probability-based online panels have been created in this manner. Nevertheless, the nonresponse problem remains: Previous research has found that even if individuals without previous Internet access are provided with the equipment, they are more likely to refuse participation in an online panel compared to individuals with previous Internet access (Leenheer & Scherpenzeel, 2013). Thus, is representativeness really improved by offering to provide the non-Internet units with Internet access? If not, it might make more sense to create a web probability-based sample, wherein respondents without Internet access would simply select themselves out of the panel. This would be much simpler (in terms of organization) and cheaper for researchers.
In this article, we investigated these questions using the ELIPSS panel, which differs from other probability-based online panels in its use of tablets to collect data as devices, and in providing this equipment to all panel members. Both aspects might affect an individual’s decision to participate in the panel. This study therefore differs from previous ones focusing on this question (e.g., Leenheer & Scherpenzeel, 2013).
First, we saw that it is becoming difficult to define what “Internet access” means (due to the proliferation of mobile devices, 3G, and free Wi-Fi) and to determine how to assess this access (slightly different questions at different stages of the recruitment process lead to different answers for a sizable share of respondents). If a survey institute only wanted to provide Internet access to units who do not have it, then “no access” would have to be carefully defined. Most importantly, the research institute would want to know whether the units could complete Internet surveys without being provided with any additional equipment. Thus, we recommend asking not only whether the individual has certain devices or an Internet connection in general but also whether he or she is able to complete online surveys. The answer may be subjective but at the end of the day the individuals’ perception on this matter will determine their participation. We also recommend setting some criteria on the types of devices allowed (e.g., screen size and operating system). Answers might otherwise be incomparable. Another concern is that it could be a problem to adapt the questionnaires to some devices. Thus, there should be some control on the device eligible for completing the surveys.
In the case of the ELIPSS panel, since different information was collected at different stages of the recruitment process, four definitions of Internet access were examined. Our analyses yielded different results depending on the definition used. However, the general trend was clear: The number of non-Internet units participating in the panel was limited. This is also related to the size of the pilot sample and to the fact that Internet coverage is quite high in France. Moreover, the non-Internet units were generally less committed than the others, meaning that they participated less in the different surveys. Looking at the number of surveys completed by the panelists, we found that around a third of the non-Internet units participated in all the surveys, but that the others participated very little, suggesting that information about Internet equipment alone is insufficient to predict a panelist’s future participation: Other characteristics play a role and further investigation is needed to identify them.
The non-Internet units also differ quite a lot from the Internet units on a number of primary and secondary sociodemographic variables. But because of their small number, combining the non-Internet units with the Internet units only improved representativeness on some variables: couple status, education, and to some extent nationality.
In the end, deciding whether or not to include them in a panel can be seen as a trade-off between costs and representativeness. Providing Internet to non-Internet units is costly, not necessarily so much in terms of money (e.g., there were only 66 panelists without Internet access in this study) but in terms of preparation, organization, and maintenance of the panel (selection of the device and type of connection, negotiation of the prices, installation in some cases at the respondents’ homes, management of the devices in the event they are broken, stolen, lost, etc.). The decision requires carefully defining who needs the equipment and who could complete the surveys without additional equipment. If a mobile device is provided to non-Internet units (because it is easier to use and requires no installation), the difference in screen size, portability, and so on, could threaten data comparability. Providing a mobile device to all units, as in the ELIPSS, solves the data comparability issue and serves as an incentive for all units.
With respect to representativeness, our results suggest that offering equipment to the non-Internet units could improve representativeness on a few variables, including important ones (e.g., education). Yet the overall gains are limited. Thus, if the creation of a new probability-based online panel was being planned, and limited available resources (money, people working on the project, and time constraints) precluded offering equipment to non-Internet units, one could think about setting up this online probability-based panel by recruiting off-line and without providing equipment. Respondents who really had no Internet access would then “naturally” select out of the panel. Our results suggest that this would lead to a small loss of representativeness on a few characteristics but would not be detrimental to others, while yielding significant savings in terms of organization and costs.
Finally, two additional facts should be considered in the decision. First, previous surveys have shown that units without previous Internet access differ from the others on the variables of interest and that this difference cannot be corrected through weighting. In other words, being connected is a choice that is not ignorable conditionally to sociodemographics (Rookey, Hanway, & Dillman, 2008). With high Internet coverage, this result may be valid for a set of various behaviors. Second, the size of the panel affects the costs related to equipment, logistics, and panel recruitment. Facing the investments necessary to set up a panel in which Internet equipment is provided may be more cost-effective for a larger panel. Indeed, an important share of the costs (e.g., producing surveys and disseminating data) is fixed costs. While it might not be very attractive to include non-Internet units in a small or midsized panel, it might be worth it for a larger panel.
Furthermore, results could vary by country, depending on the specific procedure chosen for the panel and on the country’s Internet coverage. Countries with low Internet coverage might require greater investments to include non-Internet units. At the same time, in countries where coverage is very high, non-Internet units probably differ more from the others. Thus, more research is still needed to adequately inform decisions in various countries or for different devices, incentives systems, and so on.
Footnotes
Appendix A
Appendix B
List of All the ELIPSS Surveys Administered Through May 2014 With Short Name, Main Topic, Announced Length, and Dates of Fieldwork.
| Name | Topic | Length (Minutes) | Start Date | End Date |
|---|---|---|---|---|
| S21 | Tutorial to use the tablet/digital practices in 2013 | 15 | December 17, 2012 | March 06, 2014 |
| S32 | 2013 ELIPSS annual survey (Part 1) | 20 | April 04, 2013 | June 06, 2013 |
| S33 | 2013 ELIPSS annual survey (Part 2) | 20 | May 02, 2013 | June 06, 2013 |
| S34 | Cultural participation and preferences | 30 | June 06, 2013 | July 11, 2013 |
| S35 | Sexual and reproductive health | 30 | July 12, 2013 | September 05, 2013 |
| S36 | Electoral choices and political values (first wave) | 30 | September 05, 2013 | October 07, 2013 |
| S37 | Attitudes toward the environment and Schwartz values | 30 | October 03, 2013 | November 07, 2013 |
| S38 | Partnership arrangements and views on family issues | 30 | November 05, 2013 | December 10, 2013 |
| S40 | The health impact of exposure to inorganic particles/electoral choices and political values (second wave) | 30 | December 12, 2013 | February 06, 2014 |
| S41 | Conception of the norms related to family solidarity between generations | 25 | February 06, 2014 | March 06, 2014 |
| S42 | 2014 ELIPSS annual survey | 25 | March 06, 2014 | April 14, 2014 |
| S43 | Electoral choices and political values (third wave) | 5 | March 06, 2014 | March 21, 2014 |
| S44 | Stanford multinational study of questionnaire design | 10 | April 03, 2014 | May 12, 2014 |
| S45 | Electoral choices and political values (fourth wave) | 5 | April 03, 2014 | April 28, 2014 |
| S46 | International panel comparison study (GESIS Panel, GIP, LISS, ELIPSS)/digital practices in 2014 | 25 | May 07, 2014 | June 05, 2014 |
| S47 | Electoral choices and political values (fifth wave) | 5 | May 07, 2014 | May 23, 2014 |
Note. GIP = German Internet Panel; LISS = Longitudinal Internet Studies for de Social Sciences; ELIPSS = Etude Longitudinale par Internet Pour les Sciences Sociales.
Acknowledgments
The authors would like to thank the entire ELIPSS team: K. Boudelle, C. Calandra, A. Danciu, E. Duwez, A. Ferreira, A. Mairot, G. Michaud, M. Olivier, E. Pétorin, N. Razakamana, J. Richard, and P. Sossa. The ELIPSS Panel is part of the larger Data, Infrastructure, Methods of Investigation in the Social Sciences and Humanities (DIME-SHS) project led by Laurent Lesnard and is funded by the French National Research Agency (ANR-10-EQPX-19-01). The authors would also like to acknowledge the contribution of WEBDATANET, a European network for web-based data collection (COST Action IS1004, ![]() ).
).
Declaration of Conflicting Interests
The authors declared no potential conflicts of interest with respect to the research, authorship, and/or publication of this article.