



Abstract
The number of respondents who access web surveys on a mobile device (smartphone or tablet) has been increasing rapidly over the last few years. Compared with desktop computers, mobile devices have smaller screens, different input options, and are used in a larger variety of locations and situations. The suspicion that the quality of data may suffer when online respondents use mobile devices has stimulated a growing body of research, which has mainly focused on paradata and web survey design. To investigate whether the respondents’ device affects the quality of web survey data, we examined the responses of 1,826 mobile-device and desktop participants in a political online survey that asked questions about the 2013 German federal election. To determine the reliability and validity of data submitted via mobile devices, we determined the consistency of the participants’ responses across questions and validated the responses against various internal and external criteria. Replicating previous findings, mobile-device respondents were younger and more likely to be female, and they produced higher dropout rates and longer completion times than desktop respondents. However, data produced by respondents using mobile devices were as consistent, reliable, and valid as data produced by respondents using desktop computers. These findings contradict the notion that mobile-device users compromise the reliability and validity of data collected online and suggest that researchers do not necessarily need to be afraid of the participation of mobile-device respondents in web surveys.
Web surveys have been found to offer several advantages over paper-based surveys (Díaz de Rada & Domínguez-Álvarez, 2014). The increasing availability of desktop computers during the past two decades has therefore resulted in growth in the number of surveys conducted online. Electronic devices are subject to change, however, and in recent years, the use of mobile devices (smartphones or tablets) has increased in Germany from nearly 0% in 2010 to more than 30% in 2015 (StatCounter, 2015). The proportion of respondents accessing web surveys on a mobile device has followed a parallel trend (de Bruijne & Wijnant, 2014; Mavletova & Couper, 2014; Poggio, Bosnjak, & Weyandt, 2015). Mobile devices offer convenient Internet access anywhere and can therefore be particularly useful for collecting data in real time (Hofmann & Patel, 2015; Raento, Oulasvirta, & Eagle, 2009). Adapting surveys to mobile participation can also help provide better coverage of difficult-to-survey target populations, such as respondents in low- and middle-income countries where smartphones are sometimes the only electronic devices available (James, 2014; van Heerden, Norris, Tollmann, Stein, & Richter, 2014).
When surveying mobile-device users, it is important to know whether the devices respondents are using are affecting the quality of survey data. Compared with desktop computers, mobile devices have smaller screens, different input options (Raento et al., 2009; Sweeney & Crestani, 2006), and are used in a larger variety of locations and situations (de Bruijne & Oudejans, 2015). Respondents using mobile devices are therefore likely to be exposed to more distractions than desktop users, and the presence of other people can influence their response behavior (de Bruijne & Oudejans, 2015). Because mobile-device users may also differ from desktop users in how they cognitively process and respond to web surveys (Peytchev & Hill, 2010), it has been suspected that the data quality of web surveys may be impaired when respondents participate on mobile devices (Mavletova, 2013).
Presumably to be on the safe side, Carlson and Carlson (2014) recently decided to minimize any potential negative impact by denying mobile-device users participation in their study. However, with the growing use of smartphones and tablets (Callegaro, 2010), blocking all mobile-device users may no longer be a viable solution because the availability of mobile devices and the willingness to use them for participation in web surveys is known to be unequally distributed across respondents (Lugtig & Toepoel, 2015). For example, mobile-device respondents are younger (de Bruijne & Wijnant, 2014; Lambert & Miller, 2015; Mavletova, 2013; Wells, Bailey, & Link, 2014) and tend to be female (de Bruijne & Oudejans, 2015; de Bruijne & Wijnant, 2014; Lambert & Miller, 2015; Wells et al., 2014). Excluding a growing number of mobile-device respondents may therefore lead to selection effects and biased results.
The question of whether the increasing participation of mobile-device users in web surveys poses a threat to data quality has recently stimulated a growing body of research. However, this research has mainly focused on paradata and web survey design (e.g., de Bruijne & Wijnant, 2013b; Peytchev & Hill, 2010; Wells et al., 2014). Only a few studies have addressed the question of whether the responses of mobile-device users are as reliable and valid as those produced by desktop users. In the following, we review the existing research on differences between mobile-device and desktop responses.
With a view to the smaller screen size and different input options of mobile devices, it has been investigated whether survey layout affects the response behavior of mobile-device users. However, no impact of survey layout on the distribution of responses has been reported for the number of questions per screen, the presentation of images, the need for horizontal scrolling (Peytchev & Hill, 2010), or the orientation of response options (de Bruijne & Wijnant, 2014; Peytchev & Hill, 2010). Recent technological developments that have resulted in smartphones with increased resolution and screen sizes may already have closed a potential usability gap between mobile devices and desktop computers (de Bruijne & Wijnant, 2014).
A large portion of recent research on mobile-device users has focused on paradata. Arguably due to slow and unsteady mobile Internet connections (de Bruijne & Wijnant, 2013b), an increase in the time needed to complete a survey (d = 0.68) and higher dropout rates have been reported (Lambert & Miller, 2015; Mavletova, 2013; Mavletova & Couper, 2014; Wells, Bailey, & Link, 2013). The additional scrolling that is necessary on smaller screens and distractions that occur when mobile devices are used on the go may also contribute to poorer quality of mobile-device responses (Mavletova, 2013). However, no differences were found between mobile-device and desktop respondents with respect to the distribution of item nonresponses (Toepoel & Lugtig, 2014) and the distribution of responses to questions with a closed answer format (de Bruijne & Wijnant, 2013a). Different response-order effects were not found either (Wells et al., 2014). For example, answer options that were presented at the top of a list were not selected more often than options further down the list when surveys were accessed with a mobile device (Buskirk & Andrus, 2012; Mavletova, 2013; Wells et al., 2014). Conversely, in an early study conducted in 2007, Peytchev and Hill (2010) found that mobile-device users were more likely to select a less appropriate response that was available via a button than to type a more accurate answer into a text box. However, this result dates back to a time when the use of mobile devices was less convenient than it is today. More recent studies suggest that differences between mobile-device and desktop respondents in the willingness to provide answers to open-ended questions may be due to question content. For questions that could be answered in a few words, no differences were found between mobile-device and desktop respondents (Buskirk & Andrus, 2012; Wells et al., 2014). However, for questions that were worded more openly and required a detailed response, shorter answers were observed for mobile-device respondents (Mavletova, 2013; Wells et al., 2014).
When completing a web survey, participants’ responses may be influenced by the presence of other persons, especially for questions that ask for socially undesirable behavior (Lynn & Kaminska, 2012; Mavletova & Couper, 2013). Mavletova and Couper (2013) investigated whether desktop users would report more socially undesirable behavior than mobile-device users. Adopting a “more-is-better” criterion (Hoffmann, Diedenhofen, Verschuere, & Musch, 2015; Umesh & Peterson, 1991), this might be interpreted as evidence that desktop users provide more valid answers. However, a difference was found only for the reporting of alcohol consumption and not for other sensitive questions (Mavletova & Couper, 2013). To the best of our knowledge, no other study has taken question content into account when determining data quality. Moreover, none of the studies that investigated differences between desktop and mobile-device users appear to have examined data reliability and validity. The aim of the present study was therefore to establish and to compare various measures of reliability and validity for mobile-device and desktop respondents. This was done using a large sample participating in a political web survey that asked questions about the 2013 German federal election.
If mobile-device users are more often distracted than desktop users or if they are more inclined to show satisficing behavior (e.g., Barge & Gehlbach, 2012) due to a lack of motivation, they can be expected to provide less consistent data. As an index of response consistency, we therefore compared the internal consistency reliability of desktop and mobile-device users’ responses to a political knowledge test that was part of the survey.
As a first index of concurrent validity, we compared respondents’ self-reported intention to vote for a particular party in the 2013 German federal election with their party preference and regarded inconsistent combinations as an indicator of low validity. A second concurrent validity index was established by comparing the agreement between respondents’ coalition preference and their self-reported intention to vote for a constituency candidate and a particular party in the 2013 German federal election. A third index of concurrent validity was obtained by comparing respondents’ self-reported intention to vote for a particular party in 2013 with their self-reported voting behavior in the previous election of 2009.
As a measure of predictive validity, we examined the cumulative deviation between the self-reported intention to vote for a particular party and the actual outcome of the election for mobile-device and desktop respondents. If desktop respondents provided more valid answers, their stated voting intention should allow for a better forecast of the eventual election result (Aust, Diedenhofen, Ullrich, & Musch, 2013).
Finally, we also compared completion times, dropout rates, and demographics—including age and gender—between mobile-device and desktop respondents.
Method
Sample
A total of 2,069 members of the general population who were also members of a noncommercial research panel run by scientists at the University of Duesseldorf started the political web survey. Three respondents had to be excluded because they could not unequivocally be classified as mobile-device or desktop users, and further 222 respondents did not complete the survey. Of the remaining 1,844 respondents, 18 respondents had to be excluded because they reported that they did not participate in the study seriously (n = 2; Aust et al., 2013) or were ineligible to vote (n = 16), resulting in a final sample of 1,826 respondents (47.2% female). The administration of the survey began two days before the German federal election at 11 pm, September 20th, 2013, and ended at 6 pm, September 22nd, 2013, when the polling stations closed and the first exit polls were released. The questionnaire was delivered online using the software EFS Survey (version 10.1). We used the user agent information provided by respondents’ browsers to classify respondents as desktop (N = 1,504) or mobile-device (N = 322) users. Mobile-device users included both smartphone and tablet users. Respondents ranged in age from 18 to 93 years (M = 35.92, SD = 13.38). As their highest academic degree, 185 respondents indicated a junior high school diploma, 419 held a general qualification for university entrance (the German “Abitur”), 1,091 reported a bachelor’s or master’s degree, and 131 indicated a PhD.
Measures of Data Quality
To examine data quality, we determined the consistency of the participants’ responses and validated their responses against various internal and external criteria.
Internal-consistency reliability
As an indicator of internal-consistency reliability, we calculated Cronbach’s α for the participants’ responses on a political knowledge test. The test consisted of 10 multiple-choice items taken from the German political knowledge test by Willing (2013) and covered general political and political history knowledge. For example, one item read, “Where does the federal constitutional court have its seat?” with “Berlin”, “Bonn”, “Karlsruhe” (correct), and “Hamburg” as answer options. The total test score was determined as the number of correct answers.
Concurrent validity
We established three measures of concurrent validity. As a first measure, we calculated the consistency between respondents’ party preference and self-reported intention to vote for a particular party in the 2013 German federal election. Respondents could choose between the following options: The conservative Christian Democrats (CDU/CSU); The Social Democrats (SPD); The environmental Green Party (Greens); The liberal Free Democrats (FDP); The Left; The Pirate Party; The Alternative for Germany (AfD); The National Democratic Party (NPD); Other party; I don’t know yet; I am not going to vote in the German federal election. Party preference was measured by asking respondents how strongly they sympathized with each of the above-mentioned parties on an 11-point Likert-type scale ranging from not sympathetic (−5) to very sympathetic (+5). The highest ranked party was defined as the respondent’s party preference. A response was considered consistent if the highest sympathy rating was indicated for the party the respondent also intended to vote for. Responses were excluded from the analysis if respondents were unsure about their voting intention, if they did not intend to vote in the upcoming election, if they indicated that they intended to vote for one of the very small and less known minor parties for which no sympathy ratings had been collected, or if they indicated no clear party preference by assigning their highest sympathy rating to more than one party.
As a second measure of concurrent validity, the consistency between coalition preference and self-reported voting intentions regarding (a) the constituency and (b) the party list vote was calculated. A response was considered consistent if both the constituency and the party list vote were cast for one of the parties that were part of the coalition for which the highest sympathy was recorded. Coalition preference was assessed by asking how strongly respondents sympathized with the following potential coalitions: Black-yellow (CDU/CSU and FDP), Grand coalition (CDU/CSU and SPD), Red-green coalition (SPD and Greens), Black-green coalition (CDU/CSU and Greens), Red-red-green coalition (SPD, Greens, and Left), Traffic light coalition (SPD, FDP, and Greens), Jamaica coalition (CDU/CSU, FDP, and Greens), Bahamas coalition (CDU/CSU, FDP, and AfD), and a Coalition between the CDU/CSU and the AfD. Ratings were provided on an 11-point Likert-type scale ranging from not sympathetic (−5) to very sympathetic (+5). The highest ranked coalition was defined as the respondent’s coalition preference. Responses were excluded from the analysis if respondents were unsure about their voting intention, if they were not going to vote in the upcoming election, if they indicated that they intended to vote for one of the minor parties for which no sympathy ratings were collected, or if they indicated no clear coalition preference by assigning their highest sympathy rating to more than one coalition.
As a third index of concurrent validity, we calculated the consistency between self-reported voting intention in the party list vote in the German federal election of 2013 and self-reported voting behavior in the previous German federal election of 2009. Of course, voters may have good reasons to vote for different parties in different elections. However, individual voting decisions are nevertheless known to be rather stable (Schmitt, Sanz, & Braun, 2009), and there is no reason to expect differential stability for mobile-device and desktop respondents. We therefore used inconsistencies in self-reported voting intention and behavior across elections as an indicator of low data validity and considered responses consistent if the same party was named as the recipient of the respondent’s party list vote in 2009 and 2013. Responses were excluded from the analysis if respondents had not voted in 2009, indicated that they had forgotten their 2009 vote, indicated that they were unsure about their vote in the upcoming election of 2013, or indicated that they were not going to vote in 2013.
Predictive validity
For mobile-device and desktop respondents, the deviation of self-reported voting intentions from the actual outcome of the election was computed per party. A smaller average prediction error was interpreted as indicating a higher predictive validity.
Results
For all statistical tests, an α level of .05 was used. Effect sizes for the difference between two means were calculated as Cohen’s d. According to Cohen (1988), effects of d = 0.20, d = 0.50, and d = 0.80 may be considered small, medium, and large, respectively. Effect sizes for the difference between two proportions were calculated using Cramér’s ϕc. According to Cohen (1988), effects of ϕc = .10, ϕc = .30, and ϕc = .50 may be considered small, medium, and large, respectively.
After excluding unclassifiable respondents (n = 3), we confirmed previous findings and observed a higher dropout rate among the remaining 401 mobile-device respondents (19.2%) than among the 1,665 desktop respondents (8.7%; Fisher’s exact test [two-tailed]: ϕc = .13, p < .01). Prior to examining the completion times, we set a cutoff at 2 SDs above the mean completion time to exclude respondents with disproportionately high completion times that were likely the result of serious interruptions that occurred during participation. Confirming the notion that mobile-device respondents are more likely to be interrupted during a survey, this led to a slightly—although not significantly—higher rate of exclusions among mobile-device (n = 7, 2.2%) than among desktop (n = 14, 0.9%) respondents (Fisher’s exact test [two-tailed]: ϕc = .04, p = .08). Among the remaining participants, we still found that mobile-device respondents (n = 315) produced significantly longer completion times (M = 22 min 9 s, SD = 15 min 29 s) than desktop respondents (n = 1,490, M = 18 min 45 s, SD = 12 min 55 s) in a two-tailed Welch t test that was used to correct for the unequal variances and sample sizes, t(411.30) = 3.64, p < .01, d = 0.25. In accordance with previous research, we also found that mobile-device respondents were younger (M = 33.19, SD = 11.29) than desktop respondents (M = 36.51, SD = 13.72), Welch t test (two tailed): t(544.30) = 4.61, p < .01, d = 0.28, and the percentage of women was higher in the mobile (52.2%) than in the desktop group (46.1%; Fisher’s exact test [two tailed]: ϕc = .05, p = .05).
With regard to the internal-consistency reliability of the political knowledge test, we found no difference between mobile-device (Cronbach’s α = .66) and desktop respondents (α = .69), χ2(1) = 0.76, p = .38 (Diedenhofen, 2013; see Table 1). Concurrent validity was assessed using the three consistency indices. We found no difference in the consistency between party preference and self-reported voting intention for the party list vote between mobile (83.8%, n = 229) and desktop respondents (84.3%, n = 1,006; Fisher’s exact test [two tailed]: ϕc = −.01, p = .84). The consistency between coalition preference and self-reported voting intention for the constituency and the party list vote in the 2013 German federal election was 88.6% for mobile-device (n = 220) and 86.9% for desktop respondents (n = 945). This difference was not significant either (Fisher’s exact test [two tailed]: ϕc = .02, p = .58). When we tested the consistency between self-reported voting intention in the 2013 German federal election and self-reported voting behavior in 2009, we found no difference between mobile-device (59.5%, n = 242) and desktop respondents (60.1%, n = 1,180; Fisher’s exact test [two tailed]: ϕc = .00, p = .89). To summarize, there were no differences between the responses of desktop and mobile-device users in any of the consistency indices that we computed as estimates of concurrent validity.
Data Quality Indices for Mobile-Device and Desktop Users.
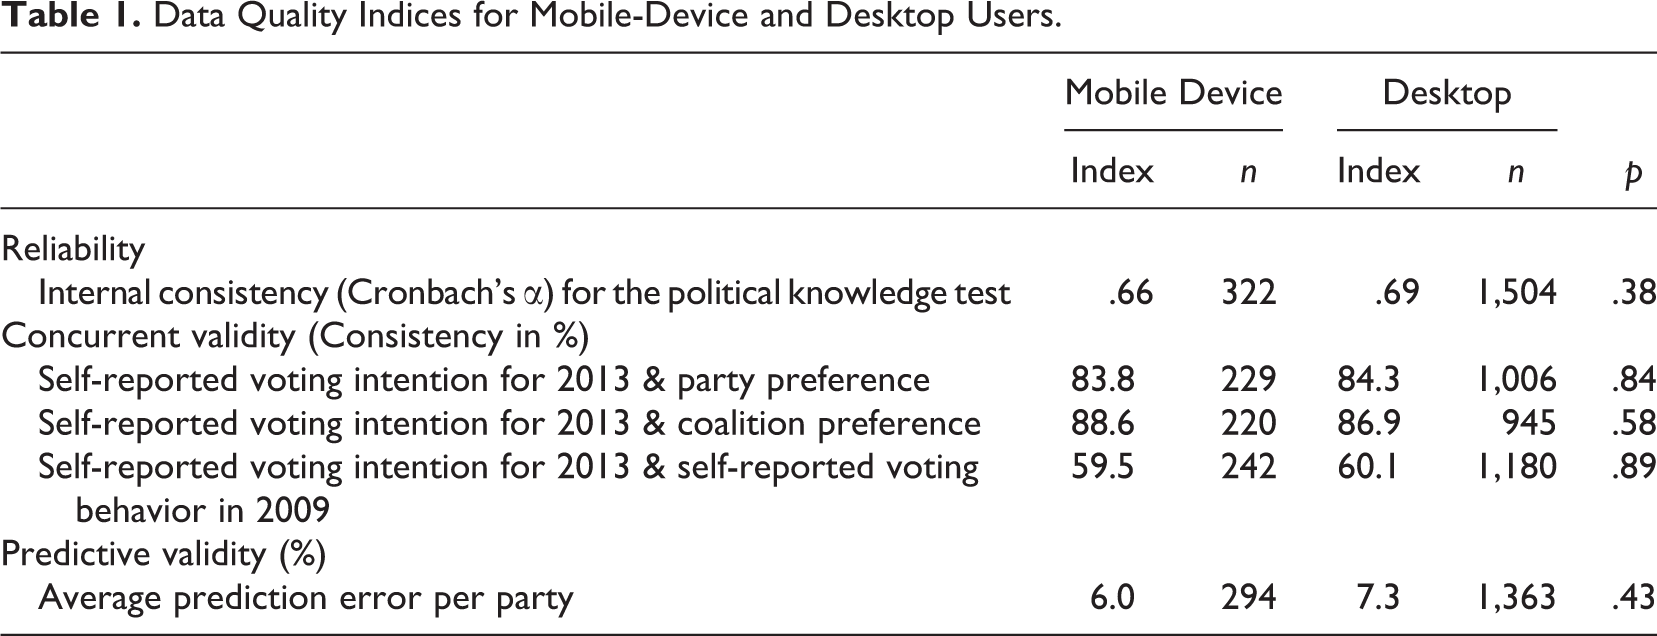
As an indicator of predictive validity, we computed the average prediction error per party as the divergence between self-reported voting intention in the party list vote and the actual outcome of the election. The SPD, for example, achieved 25.7% of the party list vote in the 2013 federal election. In our sample, 24.2% of mobile-device and 20.6% of desktop respondents indicated an intention to cast their party list vote for the SPD. The prediction error for the SPD was therefore 1.5% and 5.1% for mobile-device and desktop respondents, respectively. Using a z test for two independent proportions, we found that the average prediction error per party produced by mobile-device respondents (6.0%, n = 294) did not differ from the average prediction error per party produced by desktop respondents (7.3%, n = 1,363; z = 0.80, p = .43). Thus, taken together, in the present investigation, the responses of mobile-device users were just as valid as the responses of desktop users.
Discussion
In recent years, the number of mobile-device users participating in web surveys has grown steadily (de Bruijne & Wijnant, 2014; Mavletova & Couper, 2014; Poggio et al., 2015). While the participation of mobile-device respondents opens up new opportunities for researchers, it also raises methodological concerns. Research on whether mobile-device users produce data of lower quality is, however, still rather scarce. To compare the quality of responses provided by desktop and mobile-device users, we conducted a web survey that asked questions about the 2013 German federal election and compared the responses of mobile-device and desktop participants using various internal and external criteria.
To compare the responses of desktop and mobile-device users with regard to reliability, we computed the internal consistency (Cronbach’s α) of the participants’ responses on a political knowledge test. We found no difference in the internal-consistency reliability between mobile-device and desktop respondents, thus adding to the notion that mobile-device respondents do not necessarily deteriorate data quality. We also found no differences between mobile-device and desktop respondents with regard to concurrent validity. Mobile-device respondents answered questions regarding their voting behavior just as consistently as desktop respondents. Thus, data produced by mobile-device respondents seemed to be no less valid than data produced by desktop respondents. Additional evidence supporting this notion was provided by a comparison between self-reported voting intentions and the actual election outcome. As in previous German online election surveys (e.g., Aust et al., 2013; Faas, 2004), respondents who indicated a preference for small parties such as the Greens were overrepresented, and respondents who preferred the major party CDU/CSU were underrepresented in the present study. Our sample was thus not representative of the general population at large. This resulted in a sizable prediction error, which would have been a problem if an accurate predication would have been the goal of the present study. With regard to the question we wanted to address, however, we found that the prediction error did not differ significantly between the mobile-device and desktop respondents. This finding also suggests that mobile-device respondents do not necessarily produce worse answers than desktop respondents.
Our results replicate previous findings (de Bruijne & Oudejans, 2015; de Bruijne & Wijnant, 2014; Lambert & Miller, 2015; Mavletova, 2013; Wells et al., 2014) in showing that mobile-device respondents are younger and tend to more often be female than desktop respondents. With regard to dropout rates and completion times, we again confirmed earlier findings (Lambert & Miller, 2015; Mavletova, 2013; Mavletova & Couper, 2014; Wells et al., 2013). Mobile-device respondents produced higher dropout rates and needed more time to complete the survey than desktop respondents. However, the present study also shows that these procedural differences need not necessarily diminish data validity.
To the best of our knowledge, the present investigation is the first study to systematically compare the reliability and validity of data produced by mobile-device and desktop respondents. Our results strongly suggest that mobile-device users need not pose a threat to data quality and that the validity of their responses may in fact be just as high as the validity of the responses of desktop users. One possible explanation for this result may be that mobile-device users are well aware of the technical limitations of their devices and actively compensate for distractions in their surroundings by participating only in locations and situations that do not preclude their serious and undisturbed participation. The fact that such situations are more difficult to find on the go may account for the higher dropout rate among mobile-device respondents. However, the present data also indicate that mobile-device respondents would prefer to quit than to submit invalid data.
To summarize, our findings suggest that web survey researchers do not necessarily have to be concerned about the participation of mobile-device respondents. The results of our web survey were equally valid regardless of the devices respondents used for participation. In view of the fast spread of mobile devices among the general population and among younger respondents in particular, this finding may be considered encouraging.
It is, however, important to acknowledge that our results may hold only for certain types of web surveys. In the present study, we asked respondents about their political attitudes and voting intentions. The measurement of such long-term and stable attitudes may be quite independent of a respondent’s device because such attitudes can be assumed to already exist and to therefore be less vulnerable to distractions. Moreover, a survey of stable attitudes is not cognitively challenging, and responses are not difficult to create. They may therefore be unaffected even by adverse circumstances. Our recommendation is that researchers should consider which cognitive processes are involved in the completion of a web survey. If response times are important, data produced by mobile respondents may not be comparable to data produced by desktop respondents. Tasks that require the participant to be highly concentrated to produce valid answers may also be more susceptible to distortions than surveys asking for stable attitudes and knowledge. Future studies should examine whether the quality of responses to more cognitively challenging tasks suffers when surveys are answered on mobile devices.
To conclude, the web has become a very popular mode of data collection in market research and in the social sciences. In the future, an increasing number of respondents can be expected to participate in web surveys using mobile devices. Our results suggest that this development need not necessarily compromise the web as a reliable place for data collection. As research on self-administered web surveys is still scarce (de Bruijne & Wijnant, 2013b), more effort is needed to investigate the quality of data submitted by mobile-device respondents, especially in cognitively demanding or time-crucial tasks. On the basis of the present results, our recommendation to other researchers is not to restrict surveys to desktop respondents when surveying stable attitudes on the web. However, more research is needed to provide more detailed answers to the question of how best to survey an increasingly mobile population.
Footnotes
Declaration of Conflicting Interests
The author(s) declared no potential conflicts of interest with respect to the research, authorship, and/or publication of this article.
Funding
The author(s) received no financial support for the research, authorship, and/or publication of this article.